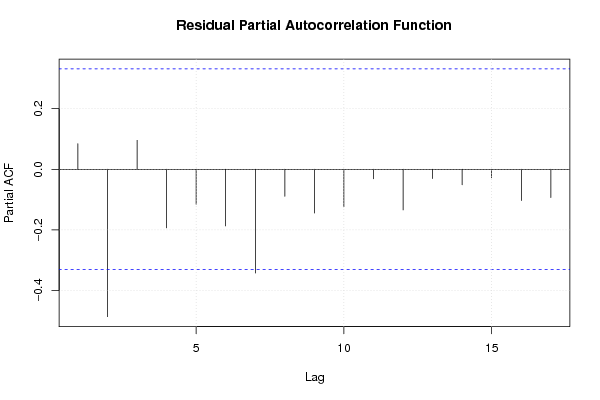
| Multiple Linear Regression - Estimated Regression Equation |
| Jaar[t] = + 14 -1.02805203193725e-17VerstrB[t] + 1.50846009476909e-17ExactB[t] + 6.50465008028154e-18VerstrV[t] + 5.03329606373763e-18ExactV[t] -1.04787884319397e-17VerstrW[t] -6.73638633406018e-18`ExactW `[t] + 1t + e[t] |
| Multiple Linear Regression - Ordinary Least Squares | |||||
| Variable | Parameter | S.D. | T-STAT H0: parameter = 0 | 2-tail p-value | 1-tail p-value |
| (Intercept) | 14 | 0 | 9879970441506714 | 0 | 0 |
| VerstrB | -1.02805203193725e-17 | 0 | -0.8206 | 0.419087 | 0.209543 |
| ExactB | 1.50846009476909e-17 | 0 | 1.2427 | 0.224647 | 0.112323 |
| VerstrV | 6.50465008028154e-18 | 0 | 0.2513 | 0.803505 | 0.401753 |
| ExactV | 5.03329606373763e-18 | 0 | 0.2799 | 0.781683 | 0.390842 |
| VerstrW | -1.04787884319397e-17 | 0 | -0.4606 | 0.648757 | 0.324379 |
| `ExactW ` | -6.73638633406018e-18 | 0 | -0.2041 | 0.839834 | 0.419917 |
| t | 1 | 0 | 19031112378560384 | 0 | 0 |
| Multiple Linear Regression - Regression Statistics | |
| Multiple R | 1 |
| R-squared | 1 |
| Adjusted R-squared | 1 |
| F-TEST (value) | 1.07985078615822e+32 |
| F-TEST (DF numerator) | 7 |
| F-TEST (DF denominator) | 27 |
| p-value | 0 |
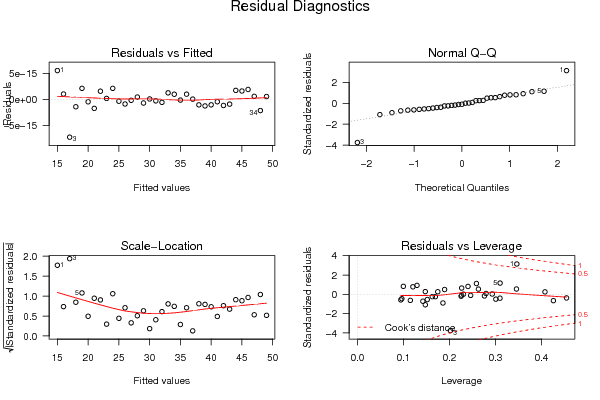
| Multiple Linear Regression - Residual Statistics | |
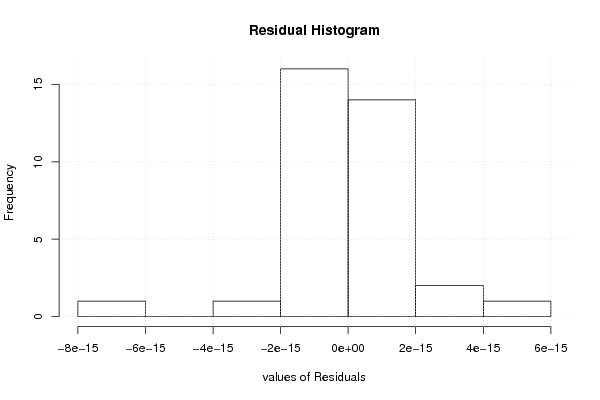
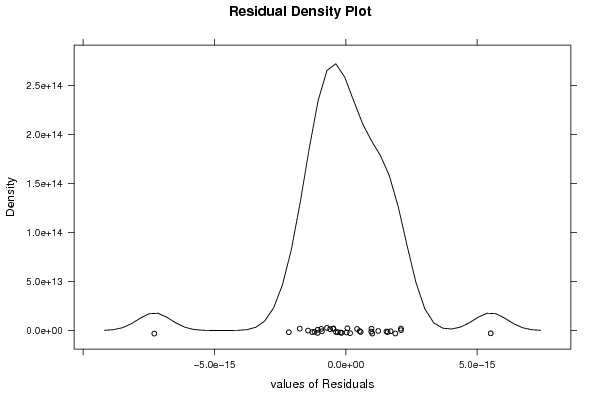
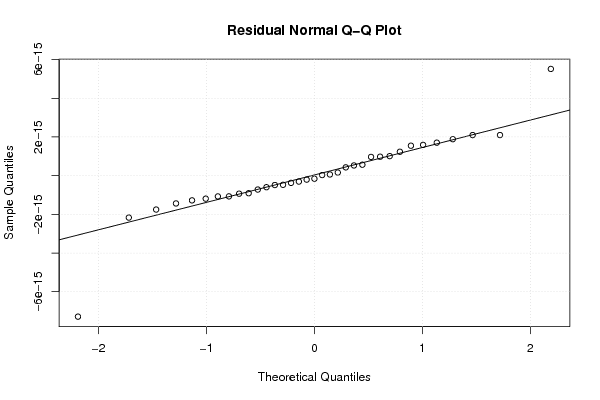
| Residual Standard Deviation | 2.17321760050666e-15 |
| Sum Squared Residuals | 1.27517617957102e-28 |
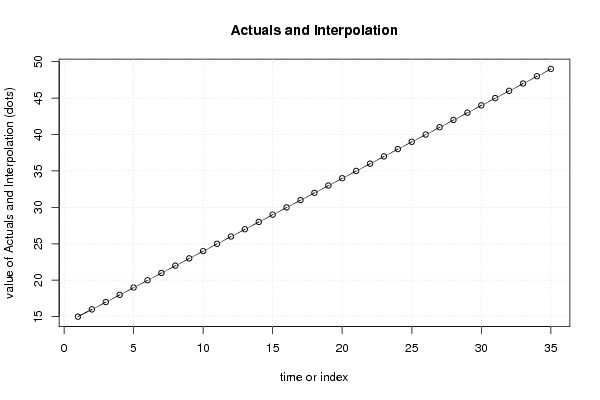
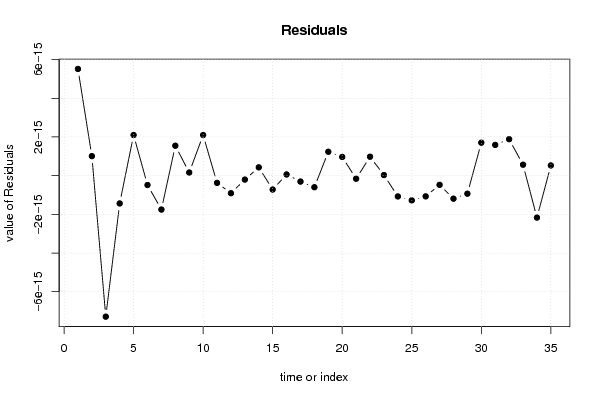
| Multiple Linear Regression - Actuals, Interpolation, and Residuals | |||
| Time or Index | Actuals | Interpolation Forecast | Residuals Prediction Error |
| 1 | 15 | 15 | 5.51663672104164e-15 |
| 2 | 16 | 16 | 1.00904484738459e-15 |
| 3 | 17 | 17 | -7.2890954398171e-15 |
| 4 | 18 | 18 | -1.43742258638476e-15 |
| 5 | 19 | 19 | 2.10004053779115e-15 |
| 6 | 20 | 20 | -4.84049662321525e-16 |
| 7 | 21 | 21 | -1.75198478713631e-15 |
| 8 | 22 | 22 | 1.54729164081008e-15 |
| 9 | 23 | 23 | 1.6213607302485e-16 |
| 10 | 24 | 24 | 2.09804135218996e-15 |
| 11 | 25 | 25 | -3.74063429187803e-16 |
| 12 | 26 | 26 | -9.07319514494898e-16 |
| 13 | 27 | 27 | -2.03759234512508e-16 |
| 14 | 28 | 28 | 4.29417446386812e-16 |
| 15 | 29 | 29 | -7.1753937696882e-16 |
| 16 | 30 | 30 | 6.14355808761856e-17 |
| 17 | 31 | 31 | -3.05828822486142e-16 |
| 18 | 32 | 32 | -5.97307321439702e-16 |
| 19 | 33 | 33 | 1.23560262553748e-15 |
| 20 | 34 | 34 | 9.68095383890868e-16 |
| 21 | 35 | 35 | -1.5779803003748e-16 |
| 22 | 36 | 36 | 9.78351590927233e-16 |
| 23 | 37 | 37 | 3.12423025524816e-17 |
| 24 | 38 | 38 | -1.07335138714874e-15 |
| 25 | 39 | 39 | -1.27734042005247e-15 |
| 26 | 40 | 40 | -1.07114658560709e-15 |
| 27 | 41 | 41 | -4.73461490399311e-16 |
| 28 | 42 | 42 | -1.18981076787204e-15 |
| 29 | 43 | 43 | -9.32565343059672e-16 |
| 30 | 44 | 44 | 1.70487203983169e-15 |
| 31 | 45 | 45 | 1.59004457865642e-15 |
| 32 | 46 | 46 | 1.88567226648649e-15 |
| 33 | 47 | 47 | 5.65903941818436e-16 |
| 34 | 48 | 48 | -2.16755319761824e-15 |
| 35 | 49 | 49 | 5.27568467338226e-16 |
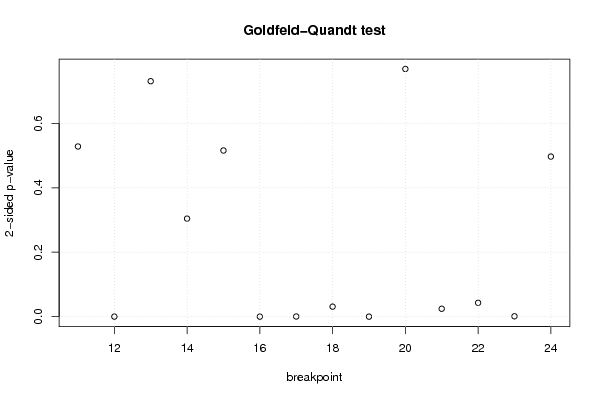
| Goldfeld-Quandt test for Heteroskedasticity | |||
| p-values | Alternative Hypothesis | ||
| breakpoint index | greater | 2-sided | less |
| 11 | 0.264167949923305 | 0.528335899846611 | 0.735832050076694 |
| 12 | 4.6015677353884e-05 | 9.20313547077681e-05 | 0.999953984322646 |
| 13 | 0.365500291579228 | 0.731000583158456 | 0.634499708420772 |
| 14 | 0.847789090437231 | 0.304421819125538 | 0.152210909562769 |
| 15 | 0.742055920438123 | 0.515888159123754 | 0.257944079561877 |
| 16 | 8.76092349709768e-09 | 1.75218469941954e-08 | 0.999999991239076 |
| 17 | 0.000235991497581452 | 0.000471982995162904 | 0.999764008502419 |
| 18 | 0.0155318971774855 | 0.0310637943549711 | 0.984468102822514 |
| 19 | 0.999999981898631 | 3.62027384421256e-08 | 1.81013692210628e-08 |
| 20 | 0.384535546240221 | 0.769071092480443 | 0.615464453759779 |
| 21 | 0.987744972125951 | 0.0245100557480982 | 0.0122550278740491 |
| 22 | 0.97852602951021 | 0.0429479409795795 | 0.0214739704897897 |
| 23 | 0.999429656358657 | 0.00114068728268675 | 0.000570343641343376 |
| 24 | 0.751490259540581 | 0.497019480918838 | 0.248509740459419 |
| Meta Analysis of Goldfeld-Quandt test for Heteroskedasticity | |||
| Description | # significant tests | % significant tests | OK/NOK |
| 1% type I error level | 5 | 0.357142857142857 | NOK |
| 5% type I error level | 8 | 0.571428571428571 | NOK |
| 10% type I error level | 8 | 0.571428571428571 | NOK |