Free Statistics

of Irreproducible Research!

Author's title

Author*The author of this computation has been verified*
R Software Modulerwasp_multipleregression.wasp
Title produced by softwareMultiple Regression
Date of computationWed, 23 Nov 2011 10:18:06 -0500
Cite this page as followsStatistical Computations at FreeStatistics.org, Office for Research Development and Education, URL https://freestatistics.org/blog/index.php?v=date/2011/Nov/23/t1322061568k8t6kqj46kj53x1.htm/, Retrieved Wed, 24 Apr 2024 22:17:14 +0000
Statistical Computations at FreeStatistics.org, Office for Research Development and Education, URL https://freestatistics.org/blog/index.php?pk=146535, Retrieved Wed, 24 Apr 2024 22:17:14 +0000
QR Codes:

Original text written by user:
IsPrivate?No (this computation is public)
User-defined keywords
Estimated Impact89
Family? (F = Feedback message, R = changed R code, M = changed R Module, P = changed Parameters, D = changed Data)
-       [Multiple Regression] [Ws 7 - defi] [2011-11-23 15:18:06] [746438a23403f20b2dde308bafe866ab] [Current]
Feedback Forum

Post a new message
Dataseries X:
15	23	14	8	6	19	12
16	39	23	22	13	55	40
17	94	69	50	35	98	74
18	182	127	117	77	188	137
19	347	258	188	148	310	257
20	498	430	298	248	404	336
21	646	590	404	349	491	455
22	802	731	535	465	642	578
23	786	783	642	593	753	675
24	875	830	811	703	879	818
25	985	909	1015	912	1034	951
26	1022	1011	1269	1150	1243	1149
27	1064	1034	1442	1368	1355	1299
28	1120	1126	1555	1506	1437	1411
29	1270	1213	1610	1599	1412	1433
30	1285	1297	1537	1560	1339	1388
31	1271	1261	1386	1486	1211	1299
32	1289	1237	1159	1274	1089	1142
33	1197	1280	992	1061	940	1012
34	1086	1133	803	923	806	858
35	998	1085	664	725	687	760
36	842	874	509	581	528	605
37	742	817	381	443	456	479
38	623	669	271	322	346	414
39	514	570	199	236	242	281
40	423	460	137	165	168	199
41	264	357	87	109	123	150
42	158	213	49	66	67	89
43	105	107	27	35	35	47
44	59	93	10	17	17	28
45	46	45	6	6	12	14
46	16	25	4	5	8	7
47	22	18	1	2	4	6
48	3	14	1	1	2	4
49	5	3	0	1	1	1


Summary of computational transaction
Raw Inputview raw input (R code)
Raw Outputview raw output of R engine
Computing time4 seconds
R Server'Gertrude Mary Cox' @ cox.wessa.net
R Framework error message
The field 'Names of X columns' contains a hard return which cannot be interpreted.
Please, resubmit your request without hard returns in the 'Names of X columns'.

\begin{tabular}{lllllllll}
\hline
Summary of computational transaction \tabularnewline
Raw Input & view raw input (R code)  \tabularnewline
Raw Output & view raw output of R engine  \tabularnewline
Computing time & 4 seconds \tabularnewline
R Server & 'Gertrude Mary Cox' @ cox.wessa.net \tabularnewline
R Framework error message & 
The field 'Names of X columns' contains a hard return which cannot be interpreted.
Please, resubmit your request without hard returns in the 'Names of X columns'.
\tabularnewline \hline \end{tabular} %Source: https://freestatistics.org/blog/index.php?pk=146535&T=0

[TABLE]
[ROW][C]Summary of computational transaction[/C][/ROW]
[ROW][C]Raw Input[/C][C]view raw input (R code) [/C][/ROW]
[ROW][C]Raw Output[/C][C]view raw output of R engine [/C][/ROW]
[ROW][C]Computing time[/C][C]4 seconds[/C][/ROW]
[ROW][C]R Server[/C][C]'Gertrude Mary Cox' @ cox.wessa.net[/C][/ROW]
[ROW][C]R Framework error message[/C][C]
The field 'Names of X columns' contains a hard return which cannot be interpreted.
Please, resubmit your request without hard returns in the 'Names of X columns'.
[/C][/ROW] [/TABLE] Source: https://freestatistics.org/blog/index.php?pk=146535&T=0

Globally Unique Identifier (entire table): ba.freestatistics.org/blog/index.php?pk=146535&T=0

As an alternative you can also use a QR Code:  

The GUIDs for individual cells are displayed in the table below:

Summary of computational transaction
Raw Inputview raw input (R code)
Raw Outputview raw output of R engine
Computing time4 seconds
R Server'Gertrude Mary Cox' @ cox.wessa.net
R Framework error message
The field 'Names of X columns' contains a hard return which cannot be interpreted.
Please, resubmit your request without hard returns in the 'Names of X columns'.


Multiple Linear Regression - Estimated Regression Equation
Jaar[t] = + 14 -1.02805203193725e-17VerstrB[t] + 1.50846009476909e-17ExactB[t] + 6.50465008028154e-18VerstrV[t] + 5.03329606373763e-18ExactV[t] -1.04787884319397e-17VerstrW[t] -6.73638633406018e-18`ExactW `[t] + 1t + e[t]

\begin{tabular}{lllllllll}
\hline
Multiple Linear Regression - Estimated Regression Equation \tabularnewline
Jaar[t] =  +  14 -1.02805203193725e-17VerstrB[t] +  1.50846009476909e-17ExactB[t] +  6.50465008028154e-18VerstrV[t] +  5.03329606373763e-18ExactV[t] -1.04787884319397e-17VerstrW[t] -6.73638633406018e-18`ExactW
`[t] +  1t  + e[t] \tabularnewline
\hline
\end{tabular}
%Source: https://freestatistics.org/blog/index.php?pk=146535&T=1

[TABLE]
[ROW][C]Multiple Linear Regression - Estimated Regression Equation[/C][/ROW]
[ROW][C]Jaar[t] =  +  14 -1.02805203193725e-17VerstrB[t] +  1.50846009476909e-17ExactB[t] +  6.50465008028154e-18VerstrV[t] +  5.03329606373763e-18ExactV[t] -1.04787884319397e-17VerstrW[t] -6.73638633406018e-18`ExactW
`[t] +  1t  + e[t][/C][/ROW]
[/TABLE]
Source: https://freestatistics.org/blog/index.php?pk=146535&T=1

Globally Unique Identifier (entire table): ba.freestatistics.org/blog/index.php?pk=146535&T=1

As an alternative you can also use a QR Code:  

The GUIDs for individual cells are displayed in the table below:

Multiple Linear Regression - Estimated Regression Equation
Jaar[t] = + 14 -1.02805203193725e-17VerstrB[t] + 1.50846009476909e-17ExactB[t] + 6.50465008028154e-18VerstrV[t] + 5.03329606373763e-18ExactV[t] -1.04787884319397e-17VerstrW[t] -6.73638633406018e-18`ExactW `[t] + 1t + e[t]


Multiple Linear Regression - Ordinary Least Squares
VariableParameterS.D.T-STATH0: parameter = 02-tail p-value1-tail p-value
(Intercept)140987997044150671400
VerstrB-1.02805203193725e-170-0.82060.4190870.209543
ExactB1.50846009476909e-1701.24270.2246470.112323
VerstrV6.50465008028154e-1800.25130.8035050.401753
ExactV5.03329606373763e-1800.27990.7816830.390842
VerstrW-1.04787884319397e-170-0.46060.6487570.324379
`ExactW `-6.73638633406018e-180-0.20410.8398340.419917
t101903111237856038400

\begin{tabular}{lllllllll}
\hline
Multiple Linear Regression - Ordinary Least Squares \tabularnewline
Variable & Parameter & S.D. & T-STATH0: parameter = 0 & 2-tail p-value & 1-tail p-value \tabularnewline
(Intercept) & 14 & 0 & 9879970441506714 & 0 & 0 \tabularnewline
VerstrB & -1.02805203193725e-17 & 0 & -0.8206 & 0.419087 & 0.209543 \tabularnewline
ExactB & 1.50846009476909e-17 & 0 & 1.2427 & 0.224647 & 0.112323 \tabularnewline
VerstrV & 6.50465008028154e-18 & 0 & 0.2513 & 0.803505 & 0.401753 \tabularnewline
ExactV & 5.03329606373763e-18 & 0 & 0.2799 & 0.781683 & 0.390842 \tabularnewline
VerstrW & -1.04787884319397e-17 & 0 & -0.4606 & 0.648757 & 0.324379 \tabularnewline
`ExactW
` & -6.73638633406018e-18 & 0 & -0.2041 & 0.839834 & 0.419917 \tabularnewline
t & 1 & 0 & 19031112378560384 & 0 & 0 \tabularnewline
\hline
\end{tabular}
%Source: https://freestatistics.org/blog/index.php?pk=146535&T=2

[TABLE]
[ROW][C]Multiple Linear Regression - Ordinary Least Squares[/C][/ROW]
[ROW][C]Variable[/C][C]Parameter[/C][C]S.D.[/C][C]T-STATH0: parameter = 0[/C][C]2-tail p-value[/C][C]1-tail p-value[/C][/ROW]
[ROW][C](Intercept)[/C][C]14[/C][C]0[/C][C]9879970441506714[/C][C]0[/C][C]0[/C][/ROW]
[ROW][C]VerstrB[/C][C]-1.02805203193725e-17[/C][C]0[/C][C]-0.8206[/C][C]0.419087[/C][C]0.209543[/C][/ROW]
[ROW][C]ExactB[/C][C]1.50846009476909e-17[/C][C]0[/C][C]1.2427[/C][C]0.224647[/C][C]0.112323[/C][/ROW]
[ROW][C]VerstrV[/C][C]6.50465008028154e-18[/C][C]0[/C][C]0.2513[/C][C]0.803505[/C][C]0.401753[/C][/ROW]
[ROW][C]ExactV[/C][C]5.03329606373763e-18[/C][C]0[/C][C]0.2799[/C][C]0.781683[/C][C]0.390842[/C][/ROW]
[ROW][C]VerstrW[/C][C]-1.04787884319397e-17[/C][C]0[/C][C]-0.4606[/C][C]0.648757[/C][C]0.324379[/C][/ROW]
[ROW][C]`ExactW
`[/C][C]-6.73638633406018e-18[/C][C]0[/C][C]-0.2041[/C][C]0.839834[/C][C]0.419917[/C][/ROW]
[ROW][C]t[/C][C]1[/C][C]0[/C][C]19031112378560384[/C][C]0[/C][C]0[/C][/ROW]
[/TABLE]
Source: https://freestatistics.org/blog/index.php?pk=146535&T=2

Globally Unique Identifier (entire table): ba.freestatistics.org/blog/index.php?pk=146535&T=2

As an alternative you can also use a QR Code:  

The GUIDs for individual cells are displayed in the table below:

Multiple Linear Regression - Ordinary Least Squares
VariableParameterS.D.T-STATH0: parameter = 02-tail p-value1-tail p-value
(Intercept)140987997044150671400
VerstrB-1.02805203193725e-170-0.82060.4190870.209543
ExactB1.50846009476909e-1701.24270.2246470.112323
VerstrV6.50465008028154e-1800.25130.8035050.401753
ExactV5.03329606373763e-1800.27990.7816830.390842
VerstrW-1.04787884319397e-170-0.46060.6487570.324379
`ExactW `-6.73638633406018e-180-0.20410.8398340.419917
t101903111237856038400


Multiple Linear Regression - Regression Statistics
Multiple R1
R-squared1
Adjusted R-squared1
F-TEST (value)1.07985078615822e+32
F-TEST (DF numerator)7
F-TEST (DF denominator)27
p-value0
Multiple Linear Regression - Residual Statistics
Residual Standard Deviation2.17321760050666e-15
Sum Squared Residuals1.27517617957102e-28

\begin{tabular}{lllllllll}
\hline
Multiple Linear Regression - Regression Statistics \tabularnewline
Multiple R & 1 \tabularnewline
R-squared & 1 \tabularnewline
Adjusted R-squared & 1 \tabularnewline
F-TEST (value) & 1.07985078615822e+32 \tabularnewline
F-TEST (DF numerator) & 7 \tabularnewline
F-TEST (DF denominator) & 27 \tabularnewline
p-value & 0 \tabularnewline
Multiple Linear Regression - Residual Statistics \tabularnewline
Residual Standard Deviation & 2.17321760050666e-15 \tabularnewline
Sum Squared Residuals & 1.27517617957102e-28 \tabularnewline
\hline
\end{tabular}
%Source: https://freestatistics.org/blog/index.php?pk=146535&T=3

[TABLE]
[ROW][C]Multiple Linear Regression - Regression Statistics[/C][/ROW]
[ROW][C]Multiple R[/C][C]1[/C][/ROW]
[ROW][C]R-squared[/C][C]1[/C][/ROW]
[ROW][C]Adjusted R-squared[/C][C]1[/C][/ROW]
[ROW][C]F-TEST (value)[/C][C]1.07985078615822e+32[/C][/ROW]
[ROW][C]F-TEST (DF numerator)[/C][C]7[/C][/ROW]
[ROW][C]F-TEST (DF denominator)[/C][C]27[/C][/ROW]
[ROW][C]p-value[/C][C]0[/C][/ROW]
[ROW][C]Multiple Linear Regression - Residual Statistics[/C][/ROW]
[ROW][C]Residual Standard Deviation[/C][C]2.17321760050666e-15[/C][/ROW]
[ROW][C]Sum Squared Residuals[/C][C]1.27517617957102e-28[/C][/ROW]
[/TABLE]
Source: https://freestatistics.org/blog/index.php?pk=146535&T=3

Globally Unique Identifier (entire table): ba.freestatistics.org/blog/index.php?pk=146535&T=3

As an alternative you can also use a QR Code:  

The GUIDs for individual cells are displayed in the table below:

Multiple Linear Regression - Regression Statistics
Multiple R1
R-squared1
Adjusted R-squared1
F-TEST (value)1.07985078615822e+32
F-TEST (DF numerator)7
F-TEST (DF denominator)27
p-value0
Multiple Linear Regression - Residual Statistics
Residual Standard Deviation2.17321760050666e-15
Sum Squared Residuals1.27517617957102e-28


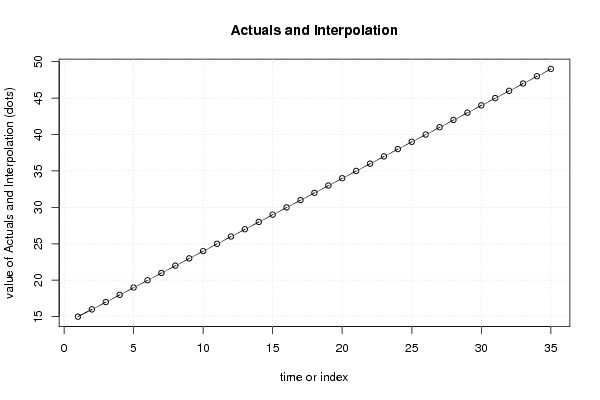
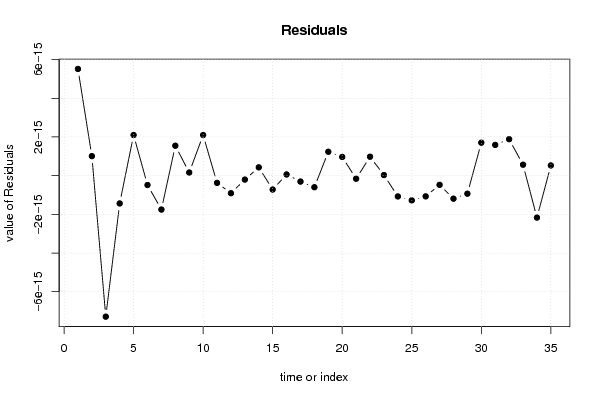
Multiple Linear Regression - Actuals, Interpolation, and Residuals
Time or IndexActualsInterpolationForecastResidualsPrediction Error
115155.51663672104164e-15
216161.00904484738459e-15
31717-7.2890954398171e-15
41818-1.43742258638476e-15
519192.10004053779115e-15
62020-4.84049662321525e-16
72121-1.75198478713631e-15
822221.54729164081008e-15
923231.6213607302485e-16
1024242.09804135218996e-15
112525-3.74063429187803e-16
122626-9.07319514494898e-16
132727-2.03759234512508e-16
1428284.29417446386812e-16
152929-7.1753937696882e-16
1630306.14355808761856e-17
173131-3.05828822486142e-16
183232-5.97307321439702e-16
1933331.23560262553748e-15
2034349.68095383890868e-16
213535-1.5779803003748e-16
2236369.78351590927233e-16
2337373.12423025524816e-17
243838-1.07335138714874e-15
253939-1.27734042005247e-15
264040-1.07114658560709e-15
274141-4.73461490399311e-16
284242-1.18981076787204e-15
294343-9.32565343059672e-16
3044441.70487203983169e-15
3145451.59004457865642e-15
3246461.88567226648649e-15
3347475.65903941818436e-16
344848-2.16755319761824e-15
3549495.27568467338226e-16

\begin{tabular}{lllllllll}
\hline
Multiple Linear Regression - Actuals, Interpolation, and Residuals \tabularnewline
Time or Index & Actuals & InterpolationForecast & ResidualsPrediction Error \tabularnewline
1 & 15 & 15 & 5.51663672104164e-15 \tabularnewline
2 & 16 & 16 & 1.00904484738459e-15 \tabularnewline
3 & 17 & 17 & -7.2890954398171e-15 \tabularnewline
4 & 18 & 18 & -1.43742258638476e-15 \tabularnewline
5 & 19 & 19 & 2.10004053779115e-15 \tabularnewline
6 & 20 & 20 & -4.84049662321525e-16 \tabularnewline
7 & 21 & 21 & -1.75198478713631e-15 \tabularnewline
8 & 22 & 22 & 1.54729164081008e-15 \tabularnewline
9 & 23 & 23 & 1.6213607302485e-16 \tabularnewline
10 & 24 & 24 & 2.09804135218996e-15 \tabularnewline
11 & 25 & 25 & -3.74063429187803e-16 \tabularnewline
12 & 26 & 26 & -9.07319514494898e-16 \tabularnewline
13 & 27 & 27 & -2.03759234512508e-16 \tabularnewline
14 & 28 & 28 & 4.29417446386812e-16 \tabularnewline
15 & 29 & 29 & -7.1753937696882e-16 \tabularnewline
16 & 30 & 30 & 6.14355808761856e-17 \tabularnewline
17 & 31 & 31 & -3.05828822486142e-16 \tabularnewline
18 & 32 & 32 & -5.97307321439702e-16 \tabularnewline
19 & 33 & 33 & 1.23560262553748e-15 \tabularnewline
20 & 34 & 34 & 9.68095383890868e-16 \tabularnewline
21 & 35 & 35 & -1.5779803003748e-16 \tabularnewline
22 & 36 & 36 & 9.78351590927233e-16 \tabularnewline
23 & 37 & 37 & 3.12423025524816e-17 \tabularnewline
24 & 38 & 38 & -1.07335138714874e-15 \tabularnewline
25 & 39 & 39 & -1.27734042005247e-15 \tabularnewline
26 & 40 & 40 & -1.07114658560709e-15 \tabularnewline
27 & 41 & 41 & -4.73461490399311e-16 \tabularnewline
28 & 42 & 42 & -1.18981076787204e-15 \tabularnewline
29 & 43 & 43 & -9.32565343059672e-16 \tabularnewline
30 & 44 & 44 & 1.70487203983169e-15 \tabularnewline
31 & 45 & 45 & 1.59004457865642e-15 \tabularnewline
32 & 46 & 46 & 1.88567226648649e-15 \tabularnewline
33 & 47 & 47 & 5.65903941818436e-16 \tabularnewline
34 & 48 & 48 & -2.16755319761824e-15 \tabularnewline
35 & 49 & 49 & 5.27568467338226e-16 \tabularnewline
\hline
\end{tabular}
%Source: https://freestatistics.org/blog/index.php?pk=146535&T=4

[TABLE]
[ROW][C]Multiple Linear Regression - Actuals, Interpolation, and Residuals[/C][/ROW]
[ROW][C]Time or Index[/C][C]Actuals[/C][C]InterpolationForecast[/C][C]ResidualsPrediction Error[/C][/ROW]
[ROW][C]1[/C][C]15[/C][C]15[/C][C]5.51663672104164e-15[/C][/ROW]
[ROW][C]2[/C][C]16[/C][C]16[/C][C]1.00904484738459e-15[/C][/ROW]
[ROW][C]3[/C][C]17[/C][C]17[/C][C]-7.2890954398171e-15[/C][/ROW]
[ROW][C]4[/C][C]18[/C][C]18[/C][C]-1.43742258638476e-15[/C][/ROW]
[ROW][C]5[/C][C]19[/C][C]19[/C][C]2.10004053779115e-15[/C][/ROW]
[ROW][C]6[/C][C]20[/C][C]20[/C][C]-4.84049662321525e-16[/C][/ROW]
[ROW][C]7[/C][C]21[/C][C]21[/C][C]-1.75198478713631e-15[/C][/ROW]
[ROW][C]8[/C][C]22[/C][C]22[/C][C]1.54729164081008e-15[/C][/ROW]
[ROW][C]9[/C][C]23[/C][C]23[/C][C]1.6213607302485e-16[/C][/ROW]
[ROW][C]10[/C][C]24[/C][C]24[/C][C]2.09804135218996e-15[/C][/ROW]
[ROW][C]11[/C][C]25[/C][C]25[/C][C]-3.74063429187803e-16[/C][/ROW]
[ROW][C]12[/C][C]26[/C][C]26[/C][C]-9.07319514494898e-16[/C][/ROW]
[ROW][C]13[/C][C]27[/C][C]27[/C][C]-2.03759234512508e-16[/C][/ROW]
[ROW][C]14[/C][C]28[/C][C]28[/C][C]4.29417446386812e-16[/C][/ROW]
[ROW][C]15[/C][C]29[/C][C]29[/C][C]-7.1753937696882e-16[/C][/ROW]
[ROW][C]16[/C][C]30[/C][C]30[/C][C]6.14355808761856e-17[/C][/ROW]
[ROW][C]17[/C][C]31[/C][C]31[/C][C]-3.05828822486142e-16[/C][/ROW]
[ROW][C]18[/C][C]32[/C][C]32[/C][C]-5.97307321439702e-16[/C][/ROW]
[ROW][C]19[/C][C]33[/C][C]33[/C][C]1.23560262553748e-15[/C][/ROW]
[ROW][C]20[/C][C]34[/C][C]34[/C][C]9.68095383890868e-16[/C][/ROW]
[ROW][C]21[/C][C]35[/C][C]35[/C][C]-1.5779803003748e-16[/C][/ROW]
[ROW][C]22[/C][C]36[/C][C]36[/C][C]9.78351590927233e-16[/C][/ROW]
[ROW][C]23[/C][C]37[/C][C]37[/C][C]3.12423025524816e-17[/C][/ROW]
[ROW][C]24[/C][C]38[/C][C]38[/C][C]-1.07335138714874e-15[/C][/ROW]
[ROW][C]25[/C][C]39[/C][C]39[/C][C]-1.27734042005247e-15[/C][/ROW]
[ROW][C]26[/C][C]40[/C][C]40[/C][C]-1.07114658560709e-15[/C][/ROW]
[ROW][C]27[/C][C]41[/C][C]41[/C][C]-4.73461490399311e-16[/C][/ROW]
[ROW][C]28[/C][C]42[/C][C]42[/C][C]-1.18981076787204e-15[/C][/ROW]
[ROW][C]29[/C][C]43[/C][C]43[/C][C]-9.32565343059672e-16[/C][/ROW]
[ROW][C]30[/C][C]44[/C][C]44[/C][C]1.70487203983169e-15[/C][/ROW]
[ROW][C]31[/C][C]45[/C][C]45[/C][C]1.59004457865642e-15[/C][/ROW]
[ROW][C]32[/C][C]46[/C][C]46[/C][C]1.88567226648649e-15[/C][/ROW]
[ROW][C]33[/C][C]47[/C][C]47[/C][C]5.65903941818436e-16[/C][/ROW]
[ROW][C]34[/C][C]48[/C][C]48[/C][C]-2.16755319761824e-15[/C][/ROW]
[ROW][C]35[/C][C]49[/C][C]49[/C][C]5.27568467338226e-16[/C][/ROW]
[/TABLE]
Source: https://freestatistics.org/blog/index.php?pk=146535&T=4

Globally Unique Identifier (entire table): ba.freestatistics.org/blog/index.php?pk=146535&T=4

As an alternative you can also use a QR Code:  

The GUIDs for individual cells are displayed in the table below:

Multiple Linear Regression - Actuals, Interpolation, and Residuals
Time or IndexActualsInterpolationForecastResidualsPrediction Error
115155.51663672104164e-15
216161.00904484738459e-15
31717-7.2890954398171e-15
41818-1.43742258638476e-15
519192.10004053779115e-15
62020-4.84049662321525e-16
72121-1.75198478713631e-15
822221.54729164081008e-15
923231.6213607302485e-16
1024242.09804135218996e-15
112525-3.74063429187803e-16
122626-9.07319514494898e-16
132727-2.03759234512508e-16
1428284.29417446386812e-16
152929-7.1753937696882e-16
1630306.14355808761856e-17
173131-3.05828822486142e-16
183232-5.97307321439702e-16
1933331.23560262553748e-15
2034349.68095383890868e-16
213535-1.5779803003748e-16
2236369.78351590927233e-16
2337373.12423025524816e-17
243838-1.07335138714874e-15
253939-1.27734042005247e-15
264040-1.07114658560709e-15
274141-4.73461490399311e-16
284242-1.18981076787204e-15
294343-9.32565343059672e-16
3044441.70487203983169e-15
3145451.59004457865642e-15
3246461.88567226648649e-15
3347475.65903941818436e-16
344848-2.16755319761824e-15
3549495.27568467338226e-16


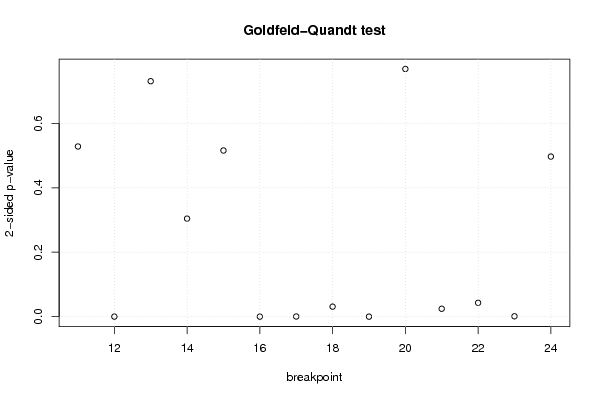
Goldfeld-Quandt test for Heteroskedasticity
p-valuesAlternative Hypothesis
breakpoint indexgreater2-sidedless
110.2641679499233050.5283358998466110.735832050076694
124.6015677353884e-059.20313547077681e-050.999953984322646
130.3655002915792280.7310005831584560.634499708420772
140.8477890904372310.3044218191255380.152210909562769
150.7420559204381230.5158881591237540.257944079561877
168.76092349709768e-091.75218469941954e-080.999999991239076
170.0002359914975814520.0004719829951629040.999764008502419
180.01553189717748550.03106379435497110.984468102822514
190.9999999818986313.62027384421256e-081.81013692210628e-08
200.3845355462402210.7690710924804430.615464453759779
210.9877449721259510.02451005574809820.0122550278740491
220.978526029510210.04294794097957950.0214739704897897
230.9994296563586570.001140687282686750.000570343641343376
240.7514902595405810.4970194809188380.248509740459419

\begin{tabular}{lllllllll}
\hline
Goldfeld-Quandt test for Heteroskedasticity \tabularnewline
p-values & Alternative Hypothesis \tabularnewline
breakpoint index & greater & 2-sided & less \tabularnewline
11 & 0.264167949923305 & 0.528335899846611 & 0.735832050076694 \tabularnewline
12 & 4.6015677353884e-05 & 9.20313547077681e-05 & 0.999953984322646 \tabularnewline
13 & 0.365500291579228 & 0.731000583158456 & 0.634499708420772 \tabularnewline
14 & 0.847789090437231 & 0.304421819125538 & 0.152210909562769 \tabularnewline
15 & 0.742055920438123 & 0.515888159123754 & 0.257944079561877 \tabularnewline
16 & 8.76092349709768e-09 & 1.75218469941954e-08 & 0.999999991239076 \tabularnewline
17 & 0.000235991497581452 & 0.000471982995162904 & 0.999764008502419 \tabularnewline
18 & 0.0155318971774855 & 0.0310637943549711 & 0.984468102822514 \tabularnewline
19 & 0.999999981898631 & 3.62027384421256e-08 & 1.81013692210628e-08 \tabularnewline
20 & 0.384535546240221 & 0.769071092480443 & 0.615464453759779 \tabularnewline
21 & 0.987744972125951 & 0.0245100557480982 & 0.0122550278740491 \tabularnewline
22 & 0.97852602951021 & 0.0429479409795795 & 0.0214739704897897 \tabularnewline
23 & 0.999429656358657 & 0.00114068728268675 & 0.000570343641343376 \tabularnewline
24 & 0.751490259540581 & 0.497019480918838 & 0.248509740459419 \tabularnewline
\hline
\end{tabular}
%Source: https://freestatistics.org/blog/index.php?pk=146535&T=5

[TABLE]
[ROW][C]Goldfeld-Quandt test for Heteroskedasticity[/C][/ROW]
[ROW][C]p-values[/C][C]Alternative Hypothesis[/C][/ROW]
[ROW][C]breakpoint index[/C][C]greater[/C][C]2-sided[/C][C]less[/C][/ROW]
[ROW][C]11[/C][C]0.264167949923305[/C][C]0.528335899846611[/C][C]0.735832050076694[/C][/ROW]
[ROW][C]12[/C][C]4.6015677353884e-05[/C][C]9.20313547077681e-05[/C][C]0.999953984322646[/C][/ROW]
[ROW][C]13[/C][C]0.365500291579228[/C][C]0.731000583158456[/C][C]0.634499708420772[/C][/ROW]
[ROW][C]14[/C][C]0.847789090437231[/C][C]0.304421819125538[/C][C]0.152210909562769[/C][/ROW]
[ROW][C]15[/C][C]0.742055920438123[/C][C]0.515888159123754[/C][C]0.257944079561877[/C][/ROW]
[ROW][C]16[/C][C]8.76092349709768e-09[/C][C]1.75218469941954e-08[/C][C]0.999999991239076[/C][/ROW]
[ROW][C]17[/C][C]0.000235991497581452[/C][C]0.000471982995162904[/C][C]0.999764008502419[/C][/ROW]
[ROW][C]18[/C][C]0.0155318971774855[/C][C]0.0310637943549711[/C][C]0.984468102822514[/C][/ROW]
[ROW][C]19[/C][C]0.999999981898631[/C][C]3.62027384421256e-08[/C][C]1.81013692210628e-08[/C][/ROW]
[ROW][C]20[/C][C]0.384535546240221[/C][C]0.769071092480443[/C][C]0.615464453759779[/C][/ROW]
[ROW][C]21[/C][C]0.987744972125951[/C][C]0.0245100557480982[/C][C]0.0122550278740491[/C][/ROW]
[ROW][C]22[/C][C]0.97852602951021[/C][C]0.0429479409795795[/C][C]0.0214739704897897[/C][/ROW]
[ROW][C]23[/C][C]0.999429656358657[/C][C]0.00114068728268675[/C][C]0.000570343641343376[/C][/ROW]
[ROW][C]24[/C][C]0.751490259540581[/C][C]0.497019480918838[/C][C]0.248509740459419[/C][/ROW]
[/TABLE]
Source: https://freestatistics.org/blog/index.php?pk=146535&T=5

Globally Unique Identifier (entire table): ba.freestatistics.org/blog/index.php?pk=146535&T=5

As an alternative you can also use a QR Code:  

The GUIDs for individual cells are displayed in the table below:

Goldfeld-Quandt test for Heteroskedasticity
p-valuesAlternative Hypothesis
breakpoint indexgreater2-sidedless
110.2641679499233050.5283358998466110.735832050076694
124.6015677353884e-059.20313547077681e-050.999953984322646
130.3655002915792280.7310005831584560.634499708420772
140.8477890904372310.3044218191255380.152210909562769
150.7420559204381230.5158881591237540.257944079561877
168.76092349709768e-091.75218469941954e-080.999999991239076
170.0002359914975814520.0004719829951629040.999764008502419
180.01553189717748550.03106379435497110.984468102822514
190.9999999818986313.62027384421256e-081.81013692210628e-08
200.3845355462402210.7690710924804430.615464453759779
210.9877449721259510.02451005574809820.0122550278740491
220.978526029510210.04294794097957950.0214739704897897
230.9994296563586570.001140687282686750.000570343641343376
240.7514902595405810.4970194809188380.248509740459419


Meta Analysis of Goldfeld-Quandt test for Heteroskedasticity
Description# significant tests% significant testsOK/NOK
1% type I error level50.357142857142857NOK
5% type I error level80.571428571428571NOK
10% type I error level80.571428571428571NOK

\begin{tabular}{lllllllll}
\hline
Meta Analysis of Goldfeld-Quandt test for Heteroskedasticity \tabularnewline
Description & # significant tests & % significant tests & OK/NOK \tabularnewline
1% type I error level & 5 & 0.357142857142857 & NOK \tabularnewline
5% type I error level & 8 & 0.571428571428571 & NOK \tabularnewline
10% type I error level & 8 & 0.571428571428571 & NOK \tabularnewline
\hline
\end{tabular}
%Source: https://freestatistics.org/blog/index.php?pk=146535&T=6

[TABLE]
[ROW][C]Meta Analysis of Goldfeld-Quandt test for Heteroskedasticity[/C][/ROW]
[ROW][C]Description[/C][C]# significant tests[/C][C]% significant tests[/C][C]OK/NOK[/C][/ROW]
[ROW][C]1% type I error level[/C][C]5[/C][C]0.357142857142857[/C][C]NOK[/C][/ROW]
[ROW][C]5% type I error level[/C][C]8[/C][C]0.571428571428571[/C][C]NOK[/C][/ROW]
[ROW][C]10% type I error level[/C][C]8[/C][C]0.571428571428571[/C][C]NOK[/C][/ROW]
[/TABLE]
Source: https://freestatistics.org/blog/index.php?pk=146535&T=6

Globally Unique Identifier (entire table): ba.freestatistics.org/blog/index.php?pk=146535&T=6

As an alternative you can also use a QR Code:  

The GUIDs for individual cells are displayed in the table below:

Meta Analysis of Goldfeld-Quandt test for Heteroskedasticity
Description# significant tests% significant testsOK/NOK
1% type I error level50.357142857142857NOK
5% type I error level80.571428571428571NOK
10% type I error level80.571428571428571NOK


Parameters (Session):
par1 = 1 ; par2 = Do not include Seasonal Dummies ; par3 = Linear Trend ;
Parameters (R input):
par1 = 1 ; par2 = Do not include Seasonal Dummies ; par3 = Linear Trend ;
R code (references can be found in the software module):
library(lattice)
library(lmtest)
n25 <- 25 #minimum number of obs. for Goldfeld-Quandt test
par1 <- as.numeric(par1)
x <- t(y)
k <- length(x[1,])
n <- length(x[,1])
x1 <- cbind(x[,par1], x[,1:k!=par1])
mycolnames <- c(colnames(x)[par1], colnames(x)[1:k!=par1])
colnames(x1) <- mycolnames #colnames(x)[par1]
x <- x1
if (par3 == 'First Differences'){
x2 <- array(0, dim=c(n-1,k), dimnames=list(1:(n-1), paste('(1-B)',colnames(x),sep='')))
for (i in 1:n-1) {
for (j in 1:k) {
x2[i,j] <- x[i+1,j] - x[i,j]
}
}
x <- x2
}
if (par2 == 'Include Monthly Dummies'){
x2 <- array(0, dim=c(n,11), dimnames=list(1:n, paste('M', seq(1:11), sep ='')))
for (i in 1:11){
x2[seq(i,n,12),i] <- 1
}
x <- cbind(x, x2)
}
if (par2 == 'Include Quarterly Dummies'){
x2 <- array(0, dim=c(n,3), dimnames=list(1:n, paste('Q', seq(1:3), sep ='')))
for (i in 1:3){
x2[seq(i,n,4),i] <- 1
}
x <- cbind(x, x2)
}
k <- length(x[1,])
if (par3 == 'Linear Trend'){
x <- cbind(x, c(1:n))
colnames(x)[k+1] <- 't'
}
x
k <- length(x[1,])
df <- as.data.frame(x)
(mylm <- lm(df))
(mysum <- summary(mylm))
if (n > n25) {
kp3 <- k + 3
nmkm3 <- n - k - 3
gqarr <- array(NA, dim=c(nmkm3-kp3+1,3))
numgqtests <- 0
numsignificant1 <- 0
numsignificant5 <- 0
numsignificant10 <- 0
for (mypoint in kp3:nmkm3) {
j <- 0
numgqtests <- numgqtests + 1
for (myalt in c('greater', 'two.sided', 'less')) {
j <- j + 1
gqarr[mypoint-kp3+1,j] <- gqtest(mylm, point=mypoint, alternative=myalt)$p.value
}
if (gqarr[mypoint-kp3+1,2] < 0.01) numsignificant1 <- numsignificant1 + 1
if (gqarr[mypoint-kp3+1,2] < 0.05) numsignificant5 <- numsignificant5 + 1
if (gqarr[mypoint-kp3+1,2] < 0.10) numsignificant10 <- numsignificant10 + 1
}
gqarr
}
bitmap(file='test0.png')
plot(x[,1], type='l', main='Actuals and Interpolation', ylab='value of Actuals and Interpolation (dots)', xlab='time or index')
points(x[,1]-mysum$resid)
grid()
dev.off()
bitmap(file='test1.png')
plot(mysum$resid, type='b', pch=19, main='Residuals', ylab='value of Residuals', xlab='time or index')
grid()
dev.off()
bitmap(file='test2.png')
hist(mysum$resid, main='Residual Histogram', xlab='values of Residuals')
grid()
dev.off()
bitmap(file='test3.png')
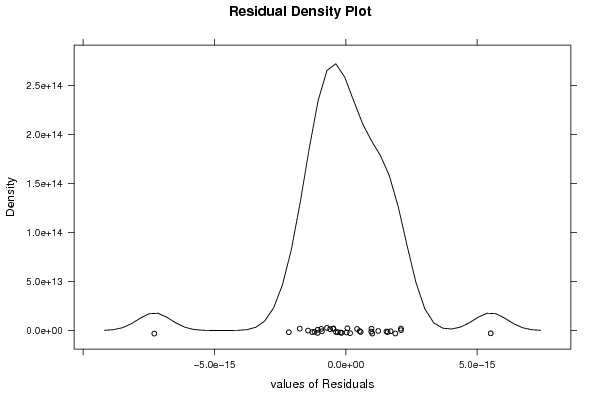
densityplot(~mysum$resid,col='black',main='Residual Density Plot', xlab='values of Residuals')
dev.off()
bitmap(file='test4.png')
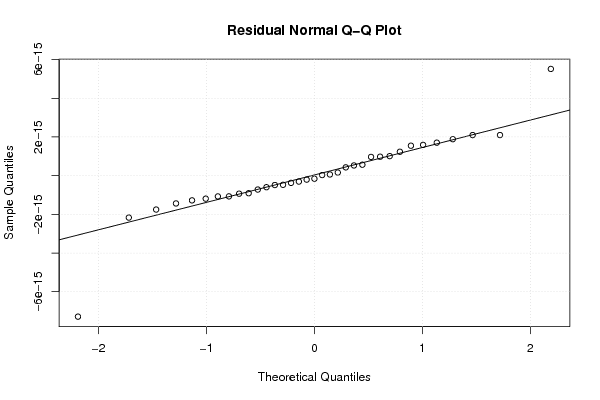
qqnorm(mysum$resid, main='Residual Normal Q-Q Plot')
qqline(mysum$resid)
grid()
dev.off()
(myerror <- as.ts(mysum$resid))
bitmap(file='test5.png')
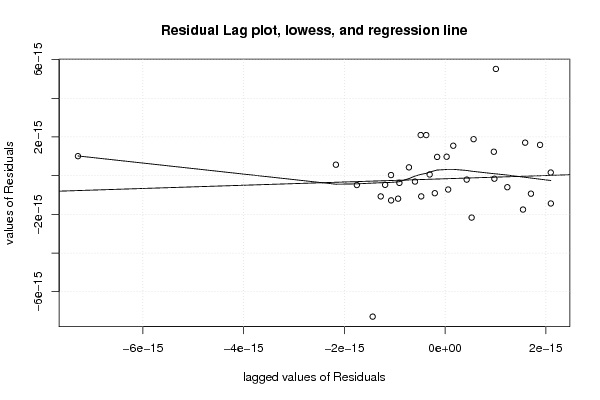
dum <- cbind(lag(myerror,k=1),myerror)
dum
dum1 <- dum[2:length(myerror),]
dum1
z <- as.data.frame(dum1)
z
plot(z,main=paste('Residual Lag plot, lowess, and regression line'), ylab='values of Residuals', xlab='lagged values of Residuals')
lines(lowess(z))
abline(lm(z))
grid()
dev.off()
bitmap(file='test6.png')
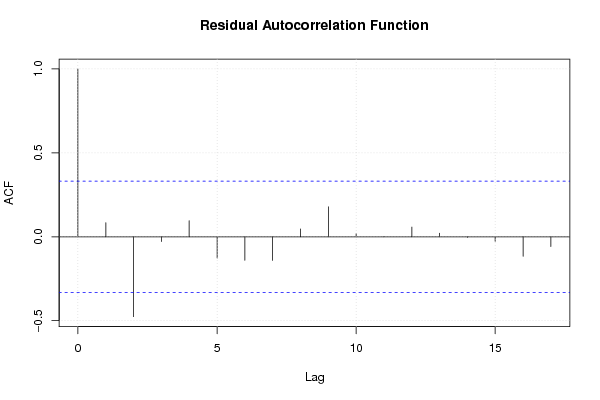
acf(mysum$resid, lag.max=length(mysum$resid)/2, main='Residual Autocorrelation Function')
grid()
dev.off()
bitmap(file='test7.png')
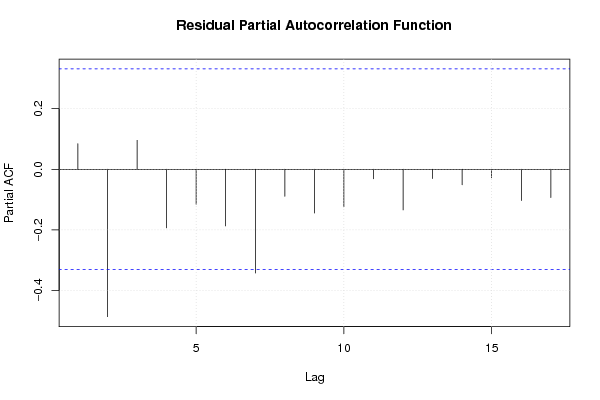
pacf(mysum$resid, lag.max=length(mysum$resid)/2, main='Residual Partial Autocorrelation Function')
grid()
dev.off()
bitmap(file='test8.png')
opar <- par(mfrow = c(2,2), oma = c(0, 0, 1.1, 0))
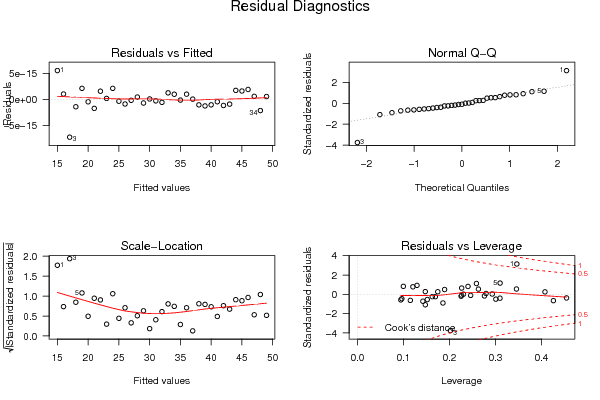
plot(mylm, las = 1, sub='Residual Diagnostics')
par(opar)
dev.off()
if (n > n25) {
bitmap(file='test9.png')
plot(kp3:nmkm3,gqarr[,2], main='Goldfeld-Quandt test',ylab='2-sided p-value',xlab='breakpoint')
grid()
dev.off()
}
load(file='createtable')
a<-table.start()
a<-table.row.start(a)
a<-table.element(a, 'Multiple Linear Regression - Estimated Regression Equation', 1, TRUE)
a<-table.row.end(a)
myeq <- colnames(x)[1]
myeq <- paste(myeq, '[t] = ', sep='')
for (i in 1:k){
if (mysum$coefficients[i,1] > 0) myeq <- paste(myeq, '+', '')
myeq <- paste(myeq, mysum$coefficients[i,1], sep=' ')
if (rownames(mysum$coefficients)[i] != '(Intercept)') {
myeq <- paste(myeq, rownames(mysum$coefficients)[i], sep='')
if (rownames(mysum$coefficients)[i] != 't') myeq <- paste(myeq, '[t]', sep='')
}
}
myeq <- paste(myeq, ' + e[t]')
a<-table.row.start(a)
a<-table.element(a, myeq)
a<-table.row.end(a)
a<-table.end(a)
table.save(a,file='mytable1.tab')
a<-table.start()
a<-table.row.start(a)
a<-table.element(a,hyperlink('ols1.htm','Multiple Linear Regression - Ordinary Least Squares',''), 6, TRUE)
a<-table.row.end(a)
a<-table.row.start(a)
a<-table.element(a,'Variable',header=TRUE)
a<-table.element(a,'Parameter',header=TRUE)
a<-table.element(a,'S.D.',header=TRUE)
a<-table.element(a,'T-STAT
H0: parameter = 0',header=TRUE)
a<-table.element(a,'2-tail p-value',header=TRUE)
a<-table.element(a,'1-tail p-value',header=TRUE)
a<-table.row.end(a)
for (i in 1:k){
a<-table.row.start(a)
a<-table.element(a,rownames(mysum$coefficients)[i],header=TRUE)
a<-table.element(a,mysum$coefficients[i,1])
a<-table.element(a, round(mysum$coefficients[i,2],6))
a<-table.element(a, round(mysum$coefficients[i,3],4))
a<-table.element(a, round(mysum$coefficients[i,4],6))
a<-table.element(a, round(mysum$coefficients[i,4]/2,6))
a<-table.row.end(a)
}
a<-table.end(a)
table.save(a,file='mytable2.tab')
a<-table.start()
a<-table.row.start(a)
a<-table.element(a, 'Multiple Linear Regression - Regression Statistics', 2, TRUE)
a<-table.row.end(a)
a<-table.row.start(a)
a<-table.element(a, 'Multiple R',1,TRUE)
a<-table.element(a, sqrt(mysum$r.squared))
a<-table.row.end(a)
a<-table.row.start(a)
a<-table.element(a, 'R-squared',1,TRUE)
a<-table.element(a, mysum$r.squared)
a<-table.row.end(a)
a<-table.row.start(a)
a<-table.element(a, 'Adjusted R-squared',1,TRUE)
a<-table.element(a, mysum$adj.r.squared)
a<-table.row.end(a)
a<-table.row.start(a)
a<-table.element(a, 'F-TEST (value)',1,TRUE)
a<-table.element(a, mysum$fstatistic[1])
a<-table.row.end(a)
a<-table.row.start(a)
a<-table.element(a, 'F-TEST (DF numerator)',1,TRUE)
a<-table.element(a, mysum$fstatistic[2])
a<-table.row.end(a)
a<-table.row.start(a)
a<-table.element(a, 'F-TEST (DF denominator)',1,TRUE)
a<-table.element(a, mysum$fstatistic[3])
a<-table.row.end(a)
a<-table.row.start(a)
a<-table.element(a, 'p-value',1,TRUE)
a<-table.element(a, 1-pf(mysum$fstatistic[1],mysum$fstatistic[2],mysum$fstatistic[3]))
a<-table.row.end(a)
a<-table.row.start(a)
a<-table.element(a, 'Multiple Linear Regression - Residual Statistics', 2, TRUE)
a<-table.row.end(a)
a<-table.row.start(a)
a<-table.element(a, 'Residual Standard Deviation',1,TRUE)
a<-table.element(a, mysum$sigma)
a<-table.row.end(a)
a<-table.row.start(a)
a<-table.element(a, 'Sum Squared Residuals',1,TRUE)
a<-table.element(a, sum(myerror*myerror))
a<-table.row.end(a)
a<-table.end(a)
table.save(a,file='mytable3.tab')
a<-table.start()
a<-table.row.start(a)
a<-table.element(a, 'Multiple Linear Regression - Actuals, Interpolation, and Residuals', 4, TRUE)
a<-table.row.end(a)
a<-table.row.start(a)
a<-table.element(a, 'Time or Index', 1, TRUE)
a<-table.element(a, 'Actuals', 1, TRUE)
a<-table.element(a, 'Interpolation
Forecast', 1, TRUE)
a<-table.element(a, 'Residuals
Prediction Error', 1, TRUE)
a<-table.row.end(a)
for (i in 1:n) {
a<-table.row.start(a)
a<-table.element(a,i, 1, TRUE)
a<-table.element(a,x[i])
a<-table.element(a,x[i]-mysum$resid[i])
a<-table.element(a,mysum$resid[i])
a<-table.row.end(a)
}
a<-table.end(a)
table.save(a,file='mytable4.tab')
if (n > n25) {
a<-table.start()
a<-table.row.start(a)
a<-table.element(a,'Goldfeld-Quandt test for Heteroskedasticity',4,TRUE)
a<-table.row.end(a)
a<-table.row.start(a)
a<-table.element(a,'p-values',header=TRUE)
a<-table.element(a,'Alternative Hypothesis',3,header=TRUE)
a<-table.row.end(a)
a<-table.row.start(a)
a<-table.element(a,'breakpoint index',header=TRUE)
a<-table.element(a,'greater',header=TRUE)
a<-table.element(a,'2-sided',header=TRUE)
a<-table.element(a,'less',header=TRUE)
a<-table.row.end(a)
for (mypoint in kp3:nmkm3) {
a<-table.row.start(a)
a<-table.element(a,mypoint,header=TRUE)
a<-table.element(a,gqarr[mypoint-kp3+1,1])
a<-table.element(a,gqarr[mypoint-kp3+1,2])
a<-table.element(a,gqarr[mypoint-kp3+1,3])
a<-table.row.end(a)
}
a<-table.end(a)
table.save(a,file='mytable5.tab')
a<-table.start()
a<-table.row.start(a)
a<-table.element(a,'Meta Analysis of Goldfeld-Quandt test for Heteroskedasticity',4,TRUE)
a<-table.row.end(a)
a<-table.row.start(a)
a<-table.element(a,'Description',header=TRUE)
a<-table.element(a,'# significant tests',header=TRUE)
a<-table.element(a,'% significant tests',header=TRUE)
a<-table.element(a,'OK/NOK',header=TRUE)
a<-table.row.end(a)
a<-table.row.start(a)
a<-table.element(a,'1% type I error level',header=TRUE)
a<-table.element(a,numsignificant1)
a<-table.element(a,numsignificant1/numgqtests)
if (numsignificant1/numgqtests < 0.01) dum <- 'OK' else dum <- 'NOK'
a<-table.element(a,dum)
a<-table.row.end(a)
a<-table.row.start(a)
a<-table.element(a,'5% type I error level',header=TRUE)
a<-table.element(a,numsignificant5)
a<-table.element(a,numsignificant5/numgqtests)
if (numsignificant5/numgqtests < 0.05) dum <- 'OK' else dum <- 'NOK'
a<-table.element(a,dum)
a<-table.row.end(a)
a<-table.row.start(a)
a<-table.element(a,'10% type I error level',header=TRUE)
a<-table.element(a,numsignificant10)
a<-table.element(a,numsignificant10/numgqtests)
if (numsignificant10/numgqtests < 0.1) dum <- 'OK' else dum <- 'NOK'
a<-table.element(a,dum)
a<-table.row.end(a)
a<-table.end(a)
table.save(a,file='mytable6.tab')
}