| Multiple Linear Regression - Estimated Regression Equation |
| omzet[t] = -24.4812796787506 + 2.69551552435363Personeel[t] + 1.30256101310347t + e[t] |
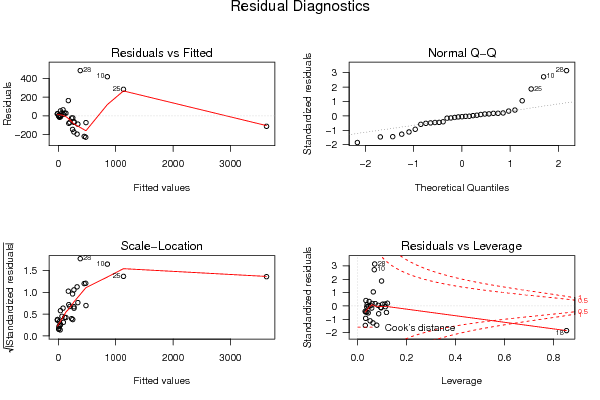
| Multiple Linear Regression - Ordinary Least Squares | |||||
| Variable | Parameter | S.D. | T-STAT H0: parameter = 0 | 2-tail p-value | 1-tail p-value |
| (Intercept) | -24.4812796787506 | 58.489587 | -0.4186 | 0.678521 | 0.33926 |
| Personeel | 2.69551552435363 | 0.118332 | 22.7793 | 0 | 0 |
| t | 1.30256101310347 | 2.920275 | 0.446 | 0.658771 | 0.329385 |
| Multiple Linear Regression - Regression Statistics | |
| Multiple R | 0.972324757475707 |
| R-squared | 0.945415434000193 |
| Adjusted R-squared | 0.941776462933539 |
| F-TEST (value) | 259.802954374556 |
| F-TEST (DF numerator) | 2 |
| F-TEST (DF denominator) | 30 |
| p-value | 0 |
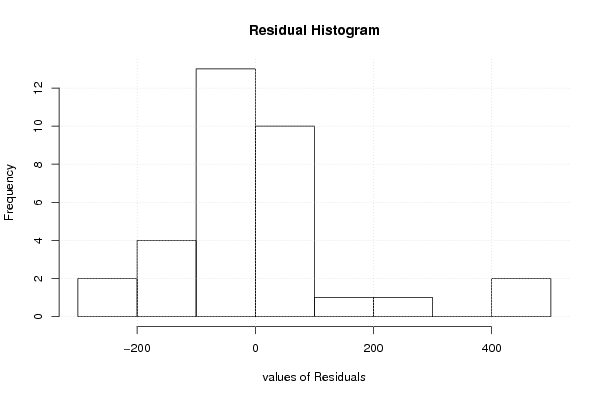
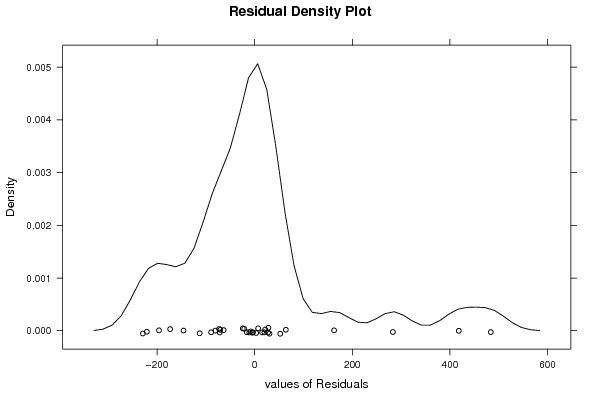
| Multiple Linear Regression - Residual Statistics | |
| Residual Standard Deviation | 159.712427623213 |
| Sum Squared Residuals | 765241.786119 |
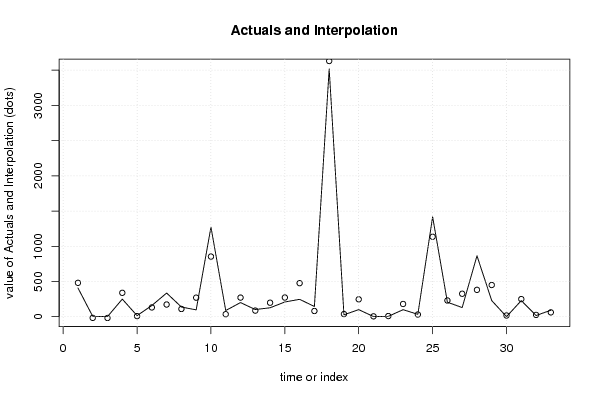
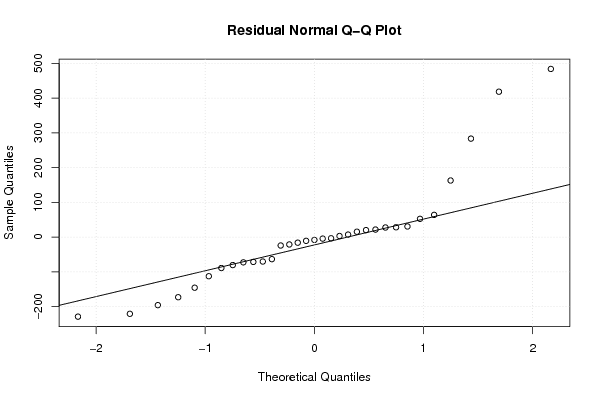
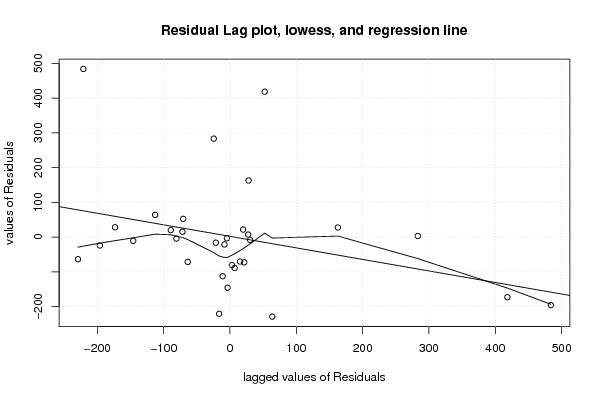
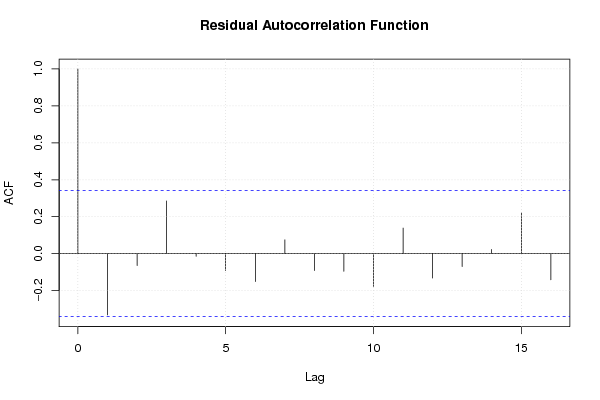
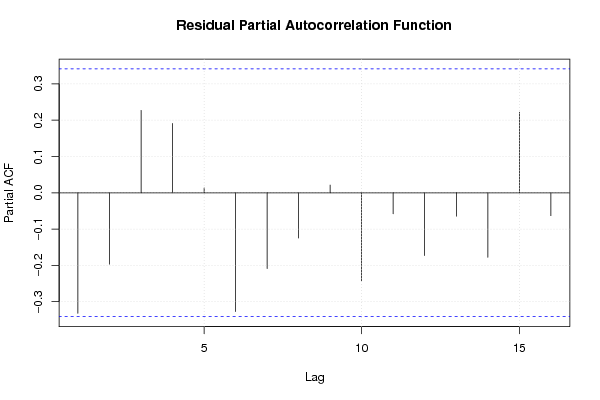
| Multiple Linear Regression - Actuals, Interpolation, and Residuals | |||
| Time or Index | Actuals | Interpolation Forecast | Residuals Prediction Error |
| 1 | 408 | 480.882684388482 | -72.8826843884822 |
| 2 | 5 | -16.4851266038361 | 21.4851266038361 |
| 3 | 2 | -17.8780811150865 | 19.8780811150865 |
| 4 | 250 | 339.232529112696 | -89.2325291126963 |
| 5 | 16 | 8.98668063030305 | 7.01331936969695 |
| 6 | 159 | 131.58744023932 | 27.4125597606801 |
| 7 | 336 | 173.322734117728 | 162.677265882272 |
| 8 | 138 | 109.932922546344 | 28.0670774536558 |
| 9 | 97 | 270.270899496312 | -173.270899496312 |
| 10 | 1272 | 853.8048137698 | 418.1951862302 |
| 11 | 88 | 35.6706553793993 | 52.3293446206007 |
| 12 | 201 | 271.483067011269 | -70.4830670112688 |
| 13 | 102 | 86.7950568439716 | 15.2049431560284 |
| 14 | 127 | 198.613754355574 | -71.613754355574 |
| 15 | 209 | 272.695234526226 | -63.6952345262255 |
| 16 | 247 | 476.161459865851 | -229.161459865851 |
| 17 | 145 | 81.223238798971 | 63.776761201029 |
| 18 | 3517 | 3629.82422986145 | -112.824229861454 |
| 19 | 27 | 38.0045969111662 | -11.0045969111662 |
| 20 | 101 | 246.861853299499 | -145.861853299499 |
| 21 | 2 | 5.56801712077598 | -3.56801712077598 |
| 22 | 5 | 9.56609365823306 | -4.56609365823306 |
| 23 | 100 | 180.686132705615 | -80.6861327056153 |
| 24 | 34 | 31.0398243549154 | 2.9601756450846 |
| 25 | 1418 | 1134.80823482865 | 283.191765171346 |
| 26 | 206 | 230.417579658937 | -24.4175796589375 |
| 27 | 130 | 326.063184024418 | -196.063184024418 |
| 28 | 865 | 381.276055524594 | 483.723944475406 |
| 29 | 229 | 449.966504646538 | -220.966504646538 |
| 30 | 1 | 17.2910662387072 | -16.2910662387072 |
| 31 | 229 | 250.407962346223 | -21.407962346223 |
| 32 | 17 | 25.2872193136214 | -8.2872193136214 |
| 33 | 92 | 61.631482143322 | 30.3685178566779 |
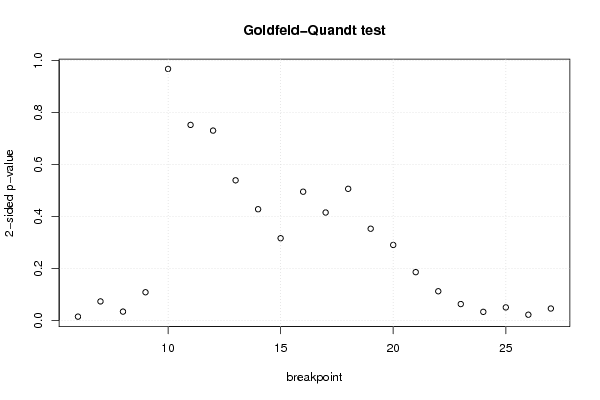
| Goldfeld-Quandt test for Heteroskedasticity | |||
| p-values | Alternative Hypothesis | ||
| breakpoint index | greater | 2-sided | less |
| 6 | 0.00705443452849422 | 0.0141088690569884 | 0.992945565471506 |
| 7 | 0.0363630366901624 | 0.0727260733803249 | 0.963636963309838 |
| 8 | 0.0167547663713047 | 0.0335095327426094 | 0.983245233628695 |
| 9 | 0.0539813788019348 | 0.10796275760387 | 0.946018621198065 |
| 10 | 0.483387017253374 | 0.966774034506748 | 0.516612982746626 |
| 11 | 0.375770741032361 | 0.751541482064722 | 0.624229258967639 |
| 12 | 0.364854121937948 | 0.729708243875896 | 0.635145878062052 |
| 13 | 0.269257630675726 | 0.538515261351452 | 0.730742369324274 |
| 14 | 0.213632832049502 | 0.427265664099004 | 0.786367167950498 |
| 15 | 0.157877783599619 | 0.315755567199238 | 0.84212221640038 |
| 16 | 0.247310670396123 | 0.494621340792246 | 0.752689329603877 |
| 17 | 0.207318618961833 | 0.414637237923666 | 0.792681381038167 |
| 18 | 0.25287418834307 | 0.50574837668614 | 0.74712581165693 |
| 19 | 0.176131455245644 | 0.352262910491287 | 0.823868544754356 |
| 20 | 0.144920343426003 | 0.289840686852006 | 0.855079656573997 |
| 21 | 0.0926563778586411 | 0.185312755717282 | 0.907343622141359 |
| 22 | 0.0559000741650526 | 0.111800148330105 | 0.944099925834947 |
| 23 | 0.0312922278221308 | 0.0625844556442616 | 0.96870777217787 |
| 24 | 0.016261739381646 | 0.0325234787632919 | 0.983738260618354 |
| 25 | 0.0248198675913867 | 0.0496397351827734 | 0.975180132408613 |
| 26 | 0.0107548731841371 | 0.0215097463682743 | 0.989245126815863 |
| 27 | 0.0226503123708656 | 0.0453006247417312 | 0.977349687629134 |
| Meta Analysis of Goldfeld-Quandt test for Heteroskedasticity | |||
| Description | # significant tests | % significant tests | OK/NOK |
| 1% type I error level | 0 | 0 | OK |
| 5% type I error level | 6 | 0.272727272727273 | NOK |
| 10% type I error level | 8 | 0.363636363636364 | NOK |