Free Statistics

of Irreproducible Research!

Author's title

Author*The author of this computation has been verified*
R Software Modulerwasp_multipleregression.wasp
Title produced by softwareMultiple Regression
Date of computationWed, 23 Nov 2011 09:53:14 -0500
Cite this page as followsStatistical Computations at FreeStatistics.org, Office for Research Development and Education, URL https://freestatistics.org/blog/index.php?v=date/2011/Nov/23/t1322060012jd9s1lfx7rpg1k4.htm/, Retrieved Thu, 25 Apr 2024 22:03:13 +0000
Statistical Computations at FreeStatistics.org, Office for Research Development and Education, URL https://freestatistics.org/blog/index.php?pk=146532, Retrieved Thu, 25 Apr 2024 22:03:13 +0000
QR Codes:

Original text written by user:
IsPrivate?No (this computation is public)
User-defined keywords
Estimated Impact87
Family? (F = Feedback message, R = changed R code, M = changed R Module, P = changed Parameters, D = changed Data)
-     [Multiple Regression] [Colombia Coffee -...] [2008-02-26 11:21:57] [74be16979710d4c4e7c6647856088456]
-  MPD  [Multiple Regression] [] [2011-11-23 14:10:39] [489eb911c8db04aca1fc54d886fc3144]
-   PD      [Multiple Regression] [] [2011-11-23 14:53:14] [a478c561bf1feb1bdaba97497ca665e7] [Current]
Feedback Forum

Post a new message
Dataseries X:
408	187
5	2
2	1
250	133
16	10
159	55
336	70
138	46
97	105
1272	321
88	17
201	104
102	35
127	76
209	103
247	178
145	31
3517	1347
27	14
101	91
2	1
5	2
100	65
34	9
1418	418
206	82
130	117
865	137
229	162
1	1
229	87
17	3
92	16


Summary of computational transaction
Raw Inputview raw input (R code)
Raw Outputview raw output of R engine
Computing time5 seconds
R Server'George Udny Yule' @ yule.wessa.net

\begin{tabular}{lllllllll}
\hline
Summary of computational transaction \tabularnewline
Raw Input & view raw input (R code)  \tabularnewline
Raw Output & view raw output of R engine  \tabularnewline
Computing time & 5 seconds \tabularnewline
R Server & 'George Udny Yule' @ yule.wessa.net \tabularnewline
\hline
\end{tabular}
%Source: https://freestatistics.org/blog/index.php?pk=146532&T=0

[TABLE]
[ROW][C]Summary of computational transaction[/C][/ROW]
[ROW][C]Raw Input[/C][C]view raw input (R code) [/C][/ROW]
[ROW][C]Raw Output[/C][C]view raw output of R engine [/C][/ROW]
[ROW][C]Computing time[/C][C]5 seconds[/C][/ROW]
[ROW][C]R Server[/C][C]'George Udny Yule' @ yule.wessa.net[/C][/ROW]
[/TABLE]
Source: https://freestatistics.org/blog/index.php?pk=146532&T=0

Globally Unique Identifier (entire table): ba.freestatistics.org/blog/index.php?pk=146532&T=0

As an alternative you can also use a QR Code:  

The GUIDs for individual cells are displayed in the table below:

Summary of computational transaction
Raw Inputview raw input (R code)
Raw Outputview raw output of R engine
Computing time5 seconds
R Server'George Udny Yule' @ yule.wessa.net


Multiple Linear Regression - Estimated Regression Equation
omzet[t] = -24.4812796787506 + 2.69551552435363Personeel[t] + 1.30256101310347t + e[t]

\begin{tabular}{lllllllll}
\hline
Multiple Linear Regression - Estimated Regression Equation \tabularnewline
omzet[t] =  -24.4812796787506 +  2.69551552435363Personeel[t] +  1.30256101310347t  + e[t] \tabularnewline
\hline
\end{tabular}
%Source: https://freestatistics.org/blog/index.php?pk=146532&T=1

[TABLE]
[ROW][C]Multiple Linear Regression - Estimated Regression Equation[/C][/ROW]
[ROW][C]omzet[t] =  -24.4812796787506 +  2.69551552435363Personeel[t] +  1.30256101310347t  + e[t][/C][/ROW]
[/TABLE]
Source: https://freestatistics.org/blog/index.php?pk=146532&T=1

Globally Unique Identifier (entire table): ba.freestatistics.org/blog/index.php?pk=146532&T=1

As an alternative you can also use a QR Code:  

The GUIDs for individual cells are displayed in the table below:

Multiple Linear Regression - Estimated Regression Equation
omzet[t] = -24.4812796787506 + 2.69551552435363Personeel[t] + 1.30256101310347t + e[t]


Multiple Linear Regression - Ordinary Least Squares
VariableParameterS.D.T-STATH0: parameter = 02-tail p-value1-tail p-value
(Intercept)-24.481279678750658.489587-0.41860.6785210.33926
Personeel2.695515524353630.11833222.779300
t1.302561013103472.9202750.4460.6587710.329385

\begin{tabular}{lllllllll}
\hline
Multiple Linear Regression - Ordinary Least Squares \tabularnewline
Variable & Parameter & S.D. & T-STATH0: parameter = 0 & 2-tail p-value & 1-tail p-value \tabularnewline
(Intercept) & -24.4812796787506 & 58.489587 & -0.4186 & 0.678521 & 0.33926 \tabularnewline
Personeel & 2.69551552435363 & 0.118332 & 22.7793 & 0 & 0 \tabularnewline
t & 1.30256101310347 & 2.920275 & 0.446 & 0.658771 & 0.329385 \tabularnewline
\hline
\end{tabular}
%Source: https://freestatistics.org/blog/index.php?pk=146532&T=2

[TABLE]
[ROW][C]Multiple Linear Regression - Ordinary Least Squares[/C][/ROW]
[ROW][C]Variable[/C][C]Parameter[/C][C]S.D.[/C][C]T-STATH0: parameter = 0[/C][C]2-tail p-value[/C][C]1-tail p-value[/C][/ROW]
[ROW][C](Intercept)[/C][C]-24.4812796787506[/C][C]58.489587[/C][C]-0.4186[/C][C]0.678521[/C][C]0.33926[/C][/ROW]
[ROW][C]Personeel[/C][C]2.69551552435363[/C][C]0.118332[/C][C]22.7793[/C][C]0[/C][C]0[/C][/ROW]
[ROW][C]t[/C][C]1.30256101310347[/C][C]2.920275[/C][C]0.446[/C][C]0.658771[/C][C]0.329385[/C][/ROW]
[/TABLE]
Source: https://freestatistics.org/blog/index.php?pk=146532&T=2

Globally Unique Identifier (entire table): ba.freestatistics.org/blog/index.php?pk=146532&T=2

As an alternative you can also use a QR Code:  

The GUIDs for individual cells are displayed in the table below:

Multiple Linear Regression - Ordinary Least Squares
VariableParameterS.D.T-STATH0: parameter = 02-tail p-value1-tail p-value
(Intercept)-24.481279678750658.489587-0.41860.6785210.33926
Personeel2.695515524353630.11833222.779300
t1.302561013103472.9202750.4460.6587710.329385


Multiple Linear Regression - Regression Statistics
Multiple R0.972324757475707
R-squared0.945415434000193
Adjusted R-squared0.941776462933539
F-TEST (value)259.802954374556
F-TEST (DF numerator)2
F-TEST (DF denominator)30
p-value0
Multiple Linear Regression - Residual Statistics
Residual Standard Deviation159.712427623213
Sum Squared Residuals765241.786119

\begin{tabular}{lllllllll}
\hline
Multiple Linear Regression - Regression Statistics \tabularnewline
Multiple R & 0.972324757475707 \tabularnewline
R-squared & 0.945415434000193 \tabularnewline
Adjusted R-squared & 0.941776462933539 \tabularnewline
F-TEST (value) & 259.802954374556 \tabularnewline
F-TEST (DF numerator) & 2 \tabularnewline
F-TEST (DF denominator) & 30 \tabularnewline
p-value & 0 \tabularnewline
Multiple Linear Regression - Residual Statistics \tabularnewline
Residual Standard Deviation & 159.712427623213 \tabularnewline
Sum Squared Residuals & 765241.786119 \tabularnewline
\hline
\end{tabular}
%Source: https://freestatistics.org/blog/index.php?pk=146532&T=3

[TABLE]
[ROW][C]Multiple Linear Regression - Regression Statistics[/C][/ROW]
[ROW][C]Multiple R[/C][C]0.972324757475707[/C][/ROW]
[ROW][C]R-squared[/C][C]0.945415434000193[/C][/ROW]
[ROW][C]Adjusted R-squared[/C][C]0.941776462933539[/C][/ROW]
[ROW][C]F-TEST (value)[/C][C]259.802954374556[/C][/ROW]
[ROW][C]F-TEST (DF numerator)[/C][C]2[/C][/ROW]
[ROW][C]F-TEST (DF denominator)[/C][C]30[/C][/ROW]
[ROW][C]p-value[/C][C]0[/C][/ROW]
[ROW][C]Multiple Linear Regression - Residual Statistics[/C][/ROW]
[ROW][C]Residual Standard Deviation[/C][C]159.712427623213[/C][/ROW]
[ROW][C]Sum Squared Residuals[/C][C]765241.786119[/C][/ROW]
[/TABLE]
Source: https://freestatistics.org/blog/index.php?pk=146532&T=3

Globally Unique Identifier (entire table): ba.freestatistics.org/blog/index.php?pk=146532&T=3

As an alternative you can also use a QR Code:  

The GUIDs for individual cells are displayed in the table below:

Multiple Linear Regression - Regression Statistics
Multiple R0.972324757475707
R-squared0.945415434000193
Adjusted R-squared0.941776462933539
F-TEST (value)259.802954374556
F-TEST (DF numerator)2
F-TEST (DF denominator)30
p-value0
Multiple Linear Regression - Residual Statistics
Residual Standard Deviation159.712427623213
Sum Squared Residuals765241.786119


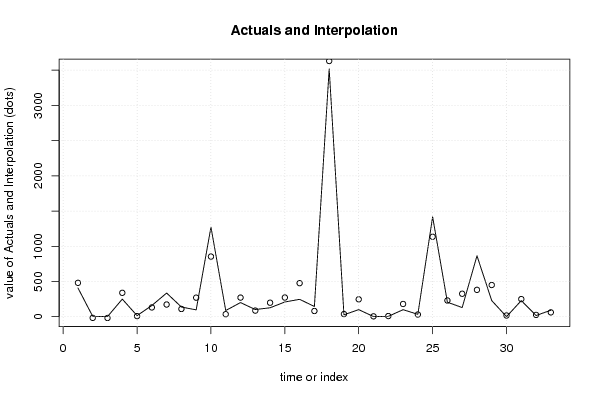
Multiple Linear Regression - Actuals, Interpolation, and Residuals
Time or IndexActualsInterpolationForecastResidualsPrediction Error
1408480.882684388482-72.8826843884822
25-16.485126603836121.4851266038361
32-17.878081115086519.8780811150865
4250339.232529112696-89.2325291126963
5168.986680630303057.01331936969695
6159131.5874402393227.4125597606801
7336173.322734117728162.677265882272
8138109.93292254634428.0670774536558
997270.270899496312-173.270899496312
101272853.8048137698418.1951862302
118835.670655379399352.3293446206007
12201271.483067011269-70.4830670112688
1310286.795056843971615.2049431560284
14127198.613754355574-71.613754355574
15209272.695234526226-63.6952345262255
16247476.161459865851-229.161459865851
1714581.22323879897163.776761201029
1835173629.82422986145-112.824229861454
192738.0045969111662-11.0045969111662
20101246.861853299499-145.861853299499
2125.56801712077598-3.56801712077598
2259.56609365823306-4.56609365823306
23100180.686132705615-80.6861327056153
243431.03982435491542.9601756450846
2514181134.80823482865283.191765171346
26206230.417579658937-24.4175796589375
27130326.063184024418-196.063184024418
28865381.276055524594483.723944475406
29229449.966504646538-220.966504646538
30117.2910662387072-16.2910662387072
31229250.407962346223-21.407962346223
321725.2872193136214-8.2872193136214
339261.63148214332230.3685178566779

\begin{tabular}{lllllllll}
\hline
Multiple Linear Regression - Actuals, Interpolation, and Residuals \tabularnewline
Time or Index & Actuals & InterpolationForecast & ResidualsPrediction Error \tabularnewline
1 & 408 & 480.882684388482 & -72.8826843884822 \tabularnewline
2 & 5 & -16.4851266038361 & 21.4851266038361 \tabularnewline
3 & 2 & -17.8780811150865 & 19.8780811150865 \tabularnewline
4 & 250 & 339.232529112696 & -89.2325291126963 \tabularnewline
5 & 16 & 8.98668063030305 & 7.01331936969695 \tabularnewline
6 & 159 & 131.58744023932 & 27.4125597606801 \tabularnewline
7 & 336 & 173.322734117728 & 162.677265882272 \tabularnewline
8 & 138 & 109.932922546344 & 28.0670774536558 \tabularnewline
9 & 97 & 270.270899496312 & -173.270899496312 \tabularnewline
10 & 1272 & 853.8048137698 & 418.1951862302 \tabularnewline
11 & 88 & 35.6706553793993 & 52.3293446206007 \tabularnewline
12 & 201 & 271.483067011269 & -70.4830670112688 \tabularnewline
13 & 102 & 86.7950568439716 & 15.2049431560284 \tabularnewline
14 & 127 & 198.613754355574 & -71.613754355574 \tabularnewline
15 & 209 & 272.695234526226 & -63.6952345262255 \tabularnewline
16 & 247 & 476.161459865851 & -229.161459865851 \tabularnewline
17 & 145 & 81.223238798971 & 63.776761201029 \tabularnewline
18 & 3517 & 3629.82422986145 & -112.824229861454 \tabularnewline
19 & 27 & 38.0045969111662 & -11.0045969111662 \tabularnewline
20 & 101 & 246.861853299499 & -145.861853299499 \tabularnewline
21 & 2 & 5.56801712077598 & -3.56801712077598 \tabularnewline
22 & 5 & 9.56609365823306 & -4.56609365823306 \tabularnewline
23 & 100 & 180.686132705615 & -80.6861327056153 \tabularnewline
24 & 34 & 31.0398243549154 & 2.9601756450846 \tabularnewline
25 & 1418 & 1134.80823482865 & 283.191765171346 \tabularnewline
26 & 206 & 230.417579658937 & -24.4175796589375 \tabularnewline
27 & 130 & 326.063184024418 & -196.063184024418 \tabularnewline
28 & 865 & 381.276055524594 & 483.723944475406 \tabularnewline
29 & 229 & 449.966504646538 & -220.966504646538 \tabularnewline
30 & 1 & 17.2910662387072 & -16.2910662387072 \tabularnewline
31 & 229 & 250.407962346223 & -21.407962346223 \tabularnewline
32 & 17 & 25.2872193136214 & -8.2872193136214 \tabularnewline
33 & 92 & 61.631482143322 & 30.3685178566779 \tabularnewline
\hline
\end{tabular}
%Source: https://freestatistics.org/blog/index.php?pk=146532&T=4

[TABLE]
[ROW][C]Multiple Linear Regression - Actuals, Interpolation, and Residuals[/C][/ROW]
[ROW][C]Time or Index[/C][C]Actuals[/C][C]InterpolationForecast[/C][C]ResidualsPrediction Error[/C][/ROW]
[ROW][C]1[/C][C]408[/C][C]480.882684388482[/C][C]-72.8826843884822[/C][/ROW]
[ROW][C]2[/C][C]5[/C][C]-16.4851266038361[/C][C]21.4851266038361[/C][/ROW]
[ROW][C]3[/C][C]2[/C][C]-17.8780811150865[/C][C]19.8780811150865[/C][/ROW]
[ROW][C]4[/C][C]250[/C][C]339.232529112696[/C][C]-89.2325291126963[/C][/ROW]
[ROW][C]5[/C][C]16[/C][C]8.98668063030305[/C][C]7.01331936969695[/C][/ROW]
[ROW][C]6[/C][C]159[/C][C]131.58744023932[/C][C]27.4125597606801[/C][/ROW]
[ROW][C]7[/C][C]336[/C][C]173.322734117728[/C][C]162.677265882272[/C][/ROW]
[ROW][C]8[/C][C]138[/C][C]109.932922546344[/C][C]28.0670774536558[/C][/ROW]
[ROW][C]9[/C][C]97[/C][C]270.270899496312[/C][C]-173.270899496312[/C][/ROW]
[ROW][C]10[/C][C]1272[/C][C]853.8048137698[/C][C]418.1951862302[/C][/ROW]
[ROW][C]11[/C][C]88[/C][C]35.6706553793993[/C][C]52.3293446206007[/C][/ROW]
[ROW][C]12[/C][C]201[/C][C]271.483067011269[/C][C]-70.4830670112688[/C][/ROW]
[ROW][C]13[/C][C]102[/C][C]86.7950568439716[/C][C]15.2049431560284[/C][/ROW]
[ROW][C]14[/C][C]127[/C][C]198.613754355574[/C][C]-71.613754355574[/C][/ROW]
[ROW][C]15[/C][C]209[/C][C]272.695234526226[/C][C]-63.6952345262255[/C][/ROW]
[ROW][C]16[/C][C]247[/C][C]476.161459865851[/C][C]-229.161459865851[/C][/ROW]
[ROW][C]17[/C][C]145[/C][C]81.223238798971[/C][C]63.776761201029[/C][/ROW]
[ROW][C]18[/C][C]3517[/C][C]3629.82422986145[/C][C]-112.824229861454[/C][/ROW]
[ROW][C]19[/C][C]27[/C][C]38.0045969111662[/C][C]-11.0045969111662[/C][/ROW]
[ROW][C]20[/C][C]101[/C][C]246.861853299499[/C][C]-145.861853299499[/C][/ROW]
[ROW][C]21[/C][C]2[/C][C]5.56801712077598[/C][C]-3.56801712077598[/C][/ROW]
[ROW][C]22[/C][C]5[/C][C]9.56609365823306[/C][C]-4.56609365823306[/C][/ROW]
[ROW][C]23[/C][C]100[/C][C]180.686132705615[/C][C]-80.6861327056153[/C][/ROW]
[ROW][C]24[/C][C]34[/C][C]31.0398243549154[/C][C]2.9601756450846[/C][/ROW]
[ROW][C]25[/C][C]1418[/C][C]1134.80823482865[/C][C]283.191765171346[/C][/ROW]
[ROW][C]26[/C][C]206[/C][C]230.417579658937[/C][C]-24.4175796589375[/C][/ROW]
[ROW][C]27[/C][C]130[/C][C]326.063184024418[/C][C]-196.063184024418[/C][/ROW]
[ROW][C]28[/C][C]865[/C][C]381.276055524594[/C][C]483.723944475406[/C][/ROW]
[ROW][C]29[/C][C]229[/C][C]449.966504646538[/C][C]-220.966504646538[/C][/ROW]
[ROW][C]30[/C][C]1[/C][C]17.2910662387072[/C][C]-16.2910662387072[/C][/ROW]
[ROW][C]31[/C][C]229[/C][C]250.407962346223[/C][C]-21.407962346223[/C][/ROW]
[ROW][C]32[/C][C]17[/C][C]25.2872193136214[/C][C]-8.2872193136214[/C][/ROW]
[ROW][C]33[/C][C]92[/C][C]61.631482143322[/C][C]30.3685178566779[/C][/ROW]
[/TABLE]
Source: https://freestatistics.org/blog/index.php?pk=146532&T=4

Globally Unique Identifier (entire table): ba.freestatistics.org/blog/index.php?pk=146532&T=4

As an alternative you can also use a QR Code:  

The GUIDs for individual cells are displayed in the table below:

Multiple Linear Regression - Actuals, Interpolation, and Residuals
Time or IndexActualsInterpolationForecastResidualsPrediction Error
1408480.882684388482-72.8826843884822
25-16.485126603836121.4851266038361
32-17.878081115086519.8780811150865
4250339.232529112696-89.2325291126963
5168.986680630303057.01331936969695
6159131.5874402393227.4125597606801
7336173.322734117728162.677265882272
8138109.93292254634428.0670774536558
997270.270899496312-173.270899496312
101272853.8048137698418.1951862302
118835.670655379399352.3293446206007
12201271.483067011269-70.4830670112688
1310286.795056843971615.2049431560284
14127198.613754355574-71.613754355574
15209272.695234526226-63.6952345262255
16247476.161459865851-229.161459865851
1714581.22323879897163.776761201029
1835173629.82422986145-112.824229861454
192738.0045969111662-11.0045969111662
20101246.861853299499-145.861853299499
2125.56801712077598-3.56801712077598
2259.56609365823306-4.56609365823306
23100180.686132705615-80.6861327056153
243431.03982435491542.9601756450846
2514181134.80823482865283.191765171346
26206230.417579658937-24.4175796589375
27130326.063184024418-196.063184024418
28865381.276055524594483.723944475406
29229449.966504646538-220.966504646538
30117.2910662387072-16.2910662387072
31229250.407962346223-21.407962346223
321725.2872193136214-8.2872193136214
339261.63148214332230.3685178566779


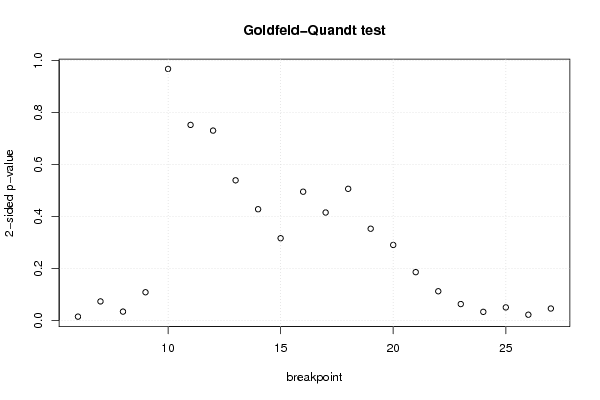
Goldfeld-Quandt test for Heteroskedasticity
p-valuesAlternative Hypothesis
breakpoint indexgreater2-sidedless
60.007054434528494220.01410886905698840.992945565471506
70.03636303669016240.07272607338032490.963636963309838
80.01675476637130470.03350953274260940.983245233628695
90.05398137880193480.107962757603870.946018621198065
100.4833870172533740.9667740345067480.516612982746626
110.3757707410323610.7515414820647220.624229258967639
120.3648541219379480.7297082438758960.635145878062052
130.2692576306757260.5385152613514520.730742369324274
140.2136328320495020.4272656640990040.786367167950498
150.1578777835996190.3157555671992380.84212221640038
160.2473106703961230.4946213407922460.752689329603877
170.2073186189618330.4146372379236660.792681381038167
180.252874188343070.505748376686140.74712581165693
190.1761314552456440.3522629104912870.823868544754356
200.1449203434260030.2898406868520060.855079656573997
210.09265637785864110.1853127557172820.907343622141359
220.05590007416505260.1118001483301050.944099925834947
230.03129222782213080.06258445564426160.96870777217787
240.0162617393816460.03252347876329190.983738260618354
250.02481986759138670.04963973518277340.975180132408613
260.01075487318413710.02150974636827430.989245126815863
270.02265031237086560.04530062474173120.977349687629134

\begin{tabular}{lllllllll}
\hline
Goldfeld-Quandt test for Heteroskedasticity \tabularnewline
p-values & Alternative Hypothesis \tabularnewline
breakpoint index & greater & 2-sided & less \tabularnewline
6 & 0.00705443452849422 & 0.0141088690569884 & 0.992945565471506 \tabularnewline
7 & 0.0363630366901624 & 0.0727260733803249 & 0.963636963309838 \tabularnewline
8 & 0.0167547663713047 & 0.0335095327426094 & 0.983245233628695 \tabularnewline
9 & 0.0539813788019348 & 0.10796275760387 & 0.946018621198065 \tabularnewline
10 & 0.483387017253374 & 0.966774034506748 & 0.516612982746626 \tabularnewline
11 & 0.375770741032361 & 0.751541482064722 & 0.624229258967639 \tabularnewline
12 & 0.364854121937948 & 0.729708243875896 & 0.635145878062052 \tabularnewline
13 & 0.269257630675726 & 0.538515261351452 & 0.730742369324274 \tabularnewline
14 & 0.213632832049502 & 0.427265664099004 & 0.786367167950498 \tabularnewline
15 & 0.157877783599619 & 0.315755567199238 & 0.84212221640038 \tabularnewline
16 & 0.247310670396123 & 0.494621340792246 & 0.752689329603877 \tabularnewline
17 & 0.207318618961833 & 0.414637237923666 & 0.792681381038167 \tabularnewline
18 & 0.25287418834307 & 0.50574837668614 & 0.74712581165693 \tabularnewline
19 & 0.176131455245644 & 0.352262910491287 & 0.823868544754356 \tabularnewline
20 & 0.144920343426003 & 0.289840686852006 & 0.855079656573997 \tabularnewline
21 & 0.0926563778586411 & 0.185312755717282 & 0.907343622141359 \tabularnewline
22 & 0.0559000741650526 & 0.111800148330105 & 0.944099925834947 \tabularnewline
23 & 0.0312922278221308 & 0.0625844556442616 & 0.96870777217787 \tabularnewline
24 & 0.016261739381646 & 0.0325234787632919 & 0.983738260618354 \tabularnewline
25 & 0.0248198675913867 & 0.0496397351827734 & 0.975180132408613 \tabularnewline
26 & 0.0107548731841371 & 0.0215097463682743 & 0.989245126815863 \tabularnewline
27 & 0.0226503123708656 & 0.0453006247417312 & 0.977349687629134 \tabularnewline
\hline
\end{tabular}
%Source: https://freestatistics.org/blog/index.php?pk=146532&T=5

[TABLE]
[ROW][C]Goldfeld-Quandt test for Heteroskedasticity[/C][/ROW]
[ROW][C]p-values[/C][C]Alternative Hypothesis[/C][/ROW]
[ROW][C]breakpoint index[/C][C]greater[/C][C]2-sided[/C][C]less[/C][/ROW]
[ROW][C]6[/C][C]0.00705443452849422[/C][C]0.0141088690569884[/C][C]0.992945565471506[/C][/ROW]
[ROW][C]7[/C][C]0.0363630366901624[/C][C]0.0727260733803249[/C][C]0.963636963309838[/C][/ROW]
[ROW][C]8[/C][C]0.0167547663713047[/C][C]0.0335095327426094[/C][C]0.983245233628695[/C][/ROW]
[ROW][C]9[/C][C]0.0539813788019348[/C][C]0.10796275760387[/C][C]0.946018621198065[/C][/ROW]
[ROW][C]10[/C][C]0.483387017253374[/C][C]0.966774034506748[/C][C]0.516612982746626[/C][/ROW]
[ROW][C]11[/C][C]0.375770741032361[/C][C]0.751541482064722[/C][C]0.624229258967639[/C][/ROW]
[ROW][C]12[/C][C]0.364854121937948[/C][C]0.729708243875896[/C][C]0.635145878062052[/C][/ROW]
[ROW][C]13[/C][C]0.269257630675726[/C][C]0.538515261351452[/C][C]0.730742369324274[/C][/ROW]
[ROW][C]14[/C][C]0.213632832049502[/C][C]0.427265664099004[/C][C]0.786367167950498[/C][/ROW]
[ROW][C]15[/C][C]0.157877783599619[/C][C]0.315755567199238[/C][C]0.84212221640038[/C][/ROW]
[ROW][C]16[/C][C]0.247310670396123[/C][C]0.494621340792246[/C][C]0.752689329603877[/C][/ROW]
[ROW][C]17[/C][C]0.207318618961833[/C][C]0.414637237923666[/C][C]0.792681381038167[/C][/ROW]
[ROW][C]18[/C][C]0.25287418834307[/C][C]0.50574837668614[/C][C]0.74712581165693[/C][/ROW]
[ROW][C]19[/C][C]0.176131455245644[/C][C]0.352262910491287[/C][C]0.823868544754356[/C][/ROW]
[ROW][C]20[/C][C]0.144920343426003[/C][C]0.289840686852006[/C][C]0.855079656573997[/C][/ROW]
[ROW][C]21[/C][C]0.0926563778586411[/C][C]0.185312755717282[/C][C]0.907343622141359[/C][/ROW]
[ROW][C]22[/C][C]0.0559000741650526[/C][C]0.111800148330105[/C][C]0.944099925834947[/C][/ROW]
[ROW][C]23[/C][C]0.0312922278221308[/C][C]0.0625844556442616[/C][C]0.96870777217787[/C][/ROW]
[ROW][C]24[/C][C]0.016261739381646[/C][C]0.0325234787632919[/C][C]0.983738260618354[/C][/ROW]
[ROW][C]25[/C][C]0.0248198675913867[/C][C]0.0496397351827734[/C][C]0.975180132408613[/C][/ROW]
[ROW][C]26[/C][C]0.0107548731841371[/C][C]0.0215097463682743[/C][C]0.989245126815863[/C][/ROW]
[ROW][C]27[/C][C]0.0226503123708656[/C][C]0.0453006247417312[/C][C]0.977349687629134[/C][/ROW]
[/TABLE]
Source: https://freestatistics.org/blog/index.php?pk=146532&T=5

Globally Unique Identifier (entire table): ba.freestatistics.org/blog/index.php?pk=146532&T=5

As an alternative you can also use a QR Code:  

The GUIDs for individual cells are displayed in the table below:

Goldfeld-Quandt test for Heteroskedasticity
p-valuesAlternative Hypothesis
breakpoint indexgreater2-sidedless
60.007054434528494220.01410886905698840.992945565471506
70.03636303669016240.07272607338032490.963636963309838
80.01675476637130470.03350953274260940.983245233628695
90.05398137880193480.107962757603870.946018621198065
100.4833870172533740.9667740345067480.516612982746626
110.3757707410323610.7515414820647220.624229258967639
120.3648541219379480.7297082438758960.635145878062052
130.2692576306757260.5385152613514520.730742369324274
140.2136328320495020.4272656640990040.786367167950498
150.1578777835996190.3157555671992380.84212221640038
160.2473106703961230.4946213407922460.752689329603877
170.2073186189618330.4146372379236660.792681381038167
180.252874188343070.505748376686140.74712581165693
190.1761314552456440.3522629104912870.823868544754356
200.1449203434260030.2898406868520060.855079656573997
210.09265637785864110.1853127557172820.907343622141359
220.05590007416505260.1118001483301050.944099925834947
230.03129222782213080.06258445564426160.96870777217787
240.0162617393816460.03252347876329190.983738260618354
250.02481986759138670.04963973518277340.975180132408613
260.01075487318413710.02150974636827430.989245126815863
270.02265031237086560.04530062474173120.977349687629134


Meta Analysis of Goldfeld-Quandt test for Heteroskedasticity
Description# significant tests% significant testsOK/NOK
1% type I error level00OK
5% type I error level60.272727272727273NOK
10% type I error level80.363636363636364NOK

\begin{tabular}{lllllllll}
\hline
Meta Analysis of Goldfeld-Quandt test for Heteroskedasticity \tabularnewline
Description & # significant tests & % significant tests & OK/NOK \tabularnewline
1% type I error level & 0 & 0 & OK \tabularnewline
5% type I error level & 6 & 0.272727272727273 & NOK \tabularnewline
10% type I error level & 8 & 0.363636363636364 & NOK \tabularnewline
\hline
\end{tabular}
%Source: https://freestatistics.org/blog/index.php?pk=146532&T=6

[TABLE]
[ROW][C]Meta Analysis of Goldfeld-Quandt test for Heteroskedasticity[/C][/ROW]
[ROW][C]Description[/C][C]# significant tests[/C][C]% significant tests[/C][C]OK/NOK[/C][/ROW]
[ROW][C]1% type I error level[/C][C]0[/C][C]0[/C][C]OK[/C][/ROW]
[ROW][C]5% type I error level[/C][C]6[/C][C]0.272727272727273[/C][C]NOK[/C][/ROW]
[ROW][C]10% type I error level[/C][C]8[/C][C]0.363636363636364[/C][C]NOK[/C][/ROW]
[/TABLE]
Source: https://freestatistics.org/blog/index.php?pk=146532&T=6

Globally Unique Identifier (entire table): ba.freestatistics.org/blog/index.php?pk=146532&T=6

As an alternative you can also use a QR Code:  

The GUIDs for individual cells are displayed in the table below:

Meta Analysis of Goldfeld-Quandt test for Heteroskedasticity
Description# significant tests% significant testsOK/NOK
1% type I error level00OK
5% type I error level60.272727272727273NOK
10% type I error level80.363636363636364NOK


Parameters (Session):
par1 = 1 ; par2 = Do not include Seasonal Dummies ; par3 = Linear Trend ;
Parameters (R input):
par1 = 1 ; par2 = Do not include Seasonal Dummies ; par3 = Linear Trend ;
R code (references can be found in the software module):
library(lattice)
library(lmtest)
n25 <- 25 #minimum number of obs. for Goldfeld-Quandt test
par1 <- as.numeric(par1)
x <- t(y)
k <- length(x[1,])
n <- length(x[,1])
x1 <- cbind(x[,par1], x[,1:k!=par1])
mycolnames <- c(colnames(x)[par1], colnames(x)[1:k!=par1])
colnames(x1) <- mycolnames #colnames(x)[par1]
x <- x1
if (par3 == 'First Differences'){
x2 <- array(0, dim=c(n-1,k), dimnames=list(1:(n-1), paste('(1-B)',colnames(x),sep='')))
for (i in 1:n-1) {
for (j in 1:k) {
x2[i,j] <- x[i+1,j] - x[i,j]
}
}
x <- x2
}
if (par2 == 'Include Monthly Dummies'){
x2 <- array(0, dim=c(n,11), dimnames=list(1:n, paste('M', seq(1:11), sep ='')))
for (i in 1:11){
x2[seq(i,n,12),i] <- 1
}
x <- cbind(x, x2)
}
if (par2 == 'Include Quarterly Dummies'){
x2 <- array(0, dim=c(n,3), dimnames=list(1:n, paste('Q', seq(1:3), sep ='')))
for (i in 1:3){
x2[seq(i,n,4),i] <- 1
}
x <- cbind(x, x2)
}
k <- length(x[1,])
if (par3 == 'Linear Trend'){
x <- cbind(x, c(1:n))
colnames(x)[k+1] <- 't'
}
x
k <- length(x[1,])
df <- as.data.frame(x)
(mylm <- lm(df))
(mysum <- summary(mylm))
if (n > n25) {
kp3 <- k + 3
nmkm3 <- n - k - 3
gqarr <- array(NA, dim=c(nmkm3-kp3+1,3))
numgqtests <- 0
numsignificant1 <- 0
numsignificant5 <- 0
numsignificant10 <- 0
for (mypoint in kp3:nmkm3) {
j <- 0
numgqtests <- numgqtests + 1
for (myalt in c('greater', 'two.sided', 'less')) {
j <- j + 1
gqarr[mypoint-kp3+1,j] <- gqtest(mylm, point=mypoint, alternative=myalt)$p.value
}
if (gqarr[mypoint-kp3+1,2] < 0.01) numsignificant1 <- numsignificant1 + 1
if (gqarr[mypoint-kp3+1,2] < 0.05) numsignificant5 <- numsignificant5 + 1
if (gqarr[mypoint-kp3+1,2] < 0.10) numsignificant10 <- numsignificant10 + 1
}
gqarr
}
bitmap(file='test0.png')
plot(x[,1], type='l', main='Actuals and Interpolation', ylab='value of Actuals and Interpolation (dots)', xlab='time or index')
points(x[,1]-mysum$resid)
grid()
dev.off()
bitmap(file='test1.png')
plot(mysum$resid, type='b', pch=19, main='Residuals', ylab='value of Residuals', xlab='time or index')
grid()
dev.off()
bitmap(file='test2.png')
hist(mysum$resid, main='Residual Histogram', xlab='values of Residuals')
grid()
dev.off()
bitmap(file='test3.png')
densityplot(~mysum$resid,col='black',main='Residual Density Plot', xlab='values of Residuals')
dev.off()
bitmap(file='test4.png')
qqnorm(mysum$resid, main='Residual Normal Q-Q Plot')
qqline(mysum$resid)
grid()
dev.off()
(myerror <- as.ts(mysum$resid))
bitmap(file='test5.png')
dum <- cbind(lag(myerror,k=1),myerror)
dum
dum1 <- dum[2:length(myerror),]
dum1
z <- as.data.frame(dum1)
z
plot(z,main=paste('Residual Lag plot, lowess, and regression line'), ylab='values of Residuals', xlab='lagged values of Residuals')
lines(lowess(z))
abline(lm(z))
grid()
dev.off()
bitmap(file='test6.png')
acf(mysum$resid, lag.max=length(mysum$resid)/2, main='Residual Autocorrelation Function')
grid()
dev.off()
bitmap(file='test7.png')
pacf(mysum$resid, lag.max=length(mysum$resid)/2, main='Residual Partial Autocorrelation Function')
grid()
dev.off()
bitmap(file='test8.png')
opar <- par(mfrow = c(2,2), oma = c(0, 0, 1.1, 0))
plot(mylm, las = 1, sub='Residual Diagnostics')
par(opar)
dev.off()
if (n > n25) {
bitmap(file='test9.png')
plot(kp3:nmkm3,gqarr[,2], main='Goldfeld-Quandt test',ylab='2-sided p-value',xlab='breakpoint')
grid()
dev.off()
}
load(file='createtable')
a<-table.start()
a<-table.row.start(a)
a<-table.element(a, 'Multiple Linear Regression - Estimated Regression Equation', 1, TRUE)
a<-table.row.end(a)
myeq <- colnames(x)[1]
myeq <- paste(myeq, '[t] = ', sep='')
for (i in 1:k){
if (mysum$coefficients[i,1] > 0) myeq <- paste(myeq, '+', '')
myeq <- paste(myeq, mysum$coefficients[i,1], sep=' ')
if (rownames(mysum$coefficients)[i] != '(Intercept)') {
myeq <- paste(myeq, rownames(mysum$coefficients)[i], sep='')
if (rownames(mysum$coefficients)[i] != 't') myeq <- paste(myeq, '[t]', sep='')
}
}
myeq <- paste(myeq, ' + e[t]')
a<-table.row.start(a)
a<-table.element(a, myeq)
a<-table.row.end(a)
a<-table.end(a)
table.save(a,file='mytable1.tab')
a<-table.start()
a<-table.row.start(a)
a<-table.element(a,hyperlink('ols1.htm','Multiple Linear Regression - Ordinary Least Squares',''), 6, TRUE)
a<-table.row.end(a)
a<-table.row.start(a)
a<-table.element(a,'Variable',header=TRUE)
a<-table.element(a,'Parameter',header=TRUE)
a<-table.element(a,'S.D.',header=TRUE)
a<-table.element(a,'T-STAT
H0: parameter = 0',header=TRUE)
a<-table.element(a,'2-tail p-value',header=TRUE)
a<-table.element(a,'1-tail p-value',header=TRUE)
a<-table.row.end(a)
for (i in 1:k){
a<-table.row.start(a)
a<-table.element(a,rownames(mysum$coefficients)[i],header=TRUE)
a<-table.element(a,mysum$coefficients[i,1])
a<-table.element(a, round(mysum$coefficients[i,2],6))
a<-table.element(a, round(mysum$coefficients[i,3],4))
a<-table.element(a, round(mysum$coefficients[i,4],6))
a<-table.element(a, round(mysum$coefficients[i,4]/2,6))
a<-table.row.end(a)
}
a<-table.end(a)
table.save(a,file='mytable2.tab')
a<-table.start()
a<-table.row.start(a)
a<-table.element(a, 'Multiple Linear Regression - Regression Statistics', 2, TRUE)
a<-table.row.end(a)
a<-table.row.start(a)
a<-table.element(a, 'Multiple R',1,TRUE)
a<-table.element(a, sqrt(mysum$r.squared))
a<-table.row.end(a)
a<-table.row.start(a)
a<-table.element(a, 'R-squared',1,TRUE)
a<-table.element(a, mysum$r.squared)
a<-table.row.end(a)
a<-table.row.start(a)
a<-table.element(a, 'Adjusted R-squared',1,TRUE)
a<-table.element(a, mysum$adj.r.squared)
a<-table.row.end(a)
a<-table.row.start(a)
a<-table.element(a, 'F-TEST (value)',1,TRUE)
a<-table.element(a, mysum$fstatistic[1])
a<-table.row.end(a)
a<-table.row.start(a)
a<-table.element(a, 'F-TEST (DF numerator)',1,TRUE)
a<-table.element(a, mysum$fstatistic[2])
a<-table.row.end(a)
a<-table.row.start(a)
a<-table.element(a, 'F-TEST (DF denominator)',1,TRUE)
a<-table.element(a, mysum$fstatistic[3])
a<-table.row.end(a)
a<-table.row.start(a)
a<-table.element(a, 'p-value',1,TRUE)
a<-table.element(a, 1-pf(mysum$fstatistic[1],mysum$fstatistic[2],mysum$fstatistic[3]))
a<-table.row.end(a)
a<-table.row.start(a)
a<-table.element(a, 'Multiple Linear Regression - Residual Statistics', 2, TRUE)
a<-table.row.end(a)
a<-table.row.start(a)
a<-table.element(a, 'Residual Standard Deviation',1,TRUE)
a<-table.element(a, mysum$sigma)
a<-table.row.end(a)
a<-table.row.start(a)
a<-table.element(a, 'Sum Squared Residuals',1,TRUE)
a<-table.element(a, sum(myerror*myerror))
a<-table.row.end(a)
a<-table.end(a)
table.save(a,file='mytable3.tab')
a<-table.start()
a<-table.row.start(a)
a<-table.element(a, 'Multiple Linear Regression - Actuals, Interpolation, and Residuals', 4, TRUE)
a<-table.row.end(a)
a<-table.row.start(a)
a<-table.element(a, 'Time or Index', 1, TRUE)
a<-table.element(a, 'Actuals', 1, TRUE)
a<-table.element(a, 'Interpolation
Forecast', 1, TRUE)
a<-table.element(a, 'Residuals
Prediction Error', 1, TRUE)
a<-table.row.end(a)
for (i in 1:n) {
a<-table.row.start(a)
a<-table.element(a,i, 1, TRUE)
a<-table.element(a,x[i])
a<-table.element(a,x[i]-mysum$resid[i])
a<-table.element(a,mysum$resid[i])
a<-table.row.end(a)
}
a<-table.end(a)
table.save(a,file='mytable4.tab')
if (n > n25) {
a<-table.start()
a<-table.row.start(a)
a<-table.element(a,'Goldfeld-Quandt test for Heteroskedasticity',4,TRUE)
a<-table.row.end(a)
a<-table.row.start(a)
a<-table.element(a,'p-values',header=TRUE)
a<-table.element(a,'Alternative Hypothesis',3,header=TRUE)
a<-table.row.end(a)
a<-table.row.start(a)
a<-table.element(a,'breakpoint index',header=TRUE)
a<-table.element(a,'greater',header=TRUE)
a<-table.element(a,'2-sided',header=TRUE)
a<-table.element(a,'less',header=TRUE)
a<-table.row.end(a)
for (mypoint in kp3:nmkm3) {
a<-table.row.start(a)
a<-table.element(a,mypoint,header=TRUE)
a<-table.element(a,gqarr[mypoint-kp3+1,1])
a<-table.element(a,gqarr[mypoint-kp3+1,2])
a<-table.element(a,gqarr[mypoint-kp3+1,3])
a<-table.row.end(a)
}
a<-table.end(a)
table.save(a,file='mytable5.tab')
a<-table.start()
a<-table.row.start(a)
a<-table.element(a,'Meta Analysis of Goldfeld-Quandt test for Heteroskedasticity',4,TRUE)
a<-table.row.end(a)
a<-table.row.start(a)
a<-table.element(a,'Description',header=TRUE)
a<-table.element(a,'# significant tests',header=TRUE)
a<-table.element(a,'% significant tests',header=TRUE)
a<-table.element(a,'OK/NOK',header=TRUE)
a<-table.row.end(a)
a<-table.row.start(a)
a<-table.element(a,'1% type I error level',header=TRUE)
a<-table.element(a,numsignificant1)
a<-table.element(a,numsignificant1/numgqtests)
if (numsignificant1/numgqtests < 0.01) dum <- 'OK' else dum <- 'NOK'
a<-table.element(a,dum)
a<-table.row.end(a)
a<-table.row.start(a)
a<-table.element(a,'5% type I error level',header=TRUE)
a<-table.element(a,numsignificant5)
a<-table.element(a,numsignificant5/numgqtests)
if (numsignificant5/numgqtests < 0.05) dum <- 'OK' else dum <- 'NOK'
a<-table.element(a,dum)
a<-table.row.end(a)
a<-table.row.start(a)
a<-table.element(a,'10% type I error level',header=TRUE)
a<-table.element(a,numsignificant10)
a<-table.element(a,numsignificant10/numgqtests)
if (numsignificant10/numgqtests < 0.1) dum <- 'OK' else dum <- 'NOK'
a<-table.element(a,dum)
a<-table.row.end(a)
a<-table.end(a)
table.save(a,file='mytable6.tab')
}