| Multiple Linear Regression - Estimated Regression Equation |
| Personeel[t] = + 14.8547205038948 + 0.350710216235978omzet[t] -0.433348229182165t + e[t] |
| Multiple Linear Regression - Ordinary Least Squares | |||||
| Variable | Parameter | S.D. | T-STAT H0: parameter = 0 | 2-tail p-value | 1-tail p-value |
| (Intercept) | 14.8547205038948 | 20.98452 | 0.7079 | 0.484478 | 0.242239 |
| omzet | 0.350710216235978 | 0.015396 | 22.7793 | 0 | 0 |
| t | -0.433348229182165 | 1.053882 | -0.4112 | 0.683854 | 0.341927 |
| Multiple Linear Regression - Regression Statistics | |
| Multiple R | 0.972296963468357 |
| R-squared | 0.945361385169787 |
| Adjusted R-squared | 0.941718810847773 |
| F-TEST (value) | 259.5311177198 |
| F-TEST (DF numerator) | 2 |
| F-TEST (DF denominator) | 30 |
| p-value | 0 |
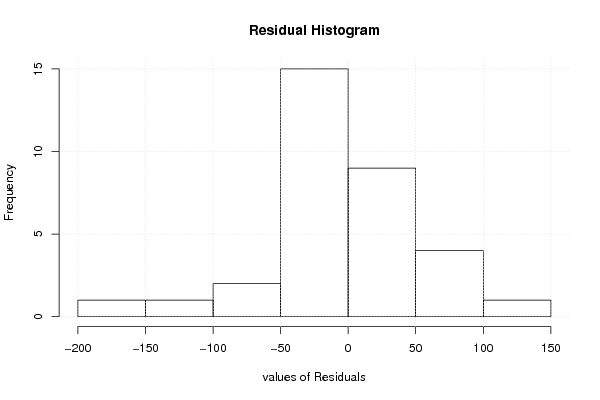
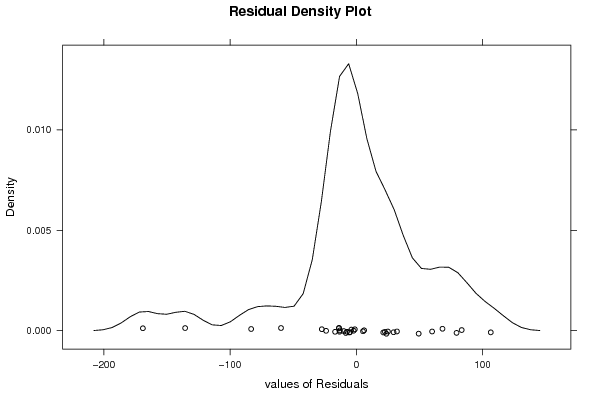
| Multiple Linear Regression - Residual Statistics | |
| Residual Standard Deviation | 57.6092207573889 |
| Sum Squared Residuals | 99564.6694882072 |
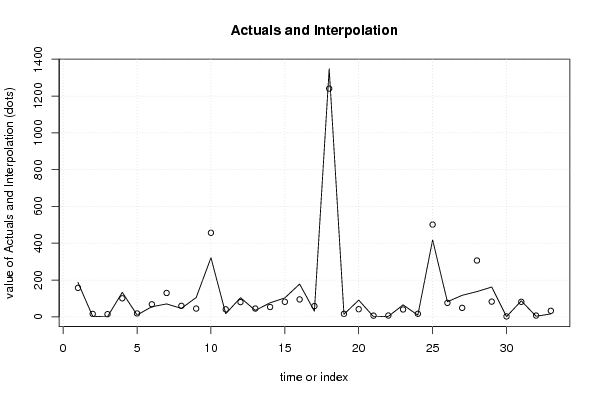
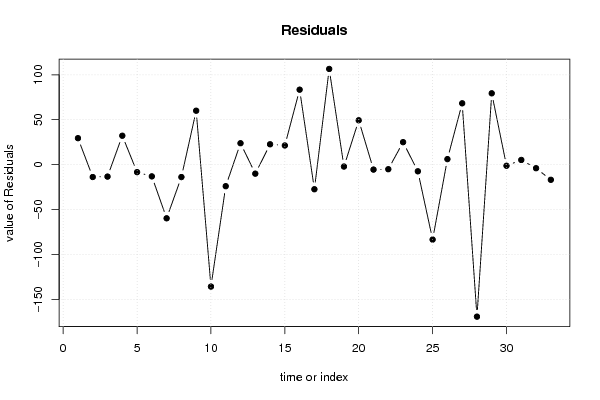
| Multiple Linear Regression - Actuals, Interpolation, and Residuals | |||
| Time or Index | Actuals | Interpolation Forecast | Residuals Prediction Error |
| 1 | 187 | 157.511140498992 | 29.4888595010083 |
| 2 | 2 | 15.7415751267103 | -13.7415751267103 |
| 3 | 1 | 14.2560962488202 | -13.2560962488202 |
| 4 | 133 | 100.798881646161 | 32.2011183538393 |
| 5 | 10 | 18.2993428177596 | -8.29934281775959 |
| 6 | 55 | 68.0175555103224 | -13.0175555103223 |
| 7 | 70 | 129.659915554908 | -59.6599155549084 |
| 8 | 46 | 59.7859445110025 | -13.7859445110025 |
| 9 | 105 | 44.9734774161452 | 60.0265225838548 |
| 10 | 321 | 456.624633264238 | -135.624633264238 |
| 11 | 17 | 40.9503890116571 | -23.9503890116571 |
| 12 | 104 | 80.1472952171404 | 23.8527047828596 |
| 13 | 35 | 44.9936355805964 | -9.99363558059642 |
| 14 | 76 | 53.3280427573137 | 22.6719572426863 |
| 15 | 103 | 81.6529322594818 | 21.3470677405182 |
| 16 | 178 | 94.5465722472668 | 83.4534277527332 |
| 17 | 31 | 58.3407819620148 | -27.3407819620148 |
| 18 | 1347 | 1240.50228288055 | 106.497717119448 |
| 19 | 14 | 16.090279987805 | -2.09027998780504 |
| 20 | 91 | 41.6094877600853 | 49.3905122399147 |
| 21 | 1 | 6.45582812354123 | -5.45582812354123 |
| 22 | 2 | 7.074610543067 | -5.074610543067 |
| 23 | 65 | 39.9587328563028 | 25.0412671436972 |
| 24 | 9 | 16.3785103555461 | -7.37851035554607 |
| 25 | 418 | 501.328101396958 | -83.328101396958 |
| 26 | 82 | 75.83397108977 | 6.16602891022997 |
| 27 | 117 | 48.7466464266535 | 68.2533535733465 |
| 28 | 137 | 306.085307130915 | -169.085307130915 |
| 29 | 162 | 82.600261375651 | 79.399738624349 |
| 30 | 1 | 2.20498384466577 | -1.20498384466577 |
| 31 | 87 | 81.7335649172867 | 5.2664350827133 |
| 32 | 3 | 6.94965084607709 | -3.94965084607709 |
| 33 | 16 | 32.8195688345933 | -16.8195688345933 |
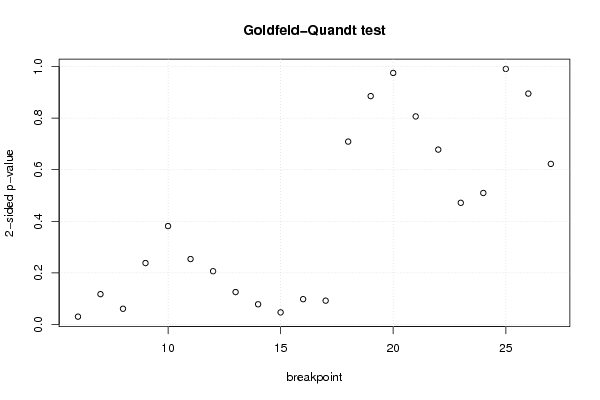
| Goldfeld-Quandt test for Heteroskedasticity | |||
| p-values | Alternative Hypothesis | ||
| breakpoint index | greater | 2-sided | less |
| 6 | 0.0151750153182055 | 0.030350030636411 | 0.984824984681794 |
| 7 | 0.0587977925128263 | 0.117595585025653 | 0.941202207487174 |
| 8 | 0.0304930373470995 | 0.0609860746941991 | 0.9695069626529 |
| 9 | 0.119087404105792 | 0.238174808211585 | 0.880912595894208 |
| 10 | 0.190744888026763 | 0.381489776053525 | 0.809255111973237 |
| 11 | 0.126859368046577 | 0.253718736093153 | 0.873140631953423 |
| 12 | 0.103247161297145 | 0.20649432259429 | 0.896752838702855 |
| 13 | 0.0628089758086371 | 0.125617951617274 | 0.937191024191363 |
| 14 | 0.0391609051280404 | 0.0783218102560809 | 0.96083909487196 |
| 15 | 0.023449884761466 | 0.046899769522932 | 0.976550115238534 |
| 16 | 0.0490751620162292 | 0.0981503240324584 | 0.950924837983771 |
| 17 | 0.0461618256732147 | 0.0923236513464294 | 0.953838174326785 |
| 18 | 0.645541805545615 | 0.708916388908769 | 0.354458194454385 |
| 19 | 0.557378110491318 | 0.885243779017364 | 0.442621889508682 |
| 20 | 0.487502538577234 | 0.975005077154469 | 0.512497461422766 |
| 21 | 0.403221069018733 | 0.806442138037465 | 0.596778930981267 |
| 22 | 0.338914443420016 | 0.677828886840033 | 0.661085556579984 |
| 23 | 0.235851721988966 | 0.471703443977931 | 0.764148278011034 |
| 24 | 0.254841871016055 | 0.509683742032109 | 0.745158128983945 |
| 25 | 0.504755067895708 | 0.990489864208583 | 0.495244932104292 |
| 26 | 0.447459157283004 | 0.894918314566008 | 0.552540842716996 |
| 27 | 0.311189462310926 | 0.622378924621851 | 0.688810537689074 |
| Meta Analysis of Goldfeld-Quandt test for Heteroskedasticity | |||
| Description | # significant tests | % significant tests | OK/NOK |
| 1% type I error level | 0 | 0 | OK |
| 5% type I error level | 2 | 0.0909090909090909 | NOK |
| 10% type I error level | 6 | 0.272727272727273 | NOK |