Free Statistics

of Irreproducible Research!

Author's title

Author*The author of this computation has been verified*
R Software Modulerwasp_multipleregression.wasp
Title produced by softwareMultiple Regression
Date of computationWed, 23 Nov 2011 09:41:22 -0500
Cite this page as followsStatistical Computations at FreeStatistics.org, Office for Research Development and Education, URL https://freestatistics.org/blog/index.php?v=date/2011/Nov/23/t1322059957cw074rydhv4d8zm.htm/, Retrieved Sat, 27 Apr 2024 00:38:36 +0000
Statistical Computations at FreeStatistics.org, Office for Research Development and Education, URL https://freestatistics.org/blog/index.php?pk=146531, Retrieved Sat, 27 Apr 2024 00:38:36 +0000
QR Codes:

Original text written by user:
IsPrivate?No (this computation is public)
User-defined keywords
Estimated Impact80
Family? (F = Feedback message, R = changed R code, M = changed R Module, P = changed Parameters, D = changed Data)
-     [Multiple Regression] [Colombia Coffee -...] [2008-02-26 11:21:57] [74be16979710d4c4e7c6647856088456]
-  MPD  [Multiple Regression] [] [2011-11-23 14:10:39] [489eb911c8db04aca1fc54d886fc3144]
-   PD      [Multiple Regression] [] [2011-11-23 14:41:22] [a478c561bf1feb1bdaba97497ca665e7] [Current]
Feedback Forum

Post a new message
Dataseries X:
408	187
5	2
2	1
250	133
16	10
159	55
336	70
138	46
97	105
1272	321
88	17
201	104
102	35
127	76
209	103
247	178
145	31
3517	1347
27	14
101	91
2	1
5	2
100	65
34	9
1418	418
206	82
130	117
865	137
229	162
1	1
229	87
17	3
92	16


Summary of computational transaction
Raw Inputview raw input (R code)
Raw Outputview raw output of R engine
Computing time3 seconds
R Server'Gertrude Mary Cox' @ cox.wessa.net

\begin{tabular}{lllllllll}
\hline
Summary of computational transaction \tabularnewline
Raw Input & view raw input (R code)  \tabularnewline
Raw Output & view raw output of R engine  \tabularnewline
Computing time & 3 seconds \tabularnewline
R Server & 'Gertrude Mary Cox' @ cox.wessa.net \tabularnewline
\hline
\end{tabular}
%Source: https://freestatistics.org/blog/index.php?pk=146531&T=0

[TABLE]
[ROW][C]Summary of computational transaction[/C][/ROW]
[ROW][C]Raw Input[/C][C]view raw input (R code) [/C][/ROW]
[ROW][C]Raw Output[/C][C]view raw output of R engine [/C][/ROW]
[ROW][C]Computing time[/C][C]3 seconds[/C][/ROW]
[ROW][C]R Server[/C][C]'Gertrude Mary Cox' @ cox.wessa.net[/C][/ROW]
[/TABLE]
Source: https://freestatistics.org/blog/index.php?pk=146531&T=0

Globally Unique Identifier (entire table): ba.freestatistics.org/blog/index.php?pk=146531&T=0

As an alternative you can also use a QR Code:  

The GUIDs for individual cells are displayed in the table below:

Summary of computational transaction
Raw Inputview raw input (R code)
Raw Outputview raw output of R engine
Computing time3 seconds
R Server'Gertrude Mary Cox' @ cox.wessa.net


Multiple Linear Regression - Estimated Regression Equation
Personeel[t] = + 14.8547205038948 + 0.350710216235978omzet[t] -0.433348229182165t + e[t]

\begin{tabular}{lllllllll}
\hline
Multiple Linear Regression - Estimated Regression Equation \tabularnewline
Personeel[t] =  +  14.8547205038948 +  0.350710216235978omzet[t] -0.433348229182165t  + e[t] \tabularnewline
\hline
\end{tabular}
%Source: https://freestatistics.org/blog/index.php?pk=146531&T=1

[TABLE]
[ROW][C]Multiple Linear Regression - Estimated Regression Equation[/C][/ROW]
[ROW][C]Personeel[t] =  +  14.8547205038948 +  0.350710216235978omzet[t] -0.433348229182165t  + e[t][/C][/ROW]
[/TABLE]
Source: https://freestatistics.org/blog/index.php?pk=146531&T=1

Globally Unique Identifier (entire table): ba.freestatistics.org/blog/index.php?pk=146531&T=1

As an alternative you can also use a QR Code:  

The GUIDs for individual cells are displayed in the table below:

Multiple Linear Regression - Estimated Regression Equation
Personeel[t] = + 14.8547205038948 + 0.350710216235978omzet[t] -0.433348229182165t + e[t]


Multiple Linear Regression - Ordinary Least Squares
VariableParameterS.D.T-STATH0: parameter = 02-tail p-value1-tail p-value
(Intercept)14.854720503894820.984520.70790.4844780.242239
omzet0.3507102162359780.01539622.779300
t-0.4333482291821651.053882-0.41120.6838540.341927

\begin{tabular}{lllllllll}
\hline
Multiple Linear Regression - Ordinary Least Squares \tabularnewline
Variable & Parameter & S.D. & T-STATH0: parameter = 0 & 2-tail p-value & 1-tail p-value \tabularnewline
(Intercept) & 14.8547205038948 & 20.98452 & 0.7079 & 0.484478 & 0.242239 \tabularnewline
omzet & 0.350710216235978 & 0.015396 & 22.7793 & 0 & 0 \tabularnewline
t & -0.433348229182165 & 1.053882 & -0.4112 & 0.683854 & 0.341927 \tabularnewline
\hline
\end{tabular}
%Source: https://freestatistics.org/blog/index.php?pk=146531&T=2

[TABLE]
[ROW][C]Multiple Linear Regression - Ordinary Least Squares[/C][/ROW]
[ROW][C]Variable[/C][C]Parameter[/C][C]S.D.[/C][C]T-STATH0: parameter = 0[/C][C]2-tail p-value[/C][C]1-tail p-value[/C][/ROW]
[ROW][C](Intercept)[/C][C]14.8547205038948[/C][C]20.98452[/C][C]0.7079[/C][C]0.484478[/C][C]0.242239[/C][/ROW]
[ROW][C]omzet[/C][C]0.350710216235978[/C][C]0.015396[/C][C]22.7793[/C][C]0[/C][C]0[/C][/ROW]
[ROW][C]t[/C][C]-0.433348229182165[/C][C]1.053882[/C][C]-0.4112[/C][C]0.683854[/C][C]0.341927[/C][/ROW]
[/TABLE]
Source: https://freestatistics.org/blog/index.php?pk=146531&T=2

Globally Unique Identifier (entire table): ba.freestatistics.org/blog/index.php?pk=146531&T=2

As an alternative you can also use a QR Code:  

The GUIDs for individual cells are displayed in the table below:

Multiple Linear Regression - Ordinary Least Squares
VariableParameterS.D.T-STATH0: parameter = 02-tail p-value1-tail p-value
(Intercept)14.854720503894820.984520.70790.4844780.242239
omzet0.3507102162359780.01539622.779300
t-0.4333482291821651.053882-0.41120.6838540.341927


Multiple Linear Regression - Regression Statistics
Multiple R0.972296963468357
R-squared0.945361385169787
Adjusted R-squared0.941718810847773
F-TEST (value)259.5311177198
F-TEST (DF numerator)2
F-TEST (DF denominator)30
p-value0
Multiple Linear Regression - Residual Statistics
Residual Standard Deviation57.6092207573889
Sum Squared Residuals99564.6694882072

\begin{tabular}{lllllllll}
\hline
Multiple Linear Regression - Regression Statistics \tabularnewline
Multiple R & 0.972296963468357 \tabularnewline
R-squared & 0.945361385169787 \tabularnewline
Adjusted R-squared & 0.941718810847773 \tabularnewline
F-TEST (value) & 259.5311177198 \tabularnewline
F-TEST (DF numerator) & 2 \tabularnewline
F-TEST (DF denominator) & 30 \tabularnewline
p-value & 0 \tabularnewline
Multiple Linear Regression - Residual Statistics \tabularnewline
Residual Standard Deviation & 57.6092207573889 \tabularnewline
Sum Squared Residuals & 99564.6694882072 \tabularnewline
\hline
\end{tabular}
%Source: https://freestatistics.org/blog/index.php?pk=146531&T=3

[TABLE]
[ROW][C]Multiple Linear Regression - Regression Statistics[/C][/ROW]
[ROW][C]Multiple R[/C][C]0.972296963468357[/C][/ROW]
[ROW][C]R-squared[/C][C]0.945361385169787[/C][/ROW]
[ROW][C]Adjusted R-squared[/C][C]0.941718810847773[/C][/ROW]
[ROW][C]F-TEST (value)[/C][C]259.5311177198[/C][/ROW]
[ROW][C]F-TEST (DF numerator)[/C][C]2[/C][/ROW]
[ROW][C]F-TEST (DF denominator)[/C][C]30[/C][/ROW]
[ROW][C]p-value[/C][C]0[/C][/ROW]
[ROW][C]Multiple Linear Regression - Residual Statistics[/C][/ROW]
[ROW][C]Residual Standard Deviation[/C][C]57.6092207573889[/C][/ROW]
[ROW][C]Sum Squared Residuals[/C][C]99564.6694882072[/C][/ROW]
[/TABLE]
Source: https://freestatistics.org/blog/index.php?pk=146531&T=3

Globally Unique Identifier (entire table): ba.freestatistics.org/blog/index.php?pk=146531&T=3

As an alternative you can also use a QR Code:  

The GUIDs for individual cells are displayed in the table below:

Multiple Linear Regression - Regression Statistics
Multiple R0.972296963468357
R-squared0.945361385169787
Adjusted R-squared0.941718810847773
F-TEST (value)259.5311177198
F-TEST (DF numerator)2
F-TEST (DF denominator)30
p-value0
Multiple Linear Regression - Residual Statistics
Residual Standard Deviation57.6092207573889
Sum Squared Residuals99564.6694882072


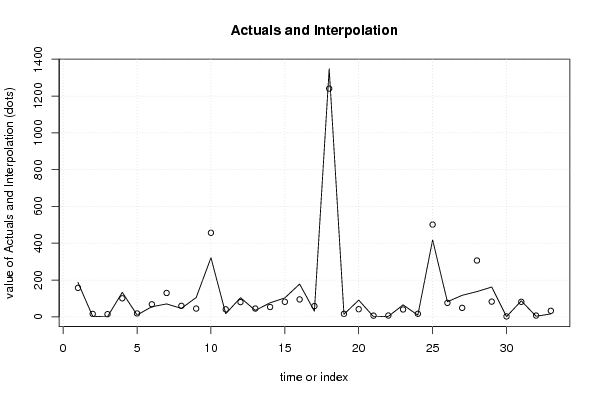
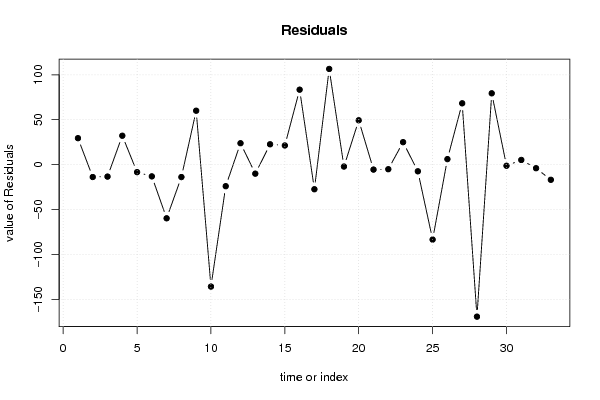
Multiple Linear Regression - Actuals, Interpolation, and Residuals
Time or IndexActualsInterpolationForecastResidualsPrediction Error
1187157.51114049899229.4888595010083
2215.7415751267103-13.7415751267103
3114.2560962488202-13.2560962488202
4133100.79888164616132.2011183538393
51018.2993428177596-8.29934281775959
65568.0175555103224-13.0175555103223
770129.659915554908-59.6599155549084
84659.7859445110025-13.7859445110025
910544.973477416145260.0265225838548
10321456.624633264238-135.624633264238
111740.9503890116571-23.9503890116571
1210480.147295217140423.8527047828596
133544.9936355805964-9.99363558059642
147653.328042757313722.6719572426863
1510381.652932259481821.3470677405182
1617894.546572247266883.4534277527332
173158.3407819620148-27.3407819620148
1813471240.50228288055106.497717119448
191416.090279987805-2.09027998780504
209141.609487760085349.3905122399147
2116.45582812354123-5.45582812354123
2227.074610543067-5.074610543067
236539.958732856302825.0412671436972
24916.3785103555461-7.37851035554607
25418501.328101396958-83.328101396958
268275.833971089776.16602891022997
2711748.746646426653568.2533535733465
28137306.085307130915-169.085307130915
2916282.60026137565179.399738624349
3012.20498384466577-1.20498384466577
318781.73356491728675.2664350827133
3236.94965084607709-3.94965084607709
331632.8195688345933-16.8195688345933

\begin{tabular}{lllllllll}
\hline
Multiple Linear Regression - Actuals, Interpolation, and Residuals \tabularnewline
Time or Index & Actuals & InterpolationForecast & ResidualsPrediction Error \tabularnewline
1 & 187 & 157.511140498992 & 29.4888595010083 \tabularnewline
2 & 2 & 15.7415751267103 & -13.7415751267103 \tabularnewline
3 & 1 & 14.2560962488202 & -13.2560962488202 \tabularnewline
4 & 133 & 100.798881646161 & 32.2011183538393 \tabularnewline
5 & 10 & 18.2993428177596 & -8.29934281775959 \tabularnewline
6 & 55 & 68.0175555103224 & -13.0175555103223 \tabularnewline
7 & 70 & 129.659915554908 & -59.6599155549084 \tabularnewline
8 & 46 & 59.7859445110025 & -13.7859445110025 \tabularnewline
9 & 105 & 44.9734774161452 & 60.0265225838548 \tabularnewline
10 & 321 & 456.624633264238 & -135.624633264238 \tabularnewline
11 & 17 & 40.9503890116571 & -23.9503890116571 \tabularnewline
12 & 104 & 80.1472952171404 & 23.8527047828596 \tabularnewline
13 & 35 & 44.9936355805964 & -9.99363558059642 \tabularnewline
14 & 76 & 53.3280427573137 & 22.6719572426863 \tabularnewline
15 & 103 & 81.6529322594818 & 21.3470677405182 \tabularnewline
16 & 178 & 94.5465722472668 & 83.4534277527332 \tabularnewline
17 & 31 & 58.3407819620148 & -27.3407819620148 \tabularnewline
18 & 1347 & 1240.50228288055 & 106.497717119448 \tabularnewline
19 & 14 & 16.090279987805 & -2.09027998780504 \tabularnewline
20 & 91 & 41.6094877600853 & 49.3905122399147 \tabularnewline
21 & 1 & 6.45582812354123 & -5.45582812354123 \tabularnewline
22 & 2 & 7.074610543067 & -5.074610543067 \tabularnewline
23 & 65 & 39.9587328563028 & 25.0412671436972 \tabularnewline
24 & 9 & 16.3785103555461 & -7.37851035554607 \tabularnewline
25 & 418 & 501.328101396958 & -83.328101396958 \tabularnewline
26 & 82 & 75.83397108977 & 6.16602891022997 \tabularnewline
27 & 117 & 48.7466464266535 & 68.2533535733465 \tabularnewline
28 & 137 & 306.085307130915 & -169.085307130915 \tabularnewline
29 & 162 & 82.600261375651 & 79.399738624349 \tabularnewline
30 & 1 & 2.20498384466577 & -1.20498384466577 \tabularnewline
31 & 87 & 81.7335649172867 & 5.2664350827133 \tabularnewline
32 & 3 & 6.94965084607709 & -3.94965084607709 \tabularnewline
33 & 16 & 32.8195688345933 & -16.8195688345933 \tabularnewline
\hline
\end{tabular}
%Source: https://freestatistics.org/blog/index.php?pk=146531&T=4

[TABLE]
[ROW][C]Multiple Linear Regression - Actuals, Interpolation, and Residuals[/C][/ROW]
[ROW][C]Time or Index[/C][C]Actuals[/C][C]InterpolationForecast[/C][C]ResidualsPrediction Error[/C][/ROW]
[ROW][C]1[/C][C]187[/C][C]157.511140498992[/C][C]29.4888595010083[/C][/ROW]
[ROW][C]2[/C][C]2[/C][C]15.7415751267103[/C][C]-13.7415751267103[/C][/ROW]
[ROW][C]3[/C][C]1[/C][C]14.2560962488202[/C][C]-13.2560962488202[/C][/ROW]
[ROW][C]4[/C][C]133[/C][C]100.798881646161[/C][C]32.2011183538393[/C][/ROW]
[ROW][C]5[/C][C]10[/C][C]18.2993428177596[/C][C]-8.29934281775959[/C][/ROW]
[ROW][C]6[/C][C]55[/C][C]68.0175555103224[/C][C]-13.0175555103223[/C][/ROW]
[ROW][C]7[/C][C]70[/C][C]129.659915554908[/C][C]-59.6599155549084[/C][/ROW]
[ROW][C]8[/C][C]46[/C][C]59.7859445110025[/C][C]-13.7859445110025[/C][/ROW]
[ROW][C]9[/C][C]105[/C][C]44.9734774161452[/C][C]60.0265225838548[/C][/ROW]
[ROW][C]10[/C][C]321[/C][C]456.624633264238[/C][C]-135.624633264238[/C][/ROW]
[ROW][C]11[/C][C]17[/C][C]40.9503890116571[/C][C]-23.9503890116571[/C][/ROW]
[ROW][C]12[/C][C]104[/C][C]80.1472952171404[/C][C]23.8527047828596[/C][/ROW]
[ROW][C]13[/C][C]35[/C][C]44.9936355805964[/C][C]-9.99363558059642[/C][/ROW]
[ROW][C]14[/C][C]76[/C][C]53.3280427573137[/C][C]22.6719572426863[/C][/ROW]
[ROW][C]15[/C][C]103[/C][C]81.6529322594818[/C][C]21.3470677405182[/C][/ROW]
[ROW][C]16[/C][C]178[/C][C]94.5465722472668[/C][C]83.4534277527332[/C][/ROW]
[ROW][C]17[/C][C]31[/C][C]58.3407819620148[/C][C]-27.3407819620148[/C][/ROW]
[ROW][C]18[/C][C]1347[/C][C]1240.50228288055[/C][C]106.497717119448[/C][/ROW]
[ROW][C]19[/C][C]14[/C][C]16.090279987805[/C][C]-2.09027998780504[/C][/ROW]
[ROW][C]20[/C][C]91[/C][C]41.6094877600853[/C][C]49.3905122399147[/C][/ROW]
[ROW][C]21[/C][C]1[/C][C]6.45582812354123[/C][C]-5.45582812354123[/C][/ROW]
[ROW][C]22[/C][C]2[/C][C]7.074610543067[/C][C]-5.074610543067[/C][/ROW]
[ROW][C]23[/C][C]65[/C][C]39.9587328563028[/C][C]25.0412671436972[/C][/ROW]
[ROW][C]24[/C][C]9[/C][C]16.3785103555461[/C][C]-7.37851035554607[/C][/ROW]
[ROW][C]25[/C][C]418[/C][C]501.328101396958[/C][C]-83.328101396958[/C][/ROW]
[ROW][C]26[/C][C]82[/C][C]75.83397108977[/C][C]6.16602891022997[/C][/ROW]
[ROW][C]27[/C][C]117[/C][C]48.7466464266535[/C][C]68.2533535733465[/C][/ROW]
[ROW][C]28[/C][C]137[/C][C]306.085307130915[/C][C]-169.085307130915[/C][/ROW]
[ROW][C]29[/C][C]162[/C][C]82.600261375651[/C][C]79.399738624349[/C][/ROW]
[ROW][C]30[/C][C]1[/C][C]2.20498384466577[/C][C]-1.20498384466577[/C][/ROW]
[ROW][C]31[/C][C]87[/C][C]81.7335649172867[/C][C]5.2664350827133[/C][/ROW]
[ROW][C]32[/C][C]3[/C][C]6.94965084607709[/C][C]-3.94965084607709[/C][/ROW]
[ROW][C]33[/C][C]16[/C][C]32.8195688345933[/C][C]-16.8195688345933[/C][/ROW]
[/TABLE]
Source: https://freestatistics.org/blog/index.php?pk=146531&T=4

Globally Unique Identifier (entire table): ba.freestatistics.org/blog/index.php?pk=146531&T=4

As an alternative you can also use a QR Code:  

The GUIDs for individual cells are displayed in the table below:

Multiple Linear Regression - Actuals, Interpolation, and Residuals
Time or IndexActualsInterpolationForecastResidualsPrediction Error
1187157.51114049899229.4888595010083
2215.7415751267103-13.7415751267103
3114.2560962488202-13.2560962488202
4133100.79888164616132.2011183538393
51018.2993428177596-8.29934281775959
65568.0175555103224-13.0175555103223
770129.659915554908-59.6599155549084
84659.7859445110025-13.7859445110025
910544.973477416145260.0265225838548
10321456.624633264238-135.624633264238
111740.9503890116571-23.9503890116571
1210480.147295217140423.8527047828596
133544.9936355805964-9.99363558059642
147653.328042757313722.6719572426863
1510381.652932259481821.3470677405182
1617894.546572247266883.4534277527332
173158.3407819620148-27.3407819620148
1813471240.50228288055106.497717119448
191416.090279987805-2.09027998780504
209141.609487760085349.3905122399147
2116.45582812354123-5.45582812354123
2227.074610543067-5.074610543067
236539.958732856302825.0412671436972
24916.3785103555461-7.37851035554607
25418501.328101396958-83.328101396958
268275.833971089776.16602891022997
2711748.746646426653568.2533535733465
28137306.085307130915-169.085307130915
2916282.60026137565179.399738624349
3012.20498384466577-1.20498384466577
318781.73356491728675.2664350827133
3236.94965084607709-3.94965084607709
331632.8195688345933-16.8195688345933


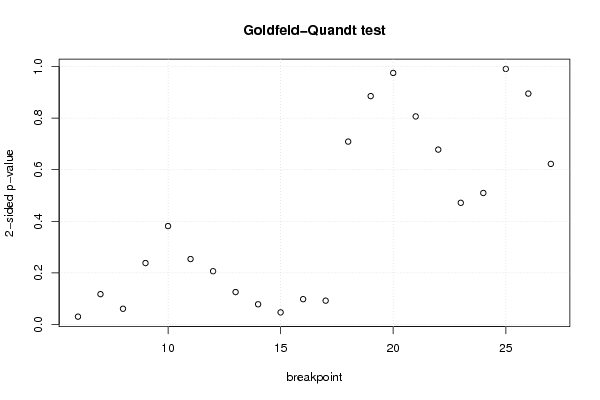
Goldfeld-Quandt test for Heteroskedasticity
p-valuesAlternative Hypothesis
breakpoint indexgreater2-sidedless
60.01517501531820550.0303500306364110.984824984681794
70.05879779251282630.1175955850256530.941202207487174
80.03049303734709950.06098607469419910.9695069626529
90.1190874041057920.2381748082115850.880912595894208
100.1907448880267630.3814897760535250.809255111973237
110.1268593680465770.2537187360931530.873140631953423
120.1032471612971450.206494322594290.896752838702855
130.06280897580863710.1256179516172740.937191024191363
140.03916090512804040.07832181025608090.96083909487196
150.0234498847614660.0468997695229320.976550115238534
160.04907516201622920.09815032403245840.950924837983771
170.04616182567321470.09232365134642940.953838174326785
180.6455418055456150.7089163889087690.354458194454385
190.5573781104913180.8852437790173640.442621889508682
200.4875025385772340.9750050771544690.512497461422766
210.4032210690187330.8064421380374650.596778930981267
220.3389144434200160.6778288868400330.661085556579984
230.2358517219889660.4717034439779310.764148278011034
240.2548418710160550.5096837420321090.745158128983945
250.5047550678957080.9904898642085830.495244932104292
260.4474591572830040.8949183145660080.552540842716996
270.3111894623109260.6223789246218510.688810537689074

\begin{tabular}{lllllllll}
\hline
Goldfeld-Quandt test for Heteroskedasticity \tabularnewline
p-values & Alternative Hypothesis \tabularnewline
breakpoint index & greater & 2-sided & less \tabularnewline
6 & 0.0151750153182055 & 0.030350030636411 & 0.984824984681794 \tabularnewline
7 & 0.0587977925128263 & 0.117595585025653 & 0.941202207487174 \tabularnewline
8 & 0.0304930373470995 & 0.0609860746941991 & 0.9695069626529 \tabularnewline
9 & 0.119087404105792 & 0.238174808211585 & 0.880912595894208 \tabularnewline
10 & 0.190744888026763 & 0.381489776053525 & 0.809255111973237 \tabularnewline
11 & 0.126859368046577 & 0.253718736093153 & 0.873140631953423 \tabularnewline
12 & 0.103247161297145 & 0.20649432259429 & 0.896752838702855 \tabularnewline
13 & 0.0628089758086371 & 0.125617951617274 & 0.937191024191363 \tabularnewline
14 & 0.0391609051280404 & 0.0783218102560809 & 0.96083909487196 \tabularnewline
15 & 0.023449884761466 & 0.046899769522932 & 0.976550115238534 \tabularnewline
16 & 0.0490751620162292 & 0.0981503240324584 & 0.950924837983771 \tabularnewline
17 & 0.0461618256732147 & 0.0923236513464294 & 0.953838174326785 \tabularnewline
18 & 0.645541805545615 & 0.708916388908769 & 0.354458194454385 \tabularnewline
19 & 0.557378110491318 & 0.885243779017364 & 0.442621889508682 \tabularnewline
20 & 0.487502538577234 & 0.975005077154469 & 0.512497461422766 \tabularnewline
21 & 0.403221069018733 & 0.806442138037465 & 0.596778930981267 \tabularnewline
22 & 0.338914443420016 & 0.677828886840033 & 0.661085556579984 \tabularnewline
23 & 0.235851721988966 & 0.471703443977931 & 0.764148278011034 \tabularnewline
24 & 0.254841871016055 & 0.509683742032109 & 0.745158128983945 \tabularnewline
25 & 0.504755067895708 & 0.990489864208583 & 0.495244932104292 \tabularnewline
26 & 0.447459157283004 & 0.894918314566008 & 0.552540842716996 \tabularnewline
27 & 0.311189462310926 & 0.622378924621851 & 0.688810537689074 \tabularnewline
\hline
\end{tabular}
%Source: https://freestatistics.org/blog/index.php?pk=146531&T=5

[TABLE]
[ROW][C]Goldfeld-Quandt test for Heteroskedasticity[/C][/ROW]
[ROW][C]p-values[/C][C]Alternative Hypothesis[/C][/ROW]
[ROW][C]breakpoint index[/C][C]greater[/C][C]2-sided[/C][C]less[/C][/ROW]
[ROW][C]6[/C][C]0.0151750153182055[/C][C]0.030350030636411[/C][C]0.984824984681794[/C][/ROW]
[ROW][C]7[/C][C]0.0587977925128263[/C][C]0.117595585025653[/C][C]0.941202207487174[/C][/ROW]
[ROW][C]8[/C][C]0.0304930373470995[/C][C]0.0609860746941991[/C][C]0.9695069626529[/C][/ROW]
[ROW][C]9[/C][C]0.119087404105792[/C][C]0.238174808211585[/C][C]0.880912595894208[/C][/ROW]
[ROW][C]10[/C][C]0.190744888026763[/C][C]0.381489776053525[/C][C]0.809255111973237[/C][/ROW]
[ROW][C]11[/C][C]0.126859368046577[/C][C]0.253718736093153[/C][C]0.873140631953423[/C][/ROW]
[ROW][C]12[/C][C]0.103247161297145[/C][C]0.20649432259429[/C][C]0.896752838702855[/C][/ROW]
[ROW][C]13[/C][C]0.0628089758086371[/C][C]0.125617951617274[/C][C]0.937191024191363[/C][/ROW]
[ROW][C]14[/C][C]0.0391609051280404[/C][C]0.0783218102560809[/C][C]0.96083909487196[/C][/ROW]
[ROW][C]15[/C][C]0.023449884761466[/C][C]0.046899769522932[/C][C]0.976550115238534[/C][/ROW]
[ROW][C]16[/C][C]0.0490751620162292[/C][C]0.0981503240324584[/C][C]0.950924837983771[/C][/ROW]
[ROW][C]17[/C][C]0.0461618256732147[/C][C]0.0923236513464294[/C][C]0.953838174326785[/C][/ROW]
[ROW][C]18[/C][C]0.645541805545615[/C][C]0.708916388908769[/C][C]0.354458194454385[/C][/ROW]
[ROW][C]19[/C][C]0.557378110491318[/C][C]0.885243779017364[/C][C]0.442621889508682[/C][/ROW]
[ROW][C]20[/C][C]0.487502538577234[/C][C]0.975005077154469[/C][C]0.512497461422766[/C][/ROW]
[ROW][C]21[/C][C]0.403221069018733[/C][C]0.806442138037465[/C][C]0.596778930981267[/C][/ROW]
[ROW][C]22[/C][C]0.338914443420016[/C][C]0.677828886840033[/C][C]0.661085556579984[/C][/ROW]
[ROW][C]23[/C][C]0.235851721988966[/C][C]0.471703443977931[/C][C]0.764148278011034[/C][/ROW]
[ROW][C]24[/C][C]0.254841871016055[/C][C]0.509683742032109[/C][C]0.745158128983945[/C][/ROW]
[ROW][C]25[/C][C]0.504755067895708[/C][C]0.990489864208583[/C][C]0.495244932104292[/C][/ROW]
[ROW][C]26[/C][C]0.447459157283004[/C][C]0.894918314566008[/C][C]0.552540842716996[/C][/ROW]
[ROW][C]27[/C][C]0.311189462310926[/C][C]0.622378924621851[/C][C]0.688810537689074[/C][/ROW]
[/TABLE]
Source: https://freestatistics.org/blog/index.php?pk=146531&T=5

Globally Unique Identifier (entire table): ba.freestatistics.org/blog/index.php?pk=146531&T=5

As an alternative you can also use a QR Code:  

The GUIDs for individual cells are displayed in the table below:

Goldfeld-Quandt test for Heteroskedasticity
p-valuesAlternative Hypothesis
breakpoint indexgreater2-sidedless
60.01517501531820550.0303500306364110.984824984681794
70.05879779251282630.1175955850256530.941202207487174
80.03049303734709950.06098607469419910.9695069626529
90.1190874041057920.2381748082115850.880912595894208
100.1907448880267630.3814897760535250.809255111973237
110.1268593680465770.2537187360931530.873140631953423
120.1032471612971450.206494322594290.896752838702855
130.06280897580863710.1256179516172740.937191024191363
140.03916090512804040.07832181025608090.96083909487196
150.0234498847614660.0468997695229320.976550115238534
160.04907516201622920.09815032403245840.950924837983771
170.04616182567321470.09232365134642940.953838174326785
180.6455418055456150.7089163889087690.354458194454385
190.5573781104913180.8852437790173640.442621889508682
200.4875025385772340.9750050771544690.512497461422766
210.4032210690187330.8064421380374650.596778930981267
220.3389144434200160.6778288868400330.661085556579984
230.2358517219889660.4717034439779310.764148278011034
240.2548418710160550.5096837420321090.745158128983945
250.5047550678957080.9904898642085830.495244932104292
260.4474591572830040.8949183145660080.552540842716996
270.3111894623109260.6223789246218510.688810537689074


Meta Analysis of Goldfeld-Quandt test for Heteroskedasticity
Description# significant tests% significant testsOK/NOK
1% type I error level00OK
5% type I error level20.0909090909090909NOK
10% type I error level60.272727272727273NOK

\begin{tabular}{lllllllll}
\hline
Meta Analysis of Goldfeld-Quandt test for Heteroskedasticity \tabularnewline
Description & # significant tests & % significant tests & OK/NOK \tabularnewline
1% type I error level & 0 & 0 & OK \tabularnewline
5% type I error level & 2 & 0.0909090909090909 & NOK \tabularnewline
10% type I error level & 6 & 0.272727272727273 & NOK \tabularnewline
\hline
\end{tabular}
%Source: https://freestatistics.org/blog/index.php?pk=146531&T=6

[TABLE]
[ROW][C]Meta Analysis of Goldfeld-Quandt test for Heteroskedasticity[/C][/ROW]
[ROW][C]Description[/C][C]# significant tests[/C][C]% significant tests[/C][C]OK/NOK[/C][/ROW]
[ROW][C]1% type I error level[/C][C]0[/C][C]0[/C][C]OK[/C][/ROW]
[ROW][C]5% type I error level[/C][C]2[/C][C]0.0909090909090909[/C][C]NOK[/C][/ROW]
[ROW][C]10% type I error level[/C][C]6[/C][C]0.272727272727273[/C][C]NOK[/C][/ROW]
[/TABLE]
Source: https://freestatistics.org/blog/index.php?pk=146531&T=6

Globally Unique Identifier (entire table): ba.freestatistics.org/blog/index.php?pk=146531&T=6

As an alternative you can also use a QR Code:  

The GUIDs for individual cells are displayed in the table below:

Meta Analysis of Goldfeld-Quandt test for Heteroskedasticity
Description# significant tests% significant testsOK/NOK
1% type I error level00OK
5% type I error level20.0909090909090909NOK
10% type I error level60.272727272727273NOK


Parameters (Session):
par1 = 2 ; par2 = Do not include Seasonal Dummies ; par3 = Linear Trend ;
Parameters (R input):
par1 = 2 ; par2 = Do not include Seasonal Dummies ; par3 = Linear Trend ;
R code (references can be found in the software module):
library(lattice)
library(lmtest)
n25 <- 25 #minimum number of obs. for Goldfeld-Quandt test
par1 <- as.numeric(par1)
x <- t(y)
k <- length(x[1,])
n <- length(x[,1])
x1 <- cbind(x[,par1], x[,1:k!=par1])
mycolnames <- c(colnames(x)[par1], colnames(x)[1:k!=par1])
colnames(x1) <- mycolnames #colnames(x)[par1]
x <- x1
if (par3 == 'First Differences'){
x2 <- array(0, dim=c(n-1,k), dimnames=list(1:(n-1), paste('(1-B)',colnames(x),sep='')))
for (i in 1:n-1) {
for (j in 1:k) {
x2[i,j] <- x[i+1,j] - x[i,j]
}
}
x <- x2
}
if (par2 == 'Include Monthly Dummies'){
x2 <- array(0, dim=c(n,11), dimnames=list(1:n, paste('M', seq(1:11), sep ='')))
for (i in 1:11){
x2[seq(i,n,12),i] <- 1
}
x <- cbind(x, x2)
}
if (par2 == 'Include Quarterly Dummies'){
x2 <- array(0, dim=c(n,3), dimnames=list(1:n, paste('Q', seq(1:3), sep ='')))
for (i in 1:3){
x2[seq(i,n,4),i] <- 1
}
x <- cbind(x, x2)
}
k <- length(x[1,])
if (par3 == 'Linear Trend'){
x <- cbind(x, c(1:n))
colnames(x)[k+1] <- 't'
}
x
k <- length(x[1,])
df <- as.data.frame(x)
(mylm <- lm(df))
(mysum <- summary(mylm))
if (n > n25) {
kp3 <- k + 3
nmkm3 <- n - k - 3
gqarr <- array(NA, dim=c(nmkm3-kp3+1,3))
numgqtests <- 0
numsignificant1 <- 0
numsignificant5 <- 0
numsignificant10 <- 0
for (mypoint in kp3:nmkm3) {
j <- 0
numgqtests <- numgqtests + 1
for (myalt in c('greater', 'two.sided', 'less')) {
j <- j + 1
gqarr[mypoint-kp3+1,j] <- gqtest(mylm, point=mypoint, alternative=myalt)$p.value
}
if (gqarr[mypoint-kp3+1,2] < 0.01) numsignificant1 <- numsignificant1 + 1
if (gqarr[mypoint-kp3+1,2] < 0.05) numsignificant5 <- numsignificant5 + 1
if (gqarr[mypoint-kp3+1,2] < 0.10) numsignificant10 <- numsignificant10 + 1
}
gqarr
}
bitmap(file='test0.png')
plot(x[,1], type='l', main='Actuals and Interpolation', ylab='value of Actuals and Interpolation (dots)', xlab='time or index')
points(x[,1]-mysum$resid)
grid()
dev.off()
bitmap(file='test1.png')
plot(mysum$resid, type='b', pch=19, main='Residuals', ylab='value of Residuals', xlab='time or index')
grid()
dev.off()
bitmap(file='test2.png')
hist(mysum$resid, main='Residual Histogram', xlab='values of Residuals')
grid()
dev.off()
bitmap(file='test3.png')
densityplot(~mysum$resid,col='black',main='Residual Density Plot', xlab='values of Residuals')
dev.off()
bitmap(file='test4.png')
qqnorm(mysum$resid, main='Residual Normal Q-Q Plot')
qqline(mysum$resid)
grid()
dev.off()
(myerror <- as.ts(mysum$resid))
bitmap(file='test5.png')
dum <- cbind(lag(myerror,k=1),myerror)
dum
dum1 <- dum[2:length(myerror),]
dum1
z <- as.data.frame(dum1)
z
plot(z,main=paste('Residual Lag plot, lowess, and regression line'), ylab='values of Residuals', xlab='lagged values of Residuals')
lines(lowess(z))
abline(lm(z))
grid()
dev.off()
bitmap(file='test6.png')
acf(mysum$resid, lag.max=length(mysum$resid)/2, main='Residual Autocorrelation Function')
grid()
dev.off()
bitmap(file='test7.png')
pacf(mysum$resid, lag.max=length(mysum$resid)/2, main='Residual Partial Autocorrelation Function')
grid()
dev.off()
bitmap(file='test8.png')
opar <- par(mfrow = c(2,2), oma = c(0, 0, 1.1, 0))
plot(mylm, las = 1, sub='Residual Diagnostics')
par(opar)
dev.off()
if (n > n25) {
bitmap(file='test9.png')
plot(kp3:nmkm3,gqarr[,2], main='Goldfeld-Quandt test',ylab='2-sided p-value',xlab='breakpoint')
grid()
dev.off()
}
load(file='createtable')
a<-table.start()
a<-table.row.start(a)
a<-table.element(a, 'Multiple Linear Regression - Estimated Regression Equation', 1, TRUE)
a<-table.row.end(a)
myeq <- colnames(x)[1]
myeq <- paste(myeq, '[t] = ', sep='')
for (i in 1:k){
if (mysum$coefficients[i,1] > 0) myeq <- paste(myeq, '+', '')
myeq <- paste(myeq, mysum$coefficients[i,1], sep=' ')
if (rownames(mysum$coefficients)[i] != '(Intercept)') {
myeq <- paste(myeq, rownames(mysum$coefficients)[i], sep='')
if (rownames(mysum$coefficients)[i] != 't') myeq <- paste(myeq, '[t]', sep='')
}
}
myeq <- paste(myeq, ' + e[t]')
a<-table.row.start(a)
a<-table.element(a, myeq)
a<-table.row.end(a)
a<-table.end(a)
table.save(a,file='mytable1.tab')
a<-table.start()
a<-table.row.start(a)
a<-table.element(a,hyperlink('ols1.htm','Multiple Linear Regression - Ordinary Least Squares',''), 6, TRUE)
a<-table.row.end(a)
a<-table.row.start(a)
a<-table.element(a,'Variable',header=TRUE)
a<-table.element(a,'Parameter',header=TRUE)
a<-table.element(a,'S.D.',header=TRUE)
a<-table.element(a,'T-STAT
H0: parameter = 0',header=TRUE)
a<-table.element(a,'2-tail p-value',header=TRUE)
a<-table.element(a,'1-tail p-value',header=TRUE)
a<-table.row.end(a)
for (i in 1:k){
a<-table.row.start(a)
a<-table.element(a,rownames(mysum$coefficients)[i],header=TRUE)
a<-table.element(a,mysum$coefficients[i,1])
a<-table.element(a, round(mysum$coefficients[i,2],6))
a<-table.element(a, round(mysum$coefficients[i,3],4))
a<-table.element(a, round(mysum$coefficients[i,4],6))
a<-table.element(a, round(mysum$coefficients[i,4]/2,6))
a<-table.row.end(a)
}
a<-table.end(a)
table.save(a,file='mytable2.tab')
a<-table.start()
a<-table.row.start(a)
a<-table.element(a, 'Multiple Linear Regression - Regression Statistics', 2, TRUE)
a<-table.row.end(a)
a<-table.row.start(a)
a<-table.element(a, 'Multiple R',1,TRUE)
a<-table.element(a, sqrt(mysum$r.squared))
a<-table.row.end(a)
a<-table.row.start(a)
a<-table.element(a, 'R-squared',1,TRUE)
a<-table.element(a, mysum$r.squared)
a<-table.row.end(a)
a<-table.row.start(a)
a<-table.element(a, 'Adjusted R-squared',1,TRUE)
a<-table.element(a, mysum$adj.r.squared)
a<-table.row.end(a)
a<-table.row.start(a)
a<-table.element(a, 'F-TEST (value)',1,TRUE)
a<-table.element(a, mysum$fstatistic[1])
a<-table.row.end(a)
a<-table.row.start(a)
a<-table.element(a, 'F-TEST (DF numerator)',1,TRUE)
a<-table.element(a, mysum$fstatistic[2])
a<-table.row.end(a)
a<-table.row.start(a)
a<-table.element(a, 'F-TEST (DF denominator)',1,TRUE)
a<-table.element(a, mysum$fstatistic[3])
a<-table.row.end(a)
a<-table.row.start(a)
a<-table.element(a, 'p-value',1,TRUE)
a<-table.element(a, 1-pf(mysum$fstatistic[1],mysum$fstatistic[2],mysum$fstatistic[3]))
a<-table.row.end(a)
a<-table.row.start(a)
a<-table.element(a, 'Multiple Linear Regression - Residual Statistics', 2, TRUE)
a<-table.row.end(a)
a<-table.row.start(a)
a<-table.element(a, 'Residual Standard Deviation',1,TRUE)
a<-table.element(a, mysum$sigma)
a<-table.row.end(a)
a<-table.row.start(a)
a<-table.element(a, 'Sum Squared Residuals',1,TRUE)
a<-table.element(a, sum(myerror*myerror))
a<-table.row.end(a)
a<-table.end(a)
table.save(a,file='mytable3.tab')
a<-table.start()
a<-table.row.start(a)
a<-table.element(a, 'Multiple Linear Regression - Actuals, Interpolation, and Residuals', 4, TRUE)
a<-table.row.end(a)
a<-table.row.start(a)
a<-table.element(a, 'Time or Index', 1, TRUE)
a<-table.element(a, 'Actuals', 1, TRUE)
a<-table.element(a, 'Interpolation
Forecast', 1, TRUE)
a<-table.element(a, 'Residuals
Prediction Error', 1, TRUE)
a<-table.row.end(a)
for (i in 1:n) {
a<-table.row.start(a)
a<-table.element(a,i, 1, TRUE)
a<-table.element(a,x[i])
a<-table.element(a,x[i]-mysum$resid[i])
a<-table.element(a,mysum$resid[i])
a<-table.row.end(a)
}
a<-table.end(a)
table.save(a,file='mytable4.tab')
if (n > n25) {
a<-table.start()
a<-table.row.start(a)
a<-table.element(a,'Goldfeld-Quandt test for Heteroskedasticity',4,TRUE)
a<-table.row.end(a)
a<-table.row.start(a)
a<-table.element(a,'p-values',header=TRUE)
a<-table.element(a,'Alternative Hypothesis',3,header=TRUE)
a<-table.row.end(a)
a<-table.row.start(a)
a<-table.element(a,'breakpoint index',header=TRUE)
a<-table.element(a,'greater',header=TRUE)
a<-table.element(a,'2-sided',header=TRUE)
a<-table.element(a,'less',header=TRUE)
a<-table.row.end(a)
for (mypoint in kp3:nmkm3) {
a<-table.row.start(a)
a<-table.element(a,mypoint,header=TRUE)
a<-table.element(a,gqarr[mypoint-kp3+1,1])
a<-table.element(a,gqarr[mypoint-kp3+1,2])
a<-table.element(a,gqarr[mypoint-kp3+1,3])
a<-table.row.end(a)
}
a<-table.end(a)
table.save(a,file='mytable5.tab')
a<-table.start()
a<-table.row.start(a)
a<-table.element(a,'Meta Analysis of Goldfeld-Quandt test for Heteroskedasticity',4,TRUE)
a<-table.row.end(a)
a<-table.row.start(a)
a<-table.element(a,'Description',header=TRUE)
a<-table.element(a,'# significant tests',header=TRUE)
a<-table.element(a,'% significant tests',header=TRUE)
a<-table.element(a,'OK/NOK',header=TRUE)
a<-table.row.end(a)
a<-table.row.start(a)
a<-table.element(a,'1% type I error level',header=TRUE)
a<-table.element(a,numsignificant1)
a<-table.element(a,numsignificant1/numgqtests)
if (numsignificant1/numgqtests < 0.01) dum <- 'OK' else dum <- 'NOK'
a<-table.element(a,dum)
a<-table.row.end(a)
a<-table.row.start(a)
a<-table.element(a,'5% type I error level',header=TRUE)
a<-table.element(a,numsignificant5)
a<-table.element(a,numsignificant5/numgqtests)
if (numsignificant5/numgqtests < 0.05) dum <- 'OK' else dum <- 'NOK'
a<-table.element(a,dum)
a<-table.row.end(a)
a<-table.row.start(a)
a<-table.element(a,'10% type I error level',header=TRUE)
a<-table.element(a,numsignificant10)
a<-table.element(a,numsignificant10/numgqtests)
if (numsignificant10/numgqtests < 0.1) dum <- 'OK' else dum <- 'NOK'
a<-table.element(a,dum)
a<-table.row.end(a)
a<-table.end(a)
table.save(a,file='mytable6.tab')
}