| Multiple Linear Regression - Estimated Regression Equation |
| A[t] = + 29.4332755647748 + 0.779211994822692B[t] -0.545825151595048C[t] + 0.289144634021937D[t] + 0.599487261699369E[t] -0.110697882499544`F `[t] -1.25157762149361t + e[t] |
| Multiple Linear Regression - Ordinary Least Squares | |||||
| Variable | Parameter | S.D. | T-STAT H0: parameter = 0 | 2-tail p-value | 1-tail p-value |
| (Intercept) | 29.4332755647748 | 20.637498 | 1.4262 | 0.164865 | 0.082432 |
| B | 0.779211994822692 | 0.108799 | 7.1619 | 0 | 0 |
| C | -0.545825151595048 | 0.376601 | -1.4493 | 0.15835 | 0.079175 |
| D | 0.289144634021937 | 0.265679 | 1.0883 | 0.285731 | 0.142866 |
| E | 0.599487261699369 | 0.323903 | 1.8508 | 0.074771 | 0.037386 |
| `F ` | -0.110697882499544 | 0.497498 | -0.2225 | 0.825533 | 0.412766 |
| t | -1.25157762149361 | 0.756475 | -1.6545 | 0.109197 | 0.054599 |
| Multiple Linear Regression - Regression Statistics | |
| Multiple R | 0.997955555922536 |
| R-squared | 0.995915291596658 |
| Adjusted R-squared | 0.995039996938799 |
| F-TEST (value) | 1137.80574650457 |
| F-TEST (DF numerator) | 6 |
| F-TEST (DF denominator) | 28 |
| p-value | 0 |
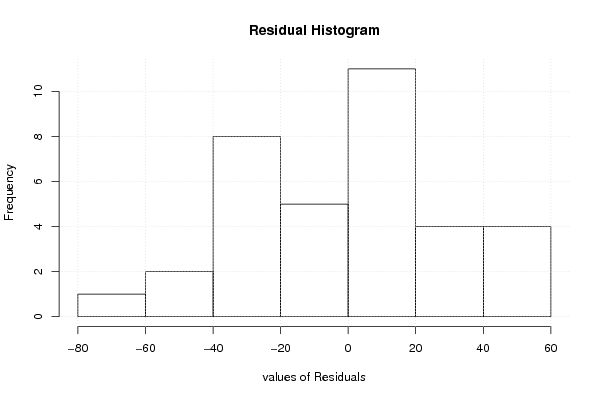
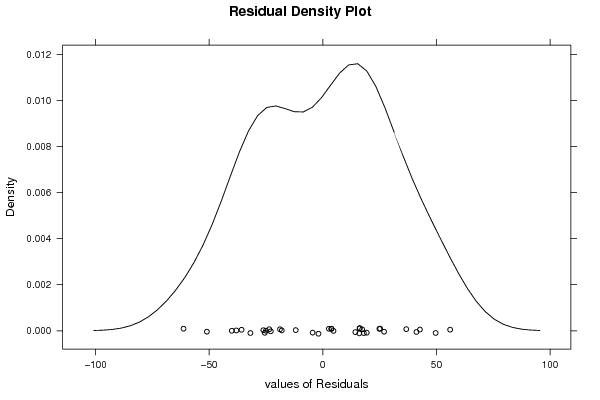
| Multiple Linear Regression - Residual Statistics | |
| Residual Standard Deviation | 32.7805214893154 |
| Sum Squared Residuals | 30087.7524951212 |
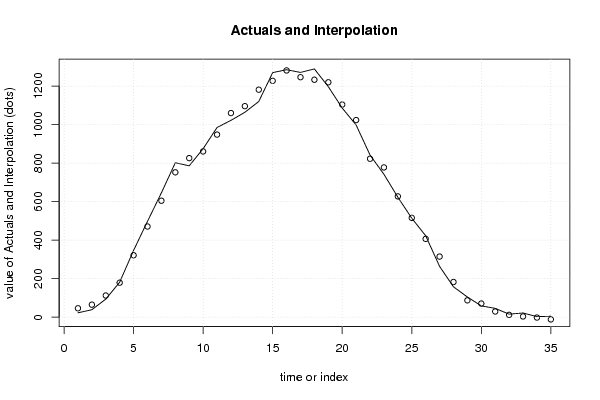
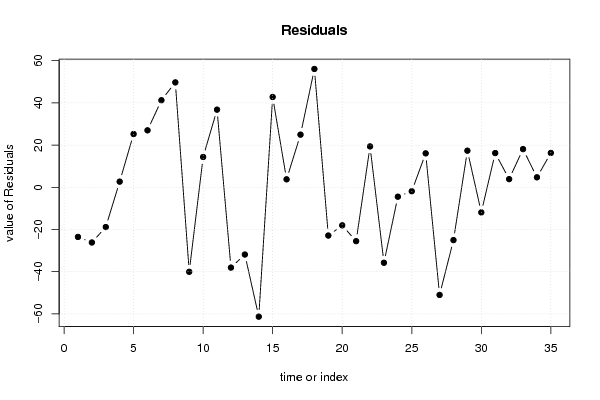
| Multiple Linear Regression - Actuals, Interpolation, and Residuals | |||
| Time or Index | Actuals | Interpolation Forecast | Residuals Prediction Error |
| 1 | 23 | 46.5208158444637 | -23.5208158444637 |
| 2 | 39 | 65.1466072033872 | -26.1466072033872 |
| 3 | 94 | 112.831083295647 | -18.8310832956468 |
| 4 | 182 | 179.327477801395 | 2.67252219860542 |
| 5 | 347 | 321.782054781361 | 25.2179452186395 |
| 6 | 498 | 471.035306878385 | 26.9646931216148 |
| 7 | 646 | 604.786134146062 | 41.2138658539377 |
| 8 | 802 | 752.347867451322 | 49.6521325486775 |
| 9 | 786 | 826.027926940921 | -40.0279269409209 |
| 10 | 875 | 860.666369975629 | 14.3336300243706 |
| 11 | 985 | 948.253144721286 | 36.7468552787136 |
| 12 | 1022 | 1060.03268192404 | -38.0326819240447 |
| 13 | 1064 | 1095.84665010971 | -31.8466501097097 |
| 14 | 1120 | 1181.26608599609 | -61.26608599609 |
| 15 | 1270 | 1227.25348459301 | 42.746515406991 |
| 16 | 1285 | 1281.24314448463 | 3.75685551536991 |
| 17 | 1271 | 1246.08057206769 | 24.9194279323113 |
| 18 | 1289 | 1232.97367519498 | 56.0263248050189 |
| 19 | 1197 | 1219.8603293523 | -22.8603293522984 |
| 20 | 1086 | 1104.03976348552 | -18.0397634855201 |
| 21 | 998 | 1023.51447699064 | -25.5144769906358 |
| 22 | 842 | 822.654936836857 | 19.3450631631428 |
| 23 | 742 | 777.736785772197 | -35.7367857721969 |
| 24 | 623 | 627.467862451286 | -4.46786245128552 |
| 25 | 514 | 515.883412887007 | -1.88341288700717 |
| 26 | 423 | 406.945575217562 | 16.0544247824378 |
| 27 | 264 | 314.981589669861 | -50.9815896698612 |
| 28 | 158 | 183.012905468876 | -25.0129054688759 |
| 29 | 105 | 87.675244767189 | 17.324755232811 |
| 30 | 59 | 70.9016124398013 | -11.9016124398013 |
| 31 | 46 | 29.8029027454541 | 16.1970972545459 |
| 32 | 16 | 12.1465270273741 | 3.85347297262585 |
| 33 | 22 | 3.92325583054309 | 18.0767441694569 |
| 34 | 3 | -1.71189316266292 | 4.71189316266292 |
| 35 | 5 | -11.2563711898118 | 16.2563711898118 |
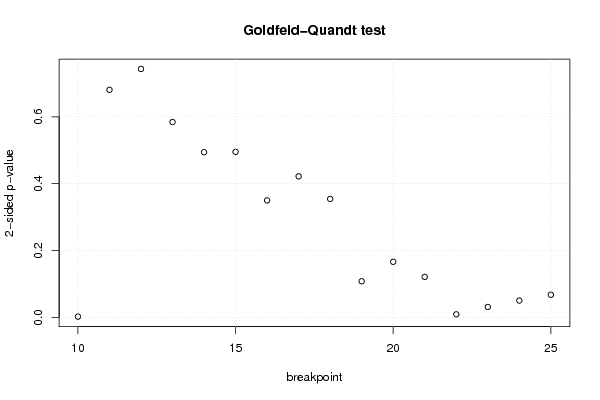
| Goldfeld-Quandt test for Heteroskedasticity | |||
| p-values | Alternative Hypothesis | ||
| breakpoint index | greater | 2-sided | less |
| 10 | 0.00102398021815074 | 0.00204796043630148 | 0.998976019781849 |
| 11 | 0.65943246216835 | 0.6811350756633 | 0.34056753783165 |
| 12 | 0.628198847086325 | 0.74360230582735 | 0.371801152913675 |
| 13 | 0.707616861182822 | 0.584766277634357 | 0.292383138817178 |
| 14 | 0.752799826002489 | 0.494400347995022 | 0.247200173997511 |
| 15 | 0.752322312876098 | 0.495355374247804 | 0.247677687123902 |
| 16 | 0.824928996252687 | 0.350142007494626 | 0.175071003747313 |
| 17 | 0.788924741815652 | 0.422150516368695 | 0.211075258184348 |
| 18 | 0.822737876131949 | 0.354524247736102 | 0.177262123868051 |
| 19 | 0.94599713554725 | 0.1080057289055 | 0.05400286445275 |
| 20 | 0.916852656044208 | 0.166294687911585 | 0.0831473439557925 |
| 21 | 0.939438078025432 | 0.121123843949136 | 0.0605619219745682 |
| 22 | 0.99548494112281 | 0.00903011775437939 | 0.0045150588771897 |
| 23 | 0.98449296909724 | 0.0310140618055194 | 0.0155070309027597 |
| 24 | 0.974899296412458 | 0.0502014071750836 | 0.0251007035875418 |
| 25 | 0.966189939406503 | 0.0676201211869936 | 0.0338100605934968 |
| Meta Analysis of Goldfeld-Quandt test for Heteroskedasticity | |||
| Description | # significant tests | % significant tests | OK/NOK |
| 1% type I error level | 2 | 0.125 | NOK |
| 5% type I error level | 3 | 0.1875 | NOK |
| 10% type I error level | 5 | 0.3125 | NOK |