Free Statistics

of Irreproducible Research!

Author's title

Author*The author of this computation has been verified*
R Software Modulerwasp_multipleregression.wasp
Title produced by softwareMultiple Regression
Date of computationWed, 23 Nov 2011 07:44:00 -0500
Cite this page as followsStatistical Computations at FreeStatistics.org, Office for Research Development and Education, URL https://freestatistics.org/blog/index.php?v=date/2011/Nov/23/t1322052311jlouajzj4rfxyx2.htm/, Retrieved Fri, 19 Apr 2024 20:27:12 +0000
Statistical Computations at FreeStatistics.org, Office for Research Development and Education, URL https://freestatistics.org/blog/index.php?pk=146500, Retrieved Fri, 19 Apr 2024 20:27:12 +0000
QR Codes:

Original text written by user:
IsPrivate?No (this computation is public)
User-defined keywords
Estimated Impact112
Family? (F = Feedback message, R = changed R code, M = changed R Module, P = changed Parameters, D = changed Data)
-       [Multiple Regression] [ws7] [2011-11-23 12:44:00] [d519577d845e738b812f706f10c86f64] [Current]
Feedback Forum

Post a new message
Dataseries X:
7.6 	0.0938 	15863950	33.9 
6.9 	0.0978 	15987075	33.1 
6.8 	0.0923 	16105285	32.2 
7.8 	0.0970 	16192572	30.8 
7.9 	0.1031 	16258032	29.1 
7.9 	0.1102 	16305526	28.2 
7.4 	0.1207 	16334210	27.6 
6.5 	0.1400 	16357992	26.8 
5.9 	0.1270 	16405399	26.7 
6.0 	0.1440 	16485787	26.6 
7.2 	0.1266 	16574989	27.7


Summary of computational transaction
Raw Inputview raw input (R code)
Raw Outputview raw output of R engine
Computing time4 seconds
R Server'Gertrude Mary Cox' @ cox.wessa.net

\begin{tabular}{lllllllll}
\hline
Summary of computational transaction \tabularnewline
Raw Input & view raw input (R code)  \tabularnewline
Raw Output & view raw output of R engine  \tabularnewline
Computing time & 4 seconds \tabularnewline
R Server & 'Gertrude Mary Cox' @ cox.wessa.net \tabularnewline
\hline
\end{tabular}
%Source: https://freestatistics.org/blog/index.php?pk=146500&T=0

[TABLE]
[ROW][C]Summary of computational transaction[/C][/ROW]
[ROW][C]Raw Input[/C][C]view raw input (R code) [/C][/ROW]
[ROW][C]Raw Output[/C][C]view raw output of R engine [/C][/ROW]
[ROW][C]Computing time[/C][C]4 seconds[/C][/ROW]
[ROW][C]R Server[/C][C]'Gertrude Mary Cox' @ cox.wessa.net[/C][/ROW]
[/TABLE]
Source: https://freestatistics.org/blog/index.php?pk=146500&T=0

Globally Unique Identifier (entire table): ba.freestatistics.org/blog/index.php?pk=146500&T=0

As an alternative you can also use a QR Code:  

The GUIDs for individual cells are displayed in the table below:

Summary of computational transaction
Raw Inputview raw input (R code)
Raw Outputview raw output of R engine
Computing time4 seconds
R Server'Gertrude Mary Cox' @ cox.wessa.net


Multiple Linear Regression - Estimated Regression Equation
A[t] = + 15.200730283204 -49.6747421830253B[t] + 1.84891521232438e-07C[t] -0.186433579145411D[t] + e[t]

\begin{tabular}{lllllllll}
\hline
Multiple Linear Regression - Estimated Regression Equation \tabularnewline
A[t] =  +  15.200730283204 -49.6747421830253B[t] +  1.84891521232438e-07C[t] -0.186433579145411D[t]  + e[t] \tabularnewline
\hline
\end{tabular}
%Source: https://freestatistics.org/blog/index.php?pk=146500&T=1

[TABLE]
[ROW][C]Multiple Linear Regression - Estimated Regression Equation[/C][/ROW]
[ROW][C]A[t] =  +  15.200730283204 -49.6747421830253B[t] +  1.84891521232438e-07C[t] -0.186433579145411D[t]  + e[t][/C][/ROW]
[/TABLE]
Source: https://freestatistics.org/blog/index.php?pk=146500&T=1

Globally Unique Identifier (entire table): ba.freestatistics.org/blog/index.php?pk=146500&T=1

As an alternative you can also use a QR Code:  

The GUIDs for individual cells are displayed in the table below:

Multiple Linear Regression - Estimated Regression Equation
A[t] = + 15.200730283204 -49.6747421830253B[t] + 1.84891521232438e-07C[t] -0.186433579145411D[t] + e[t]


Multiple Linear Regression - Ordinary Least Squares
VariableParameterS.D.T-STATH0: parameter = 02-tail p-value1-tail p-value
(Intercept)15.20073028320445.2980880.33560.7470270.373514
B-49.674742183025321.712561-2.28780.0559860.027993
C1.84891521232438e-072e-060.0760.9415160.470758
D-0.1864335791454110.233222-0.79940.4503380.225169

\begin{tabular}{lllllllll}
\hline
Multiple Linear Regression - Ordinary Least Squares \tabularnewline
Variable & Parameter & S.D. & T-STATH0: parameter = 0 & 2-tail p-value & 1-tail p-value \tabularnewline
(Intercept) & 15.200730283204 & 45.298088 & 0.3356 & 0.747027 & 0.373514 \tabularnewline
B & -49.6747421830253 & 21.712561 & -2.2878 & 0.055986 & 0.027993 \tabularnewline
C & 1.84891521232438e-07 & 2e-06 & 0.076 & 0.941516 & 0.470758 \tabularnewline
D & -0.186433579145411 & 0.233222 & -0.7994 & 0.450338 & 0.225169 \tabularnewline
\hline
\end{tabular}
%Source: https://freestatistics.org/blog/index.php?pk=146500&T=2

[TABLE]
[ROW][C]Multiple Linear Regression - Ordinary Least Squares[/C][/ROW]
[ROW][C]Variable[/C][C]Parameter[/C][C]S.D.[/C][C]T-STATH0: parameter = 0[/C][C]2-tail p-value[/C][C]1-tail p-value[/C][/ROW]
[ROW][C](Intercept)[/C][C]15.200730283204[/C][C]45.298088[/C][C]0.3356[/C][C]0.747027[/C][C]0.373514[/C][/ROW]
[ROW][C]B[/C][C]-49.6747421830253[/C][C]21.712561[/C][C]-2.2878[/C][C]0.055986[/C][C]0.027993[/C][/ROW]
[ROW][C]C[/C][C]1.84891521232438e-07[/C][C]2e-06[/C][C]0.076[/C][C]0.941516[/C][C]0.470758[/C][/ROW]
[ROW][C]D[/C][C]-0.186433579145411[/C][C]0.233222[/C][C]-0.7994[/C][C]0.450338[/C][C]0.225169[/C][/ROW]
[/TABLE]
Source: https://freestatistics.org/blog/index.php?pk=146500&T=2

Globally Unique Identifier (entire table): ba.freestatistics.org/blog/index.php?pk=146500&T=2

As an alternative you can also use a QR Code:  

The GUIDs for individual cells are displayed in the table below:

Multiple Linear Regression - Ordinary Least Squares
VariableParameterS.D.T-STATH0: parameter = 02-tail p-value1-tail p-value
(Intercept)15.20073028320445.2980880.33560.7470270.373514
B-49.674742183025321.712561-2.28780.0559860.027993
C1.84891521232438e-072e-060.0760.9415160.470758
D-0.1864335791454110.233222-0.79940.4503380.225169


Multiple Linear Regression - Regression Statistics
Multiple R0.717124663801047
R-squared0.514267783431764
Adjusted R-squared0.306096833473949
F-TEST (value)2.47041089804306
F-TEST (DF numerator)3
F-TEST (DF denominator)7
p-value0.146349062992585
Multiple Linear Regression - Residual Statistics
Residual Standard Deviation0.603937693117851
Sum Squared Residuals2.55318516017958

\begin{tabular}{lllllllll}
\hline
Multiple Linear Regression - Regression Statistics \tabularnewline
Multiple R & 0.717124663801047 \tabularnewline
R-squared & 0.514267783431764 \tabularnewline
Adjusted R-squared & 0.306096833473949 \tabularnewline
F-TEST (value) & 2.47041089804306 \tabularnewline
F-TEST (DF numerator) & 3 \tabularnewline
F-TEST (DF denominator) & 7 \tabularnewline
p-value & 0.146349062992585 \tabularnewline
Multiple Linear Regression - Residual Statistics \tabularnewline
Residual Standard Deviation & 0.603937693117851 \tabularnewline
Sum Squared Residuals & 2.55318516017958 \tabularnewline
\hline
\end{tabular}
%Source: https://freestatistics.org/blog/index.php?pk=146500&T=3

[TABLE]
[ROW][C]Multiple Linear Regression - Regression Statistics[/C][/ROW]
[ROW][C]Multiple R[/C][C]0.717124663801047[/C][/ROW]
[ROW][C]R-squared[/C][C]0.514267783431764[/C][/ROW]
[ROW][C]Adjusted R-squared[/C][C]0.306096833473949[/C][/ROW]
[ROW][C]F-TEST (value)[/C][C]2.47041089804306[/C][/ROW]
[ROW][C]F-TEST (DF numerator)[/C][C]3[/C][/ROW]
[ROW][C]F-TEST (DF denominator)[/C][C]7[/C][/ROW]
[ROW][C]p-value[/C][C]0.146349062992585[/C][/ROW]
[ROW][C]Multiple Linear Regression - Residual Statistics[/C][/ROW]
[ROW][C]Residual Standard Deviation[/C][C]0.603937693117851[/C][/ROW]
[ROW][C]Sum Squared Residuals[/C][C]2.55318516017958[/C][/ROW]
[/TABLE]
Source: https://freestatistics.org/blog/index.php?pk=146500&T=3

Globally Unique Identifier (entire table): ba.freestatistics.org/blog/index.php?pk=146500&T=3

As an alternative you can also use a QR Code:  

The GUIDs for individual cells are displayed in the table below:

Multiple Linear Regression - Regression Statistics
Multiple R0.717124663801047
R-squared0.514267783431764
Adjusted R-squared0.306096833473949
F-TEST (value)2.47041089804306
F-TEST (DF numerator)3
F-TEST (DF denominator)7
p-value0.146349062992585
Multiple Linear Regression - Residual Statistics
Residual Standard Deviation0.603937693117851
Sum Squared Residuals2.55318516017958


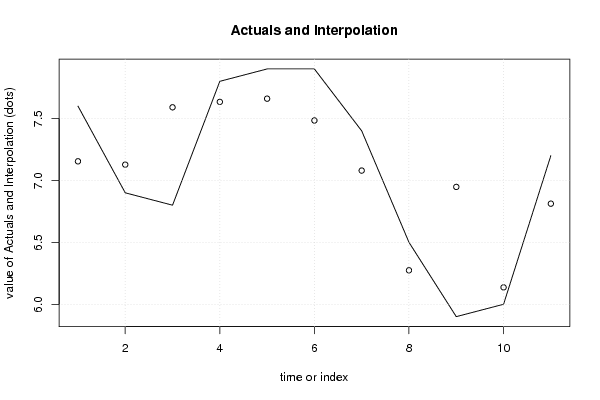
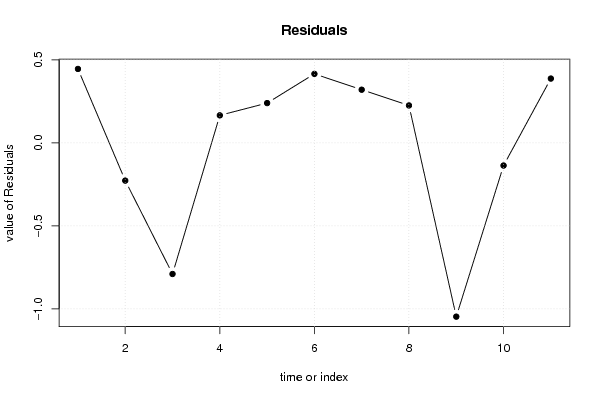
Multiple Linear Regression - Actuals, Interpolation, and Residuals
Time or IndexActualsInterpolationForecastResidualsPrediction Error
17.67.154250981662160.445749018337844
26.97.12746364479812-0.227463644798125
36.87.59032097476052-0.79032097476052
47.87.633995323517690.166004676482307
57.97.660019479728310.239980520271687
67.97.483900269369120.416099730630883
77.47.079479052329630.32052094767037
86.56.274300481671520.225699518328479
95.96.94748064031246-1.04748064031246
1066.1365164407244-0.136516440724403
117.26.812272711126070.387727288873934

\begin{tabular}{lllllllll}
\hline
Multiple Linear Regression - Actuals, Interpolation, and Residuals \tabularnewline
Time or Index & Actuals & InterpolationForecast & ResidualsPrediction Error \tabularnewline
1 & 7.6 & 7.15425098166216 & 0.445749018337844 \tabularnewline
2 & 6.9 & 7.12746364479812 & -0.227463644798125 \tabularnewline
3 & 6.8 & 7.59032097476052 & -0.79032097476052 \tabularnewline
4 & 7.8 & 7.63399532351769 & 0.166004676482307 \tabularnewline
5 & 7.9 & 7.66001947972831 & 0.239980520271687 \tabularnewline
6 & 7.9 & 7.48390026936912 & 0.416099730630883 \tabularnewline
7 & 7.4 & 7.07947905232963 & 0.32052094767037 \tabularnewline
8 & 6.5 & 6.27430048167152 & 0.225699518328479 \tabularnewline
9 & 5.9 & 6.94748064031246 & -1.04748064031246 \tabularnewline
10 & 6 & 6.1365164407244 & -0.136516440724403 \tabularnewline
11 & 7.2 & 6.81227271112607 & 0.387727288873934 \tabularnewline
\hline
\end{tabular}
%Source: https://freestatistics.org/blog/index.php?pk=146500&T=4

[TABLE]
[ROW][C]Multiple Linear Regression - Actuals, Interpolation, and Residuals[/C][/ROW]
[ROW][C]Time or Index[/C][C]Actuals[/C][C]InterpolationForecast[/C][C]ResidualsPrediction Error[/C][/ROW]
[ROW][C]1[/C][C]7.6[/C][C]7.15425098166216[/C][C]0.445749018337844[/C][/ROW]
[ROW][C]2[/C][C]6.9[/C][C]7.12746364479812[/C][C]-0.227463644798125[/C][/ROW]
[ROW][C]3[/C][C]6.8[/C][C]7.59032097476052[/C][C]-0.79032097476052[/C][/ROW]
[ROW][C]4[/C][C]7.8[/C][C]7.63399532351769[/C][C]0.166004676482307[/C][/ROW]
[ROW][C]5[/C][C]7.9[/C][C]7.66001947972831[/C][C]0.239980520271687[/C][/ROW]
[ROW][C]6[/C][C]7.9[/C][C]7.48390026936912[/C][C]0.416099730630883[/C][/ROW]
[ROW][C]7[/C][C]7.4[/C][C]7.07947905232963[/C][C]0.32052094767037[/C][/ROW]
[ROW][C]8[/C][C]6.5[/C][C]6.27430048167152[/C][C]0.225699518328479[/C][/ROW]
[ROW][C]9[/C][C]5.9[/C][C]6.94748064031246[/C][C]-1.04748064031246[/C][/ROW]
[ROW][C]10[/C][C]6[/C][C]6.1365164407244[/C][C]-0.136516440724403[/C][/ROW]
[ROW][C]11[/C][C]7.2[/C][C]6.81227271112607[/C][C]0.387727288873934[/C][/ROW]
[/TABLE]
Source: https://freestatistics.org/blog/index.php?pk=146500&T=4

Globally Unique Identifier (entire table): ba.freestatistics.org/blog/index.php?pk=146500&T=4

As an alternative you can also use a QR Code:  

The GUIDs for individual cells are displayed in the table below:

Multiple Linear Regression - Actuals, Interpolation, and Residuals
Time or IndexActualsInterpolationForecastResidualsPrediction Error
17.67.154250981662160.445749018337844
26.97.12746364479812-0.227463644798125
36.87.59032097476052-0.79032097476052
47.87.633995323517690.166004676482307
57.97.660019479728310.239980520271687
67.97.483900269369120.416099730630883
77.47.079479052329630.32052094767037
86.56.274300481671520.225699518328479
95.96.94748064031246-1.04748064031246
1066.1365164407244-0.136516440724403
117.26.812272711126070.387727288873934


Parameters (Session):
par1 = 1 ; par2 = Do not include Seasonal Dummies ; par3 = No Linear Trend ;
Parameters (R input):
par1 = 1 ; par2 = Do not include Seasonal Dummies ; par3 = No Linear Trend ;
R code (references can be found in the software module):
library(lattice)
library(lmtest)
n25 <- 25 #minimum number of obs. for Goldfeld-Quandt test
par1 <- as.numeric(par1)
x <- t(y)
k <- length(x[1,])
n <- length(x[,1])
x1 <- cbind(x[,par1], x[,1:k!=par1])
mycolnames <- c(colnames(x)[par1], colnames(x)[1:k!=par1])
colnames(x1) <- mycolnames #colnames(x)[par1]
x <- x1
if (par3 == 'First Differences'){
x2 <- array(0, dim=c(n-1,k), dimnames=list(1:(n-1), paste('(1-B)',colnames(x),sep='')))
for (i in 1:n-1) {
for (j in 1:k) {
x2[i,j] <- x[i+1,j] - x[i,j]
}
}
x <- x2
}
if (par2 == 'Include Monthly Dummies'){
x2 <- array(0, dim=c(n,11), dimnames=list(1:n, paste('M', seq(1:11), sep ='')))
for (i in 1:11){
x2[seq(i,n,12),i] <- 1
}
x <- cbind(x, x2)
}
if (par2 == 'Include Quarterly Dummies'){
x2 <- array(0, dim=c(n,3), dimnames=list(1:n, paste('Q', seq(1:3), sep ='')))
for (i in 1:3){
x2[seq(i,n,4),i] <- 1
}
x <- cbind(x, x2)
}
k <- length(x[1,])
if (par3 == 'Linear Trend'){
x <- cbind(x, c(1:n))
colnames(x)[k+1] <- 't'
}
x
k <- length(x[1,])
df <- as.data.frame(x)
(mylm <- lm(df))
(mysum <- summary(mylm))
if (n > n25) {
kp3 <- k + 3
nmkm3 <- n - k - 3
gqarr <- array(NA, dim=c(nmkm3-kp3+1,3))
numgqtests <- 0
numsignificant1 <- 0
numsignificant5 <- 0
numsignificant10 <- 0
for (mypoint in kp3:nmkm3) {
j <- 0
numgqtests <- numgqtests + 1
for (myalt in c('greater', 'two.sided', 'less')) {
j <- j + 1
gqarr[mypoint-kp3+1,j] <- gqtest(mylm, point=mypoint, alternative=myalt)$p.value
}
if (gqarr[mypoint-kp3+1,2] < 0.01) numsignificant1 <- numsignificant1 + 1
if (gqarr[mypoint-kp3+1,2] < 0.05) numsignificant5 <- numsignificant5 + 1
if (gqarr[mypoint-kp3+1,2] < 0.10) numsignificant10 <- numsignificant10 + 1
}
gqarr
}
bitmap(file='test0.png')
plot(x[,1], type='l', main='Actuals and Interpolation', ylab='value of Actuals and Interpolation (dots)', xlab='time or index')
points(x[,1]-mysum$resid)
grid()
dev.off()
bitmap(file='test1.png')
plot(mysum$resid, type='b', pch=19, main='Residuals', ylab='value of Residuals', xlab='time or index')
grid()
dev.off()
bitmap(file='test2.png')
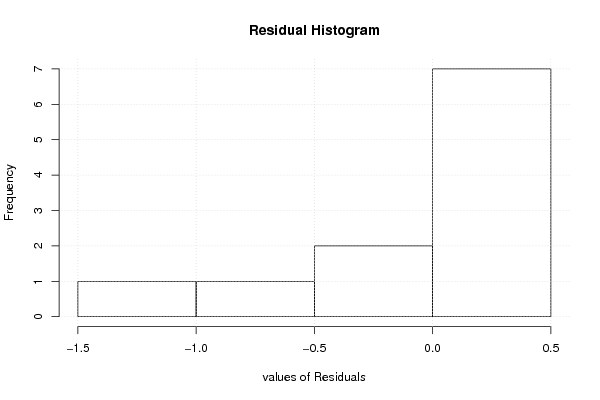
hist(mysum$resid, main='Residual Histogram', xlab='values of Residuals')
grid()
dev.off()
bitmap(file='test3.png')
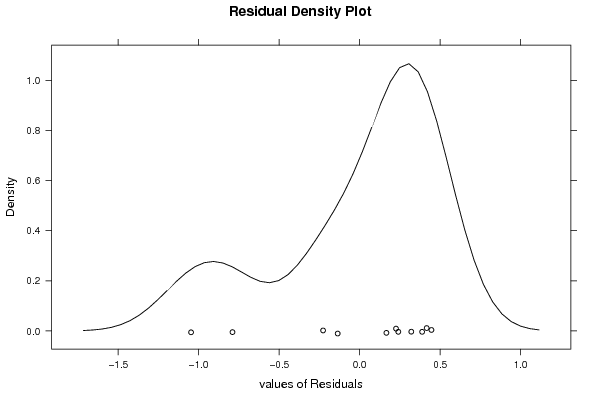
densityplot(~mysum$resid,col='black',main='Residual Density Plot', xlab='values of Residuals')
dev.off()
bitmap(file='test4.png')
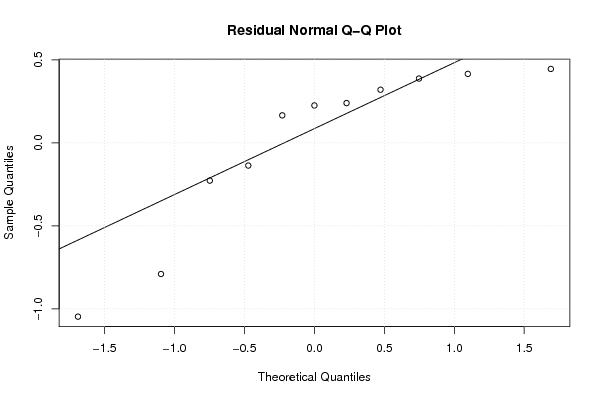
qqnorm(mysum$resid, main='Residual Normal Q-Q Plot')
qqline(mysum$resid)
grid()
dev.off()
(myerror <- as.ts(mysum$resid))
bitmap(file='test5.png')
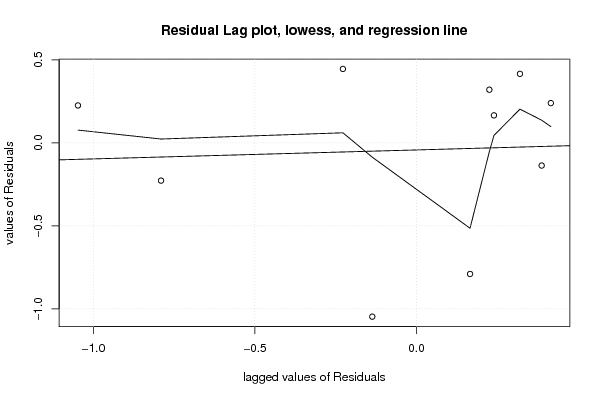
dum <- cbind(lag(myerror,k=1),myerror)
dum
dum1 <- dum[2:length(myerror),]
dum1
z <- as.data.frame(dum1)
z
plot(z,main=paste('Residual Lag plot, lowess, and regression line'), ylab='values of Residuals', xlab='lagged values of Residuals')
lines(lowess(z))
abline(lm(z))
grid()
dev.off()
bitmap(file='test6.png')
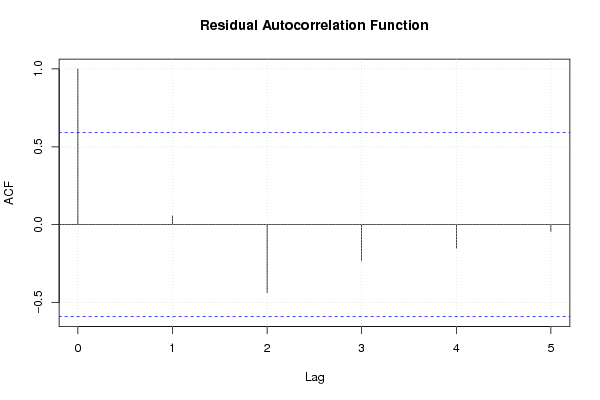
acf(mysum$resid, lag.max=length(mysum$resid)/2, main='Residual Autocorrelation Function')
grid()
dev.off()
bitmap(file='test7.png')
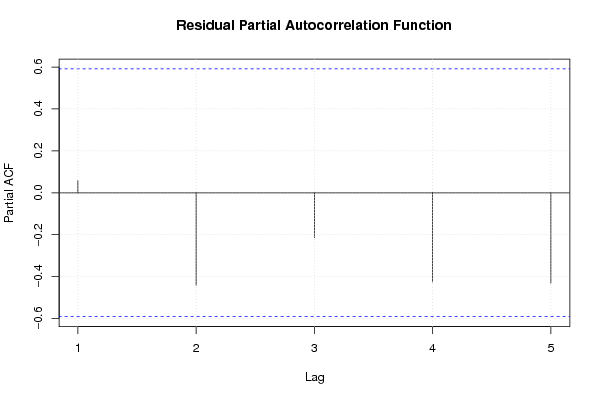
pacf(mysum$resid, lag.max=length(mysum$resid)/2, main='Residual Partial Autocorrelation Function')
grid()
dev.off()
bitmap(file='test8.png')
opar <- par(mfrow = c(2,2), oma = c(0, 0, 1.1, 0))
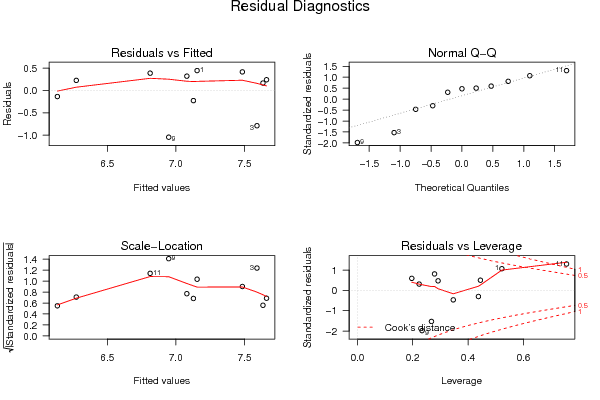
plot(mylm, las = 1, sub='Residual Diagnostics')
par(opar)
dev.off()
if (n > n25) {
bitmap(file='test9.png')
plot(kp3:nmkm3,gqarr[,2], main='Goldfeld-Quandt test',ylab='2-sided p-value',xlab='breakpoint')
grid()
dev.off()
}
load(file='createtable')
a<-table.start()
a<-table.row.start(a)
a<-table.element(a, 'Multiple Linear Regression - Estimated Regression Equation', 1, TRUE)
a<-table.row.end(a)
myeq <- colnames(x)[1]
myeq <- paste(myeq, '[t] = ', sep='')
for (i in 1:k){
if (mysum$coefficients[i,1] > 0) myeq <- paste(myeq, '+', '')
myeq <- paste(myeq, mysum$coefficients[i,1], sep=' ')
if (rownames(mysum$coefficients)[i] != '(Intercept)') {
myeq <- paste(myeq, rownames(mysum$coefficients)[i], sep='')
if (rownames(mysum$coefficients)[i] != 't') myeq <- paste(myeq, '[t]', sep='')
}
}
myeq <- paste(myeq, ' + e[t]')
a<-table.row.start(a)
a<-table.element(a, myeq)
a<-table.row.end(a)
a<-table.end(a)
table.save(a,file='mytable1.tab')
a<-table.start()
a<-table.row.start(a)
a<-table.element(a,hyperlink('ols1.htm','Multiple Linear Regression - Ordinary Least Squares',''), 6, TRUE)
a<-table.row.end(a)
a<-table.row.start(a)
a<-table.element(a,'Variable',header=TRUE)
a<-table.element(a,'Parameter',header=TRUE)
a<-table.element(a,'S.D.',header=TRUE)
a<-table.element(a,'T-STAT
H0: parameter = 0',header=TRUE)
a<-table.element(a,'2-tail p-value',header=TRUE)
a<-table.element(a,'1-tail p-value',header=TRUE)
a<-table.row.end(a)
for (i in 1:k){
a<-table.row.start(a)
a<-table.element(a,rownames(mysum$coefficients)[i],header=TRUE)
a<-table.element(a,mysum$coefficients[i,1])
a<-table.element(a, round(mysum$coefficients[i,2],6))
a<-table.element(a, round(mysum$coefficients[i,3],4))
a<-table.element(a, round(mysum$coefficients[i,4],6))
a<-table.element(a, round(mysum$coefficients[i,4]/2,6))
a<-table.row.end(a)
}
a<-table.end(a)
table.save(a,file='mytable2.tab')
a<-table.start()
a<-table.row.start(a)
a<-table.element(a, 'Multiple Linear Regression - Regression Statistics', 2, TRUE)
a<-table.row.end(a)
a<-table.row.start(a)
a<-table.element(a, 'Multiple R',1,TRUE)
a<-table.element(a, sqrt(mysum$r.squared))
a<-table.row.end(a)
a<-table.row.start(a)
a<-table.element(a, 'R-squared',1,TRUE)
a<-table.element(a, mysum$r.squared)
a<-table.row.end(a)
a<-table.row.start(a)
a<-table.element(a, 'Adjusted R-squared',1,TRUE)
a<-table.element(a, mysum$adj.r.squared)
a<-table.row.end(a)
a<-table.row.start(a)
a<-table.element(a, 'F-TEST (value)',1,TRUE)
a<-table.element(a, mysum$fstatistic[1])
a<-table.row.end(a)
a<-table.row.start(a)
a<-table.element(a, 'F-TEST (DF numerator)',1,TRUE)
a<-table.element(a, mysum$fstatistic[2])
a<-table.row.end(a)
a<-table.row.start(a)
a<-table.element(a, 'F-TEST (DF denominator)',1,TRUE)
a<-table.element(a, mysum$fstatistic[3])
a<-table.row.end(a)
a<-table.row.start(a)
a<-table.element(a, 'p-value',1,TRUE)
a<-table.element(a, 1-pf(mysum$fstatistic[1],mysum$fstatistic[2],mysum$fstatistic[3]))
a<-table.row.end(a)
a<-table.row.start(a)
a<-table.element(a, 'Multiple Linear Regression - Residual Statistics', 2, TRUE)
a<-table.row.end(a)
a<-table.row.start(a)
a<-table.element(a, 'Residual Standard Deviation',1,TRUE)
a<-table.element(a, mysum$sigma)
a<-table.row.end(a)
a<-table.row.start(a)
a<-table.element(a, 'Sum Squared Residuals',1,TRUE)
a<-table.element(a, sum(myerror*myerror))
a<-table.row.end(a)
a<-table.end(a)
table.save(a,file='mytable3.tab')
a<-table.start()
a<-table.row.start(a)
a<-table.element(a, 'Multiple Linear Regression - Actuals, Interpolation, and Residuals', 4, TRUE)
a<-table.row.end(a)
a<-table.row.start(a)
a<-table.element(a, 'Time or Index', 1, TRUE)
a<-table.element(a, 'Actuals', 1, TRUE)
a<-table.element(a, 'Interpolation
Forecast', 1, TRUE)
a<-table.element(a, 'Residuals
Prediction Error', 1, TRUE)
a<-table.row.end(a)
for (i in 1:n) {
a<-table.row.start(a)
a<-table.element(a,i, 1, TRUE)
a<-table.element(a,x[i])
a<-table.element(a,x[i]-mysum$resid[i])
a<-table.element(a,mysum$resid[i])
a<-table.row.end(a)
}
a<-table.end(a)
table.save(a,file='mytable4.tab')
if (n > n25) {
a<-table.start()
a<-table.row.start(a)
a<-table.element(a,'Goldfeld-Quandt test for Heteroskedasticity',4,TRUE)
a<-table.row.end(a)
a<-table.row.start(a)
a<-table.element(a,'p-values',header=TRUE)
a<-table.element(a,'Alternative Hypothesis',3,header=TRUE)
a<-table.row.end(a)
a<-table.row.start(a)
a<-table.element(a,'breakpoint index',header=TRUE)
a<-table.element(a,'greater',header=TRUE)
a<-table.element(a,'2-sided',header=TRUE)
a<-table.element(a,'less',header=TRUE)
a<-table.row.end(a)
for (mypoint in kp3:nmkm3) {
a<-table.row.start(a)
a<-table.element(a,mypoint,header=TRUE)
a<-table.element(a,gqarr[mypoint-kp3+1,1])
a<-table.element(a,gqarr[mypoint-kp3+1,2])
a<-table.element(a,gqarr[mypoint-kp3+1,3])
a<-table.row.end(a)
}
a<-table.end(a)
table.save(a,file='mytable5.tab')
a<-table.start()
a<-table.row.start(a)
a<-table.element(a,'Meta Analysis of Goldfeld-Quandt test for Heteroskedasticity',4,TRUE)
a<-table.row.end(a)
a<-table.row.start(a)
a<-table.element(a,'Description',header=TRUE)
a<-table.element(a,'# significant tests',header=TRUE)
a<-table.element(a,'% significant tests',header=TRUE)
a<-table.element(a,'OK/NOK',header=TRUE)
a<-table.row.end(a)
a<-table.row.start(a)
a<-table.element(a,'1% type I error level',header=TRUE)
a<-table.element(a,numsignificant1)
a<-table.element(a,numsignificant1/numgqtests)
if (numsignificant1/numgqtests < 0.01) dum <- 'OK' else dum <- 'NOK'
a<-table.element(a,dum)
a<-table.row.end(a)
a<-table.row.start(a)
a<-table.element(a,'5% type I error level',header=TRUE)
a<-table.element(a,numsignificant5)
a<-table.element(a,numsignificant5/numgqtests)
if (numsignificant5/numgqtests < 0.05) dum <- 'OK' else dum <- 'NOK'
a<-table.element(a,dum)
a<-table.row.end(a)
a<-table.row.start(a)
a<-table.element(a,'10% type I error level',header=TRUE)
a<-table.element(a,numsignificant10)
a<-table.element(a,numsignificant10/numgqtests)
if (numsignificant10/numgqtests < 0.1) dum <- 'OK' else dum <- 'NOK'
a<-table.element(a,dum)
a<-table.row.end(a)
a<-table.end(a)
table.save(a,file='mytable6.tab')
}