| Multiple Linear Regression - Estimated Regression Equation |
| huwelijk[t] = + 26.730851184123 + 2.32142759418004sterfte[t] + 0.00238820428522613Unemployment[t] + e[t] |
| Multiple Linear Regression - Ordinary Least Squares | |||||
| Variable | Parameter | S.D. | T-STAT H0: parameter = 0 | 2-tail p-value | 1-tail p-value |
| (Intercept) | 26.730851184123 | 3.301468 | 8.0967 | 0 | 0 |
| sterfte | 2.32142759418004 | 0.16487 | 14.0804 | 0 | 0 |
| Unemployment | 0.00238820428522613 | 0.001923 | 1.2418 | 0.221044 | 0.110522 |
| Multiple Linear Regression - Regression Statistics | |
| Multiple R | 0.953261498072241 |
| R-squared | 0.908707483706932 |
| Adjusted R-squared | 0.904461320158418 |
| F-TEST (value) | 214.006708249564 |
| F-TEST (DF numerator) | 2 |
| F-TEST (DF denominator) | 43 |
| p-value | 0 |
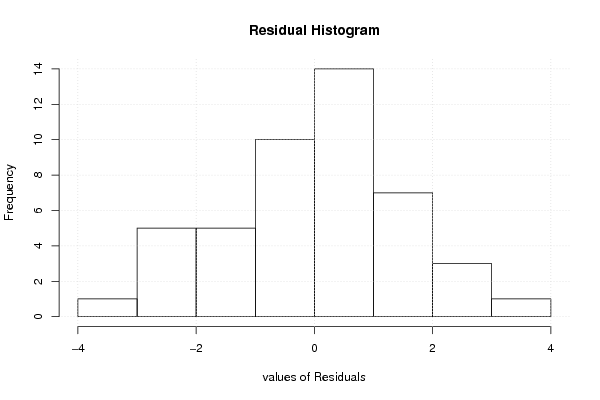
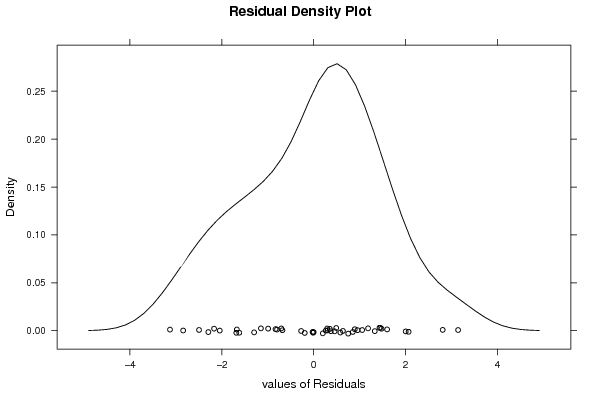
| Multiple Linear Regression - Residual Statistics | |
| Residual Standard Deviation | 1.50074737540032 |
| Sum Squared Residuals | 96.8464354451505 |
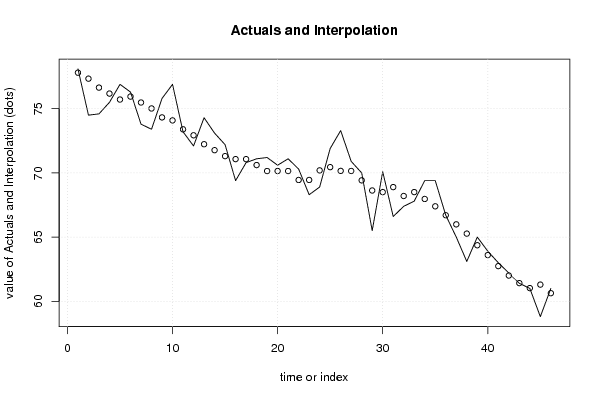
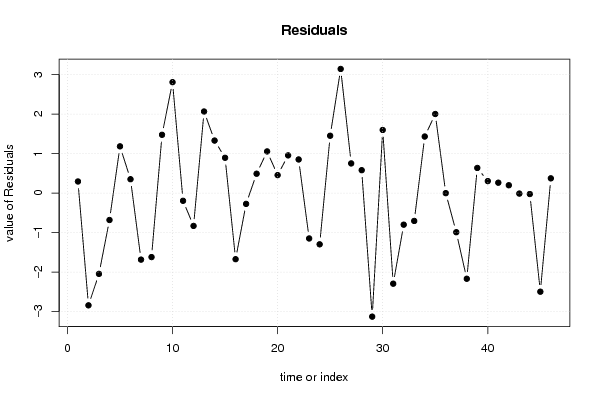
| Multiple Linear Regression - Actuals, Interpolation, and Residuals | |||
| Time or Index | Actuals | Interpolation Forecast | Residuals Prediction Error |
| 1 | 78.1 | 77.8065570237973 | 0.293442976202713 |
| 2 | 74.5 | 77.3422715049612 | -2.84227150496124 |
| 3 | 74.6 | 76.6458432267072 | -2.04584322670724 |
| 4 | 75.5 | 76.1815577078712 | -0.681557707871224 |
| 5 | 76.9 | 75.7172721890352 | 1.18272781096479 |
| 6 | 76.3 | 75.9494149484532 | 0.35058505154678 |
| 7 | 73.8 | 75.4851294296172 | -1.68512942961721 |
| 8 | 73.4 | 75.0208439107812 | -1.6208439107812 |
| 9 | 75.8 | 74.3244156325272 | 1.47558436747281 |
| 10 | 76.9 | 74.0922728731092 | 2.80772712689082 |
| 11 | 73.2 | 73.3958445948552 | -0.195844594855178 |
| 12 | 72.1 | 72.9315590760192 | -0.831559076019172 |
| 13 | 74.3 | 72.2351307977652 | 2.06486920223483 |
| 14 | 73.1 | 71.7708452789291 | 1.32915472107085 |
| 15 | 72.2 | 71.3065597600931 | 0.893440239906861 |
| 16 | 69.4 | 71.0744170006751 | -1.67441700067514 |
| 17 | 70.8 | 71.0744170006751 | -0.274417000675146 |
| 18 | 71.1 | 70.6101314818391 | 0.489868518160865 |
| 19 | 71.2 | 70.1458459630031 | 1.05415403699688 |
| 20 | 70.6 | 70.1458459630031 | 0.454154036996871 |
| 21 | 71.1 | 70.1458459630031 | 0.954154036996871 |
| 22 | 70.3 | 69.4494176847491 | 0.850582315250887 |
| 23 | 68.3 | 69.4494176847491 | -1.14941768474911 |
| 24 | 68.9 | 70.1976327844164 | -1.29763278441643 |
| 25 | 71.9 | 70.4488811781163 | 1.45111882188376 |
| 26 | 73.3 | 70.1575109524246 | 3.14248904757536 |
| 27 | 70.9 | 70.1493910578549 | 0.750608942145135 |
| 28 | 70 | 69.4207220217503 | 0.579277978249695 |
| 29 | 65.5 | 68.6290043925158 | -3.12900439251577 |
| 30 | 70.1 | 68.5026683858273 | 1.59733161417269 |
| 31 | 66.6 | 68.8941136739639 | -2.29411367396392 |
| 32 | 67.4 | 68.2003124204237 | -0.800312420423654 |
| 33 | 67.8 | 68.5057730513981 | -0.705773051398104 |
| 34 | 69.4 | 67.9688768193972 | 1.43112318060281 |
| 35 | 69.4 | 67.3978292661176 | 2.00217073388245 |
| 36 | 66.7 | 66.7021174491491 | -0.00211744914911364 |
| 37 | 65 | 65.9913599451837 | -0.991359945183747 |
| 38 | 63.1 | 65.2696167015063 | -2.16961670150634 |
| 39 | 65 | 64.3639724249725 | 0.636027575027504 |
| 40 | 63.9 | 63.5973309407328 | 0.302669059267163 |
| 41 | 63 | 62.7375494893694 | 0.262450510630645 |
| 42 | 62.2 | 62.0021934812662 | 0.197806518733843 |
| 43 | 61.4 | 61.4132343958473 | -0.0132343958473237 |
| 44 | 61 | 61.024654952853 | -0.0246549528529858 |
| 45 | 58.8 | 61.2969195442628 | -2.49691954426279 |
| 46 | 61 | 60.6274779744318 | 0.37252202556817 |
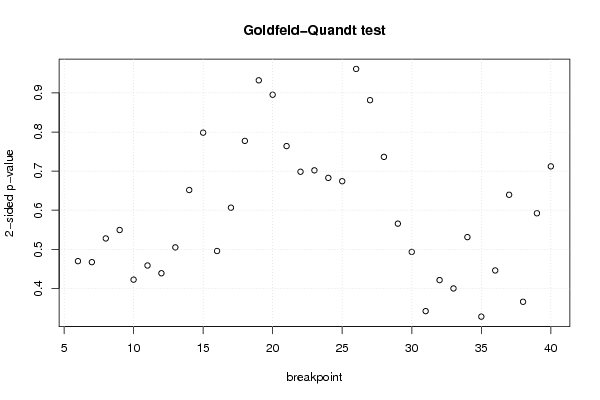
| Goldfeld-Quandt test for Heteroskedasticity | |||
| p-values | Alternative Hypothesis | ||
| breakpoint index | greater | 2-sided | less |
| 6 | 0.765113263232268 | 0.469773473535464 | 0.234886736767732 |
| 7 | 0.766414414388027 | 0.467171171223947 | 0.233585585611973 |
| 8 | 0.736083077935399 | 0.527833844129203 | 0.263916922064601 |
| 9 | 0.725309433744292 | 0.549381132511415 | 0.274690566255708 |
| 10 | 0.788797784846447 | 0.422404430307106 | 0.211202215153553 |
| 11 | 0.770682076484824 | 0.458635847030352 | 0.229317923515176 |
| 12 | 0.780606586072453 | 0.438786827855094 | 0.219393413927547 |
| 13 | 0.747513964936507 | 0.504972070126985 | 0.252486035063492 |
| 14 | 0.674176855779049 | 0.651646288441903 | 0.325823144220951 |
| 15 | 0.600835895015032 | 0.798328209969935 | 0.399164104984968 |
| 16 | 0.752155070238194 | 0.495689859523611 | 0.247844929761806 |
| 17 | 0.696764872864282 | 0.606470254271436 | 0.303235127135718 |
| 18 | 0.611382024598311 | 0.777235950803377 | 0.388617975401689 |
| 19 | 0.533914751060244 | 0.932170497879512 | 0.466085248939756 |
| 20 | 0.447637965238239 | 0.895275930476478 | 0.552362034761761 |
| 21 | 0.381987726841483 | 0.763975453682966 | 0.618012273158517 |
| 22 | 0.349189789445272 | 0.698379578890543 | 0.650810210554728 |
| 23 | 0.350994862261311 | 0.701989724522621 | 0.649005137738689 |
| 24 | 0.341323698544163 | 0.682647397088326 | 0.658676301455837 |
| 25 | 0.33706729050167 | 0.674134581003339 | 0.66293270949833 |
| 26 | 0.519378639266364 | 0.961242721467273 | 0.480621360733636 |
| 27 | 0.440697079595278 | 0.881394159190556 | 0.559302920404722 |
| 28 | 0.368160074479921 | 0.736320148959841 | 0.63183992552008 |
| 29 | 0.717177558468176 | 0.565644883063647 | 0.282822441531824 |
| 30 | 0.753318923581469 | 0.493362152837061 | 0.246681076418531 |
| 31 | 0.829030313068478 | 0.341939373863044 | 0.170969686931522 |
| 32 | 0.78933289401259 | 0.42133421197482 | 0.21066710598741 |
| 33 | 0.80001473825616 | 0.39997052348768 | 0.19998526174384 |
| 34 | 0.734418120846306 | 0.531163758307387 | 0.265581879153694 |
| 35 | 0.836103480343422 | 0.327793039313157 | 0.163896519656579 |
| 36 | 0.777026464531212 | 0.445947070937576 | 0.222973535468788 |
| 37 | 0.680266617619213 | 0.639466764761575 | 0.319733382380787 |
| 38 | 0.817090165875644 | 0.365819668248713 | 0.182909834124356 |
| 39 | 0.703890944682293 | 0.592218110635414 | 0.296109055317707 |
| 40 | 0.643928378453505 | 0.71214324309299 | 0.356071621546495 |
| Meta Analysis of Goldfeld-Quandt test for Heteroskedasticity | |||
| Description | # significant tests | % significant tests | OK/NOK |
| 1% type I error level | 0 | 0 | OK |
| 5% type I error level | 0 | 0 | OK |
| 10% type I error level | 0 | 0 | OK |