| Multiple Linear Regression - Estimated Regression Equation |
| Fertility[t] = -1.28939197575677 -0.000161370275758072Unemployment[t] + 0.0292532045790361Deaths[t] + e[t] |
| Multiple Linear Regression - Ordinary Least Squares | |||||
| Variable | Parameter | S.D. | T-STAT H0: parameter = 0 | 2-tail p-value | 1-tail p-value |
| (Intercept) | -1.28939197575677 | 0.922319 | -1.398 | 0.168543 | 0.084272 |
| Unemployment | -0.000161370275758072 | 0.000923 | -0.1749 | 0.8619 | 0.43095 |
| Deaths | 0.0292532045790361 | 0.007732 | 3.7832 | 0.00043 | 0.000215 |
| Multiple Linear Regression - Regression Statistics | |
| Multiple R | 0.480347389560815 |
| R-squared | 0.230733614657889 |
| Adjusted R-squared | 0.198680848601968 |
| F-TEST (value) | 7.19855547740676 |
| F-TEST (DF numerator) | 2 |
| F-TEST (DF denominator) | 48 |
| p-value | 0.00184434486684115 |
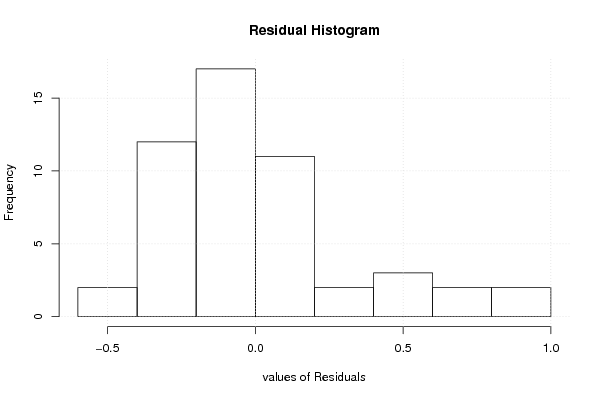
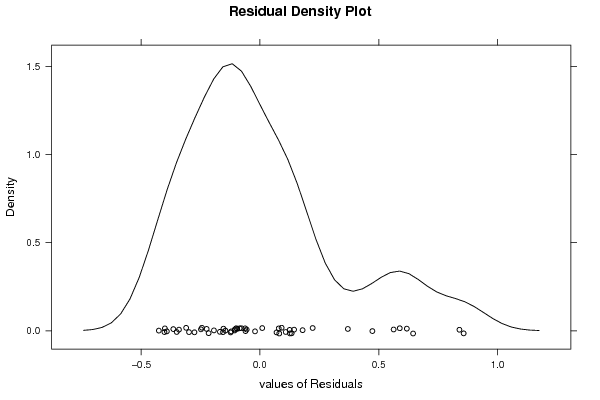
| Multiple Linear Regression - Residual Statistics | |
| Residual Standard Deviation | 0.328730916253266 |
| Sum Squared Residuals | 5.18707273443416 |
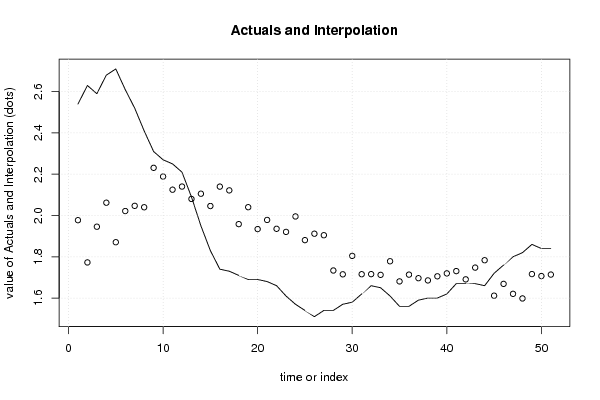
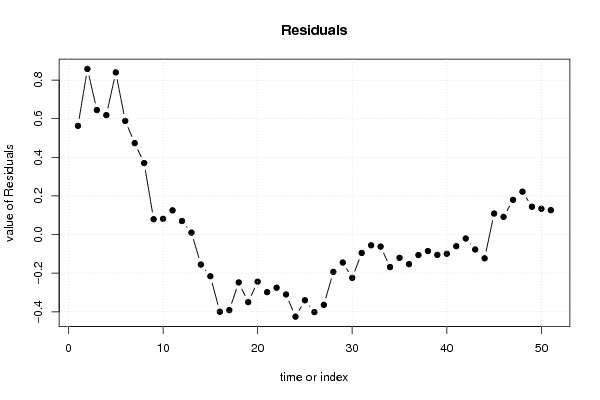
| Multiple Linear Regression - Actuals, Interpolation, and Residuals | |||
| Time or Index | Actuals | Interpolation Forecast | Residuals Prediction Error |
| 1 | 2.54 | 1.97741714937076 | 0.562582850629238 |
| 2 | 2.63 | 1.77272865572666 | 0.857271344273339 |
| 3 | 2.59 | 1.94560938860024 | 0.644390611399763 |
| 4 | 2.68 | 2.0620007376708 | 0.617999262329203 |
| 5 | 2.71 | 1.87058152848947 | 0.83941847151053 |
| 6 | 2.61 | 2.02167729913555 | 0.588322700864449 |
| 7 | 2.52 | 2.04682960692405 | 0.473170393075955 |
| 8 | 2.41 | 2.04002086529847 | 0.369979134701527 |
| 9 | 2.31 | 2.2309252903054 | 0.0790747096945969 |
| 10 | 2.27 | 2.18873189341052 | 0.0812681065894826 |
| 11 | 2.25 | 2.12497480549724 | 0.125025194502756 |
| 12 | 2.21 | 2.14022721493354 | 0.0697727850664566 |
| 13 | 2.09 | 2.08029749407753 | 0.00970250592247082 |
| 14 | 1.95 | 2.10554587553268 | -0.155545875532677 |
| 15 | 1.83 | 2.04597093686263 | -0.215970936862632 |
| 16 | 1.74 | 2.13996274837049 | -0.399962748370487 |
| 17 | 1.73 | 2.12177252208781 | -0.39177252208781 |
| 18 | 1.71 | 1.9581978708174 | -0.248197870817395 |
| 19 | 1.69 | 2.04027990994891 | -0.350279909948914 |
| 20 | 1.69 | 1.93420092247182 | -0.244200922471817 |
| 21 | 1.68 | 1.9784648940597 | -0.298464894059699 |
| 22 | 1.66 | 1.93561847674453 | -0.275618476744525 |
| 23 | 1.61 | 1.920484784545 | -0.310484784544998 |
| 24 | 1.57 | 1.99538068253172 | -0.425380682531718 |
| 25 | 1.54 | 1.88073355258189 | -0.340733552581888 |
| 26 | 1.51 | 1.9117947496563 | -0.401794749656297 |
| 27 | 1.54 | 1.90447429656211 | -0.364474296562114 |
| 28 | 1.54 | 1.73356158379069 | -0.193561583790691 |
| 29 | 1.57 | 1.71516428710584 | -0.145164287105836 |
| 30 | 1.58 | 1.804410366127 | -0.224410366126999 |
| 31 | 1.62 | 1.71554638565723 | -0.0955463856572299 |
| 32 | 1.66 | 1.7159246892409 | -0.0559246892408981 |
| 33 | 1.65 | 1.71246253520866 | -0.0624625352086562 |
| 34 | 1.61 | 1.77844340960341 | -0.168443409603407 |
| 35 | 1.56 | 1.68086620897837 | -0.120866208978365 |
| 36 | 1.56 | 1.71355213381958 | -0.153552133819579 |
| 37 | 1.59 | 1.69632486222597 | -0.106324862225967 |
| 38 | 1.6 | 1.68563202840749 | -0.085632028407491 |
| 39 | 1.6 | 1.70549621951207 | -0.105496219512068 |
| 40 | 1.62 | 1.71963078428923 | -0.0996307842892257 |
| 41 | 1.67 | 1.7306392579465 | -0.0606392579464992 |
| 42 | 1.67 | 1.69067692757428 | -0.0206769275742791 |
| 43 | 1.67 | 1.74762604921615 | -0.0776260492161499 |
| 44 | 1.66 | 1.78337733827153 | -0.123377338271533 |
| 45 | 1.72 | 1.61149503555823 | 0.108504964441769 |
| 46 | 1.76 | 1.66882153110098 | 0.091178468899024 |
| 47 | 1.8 | 1.62051622814328 | 0.179483771856716 |
| 48 | 1.82 | 1.59821338341725 | 0.221786616582747 |
| 49 | 1.86 | 1.71631208161314 | 0.143687918386856 |
| 50 | 1.84 | 1.70657502491596 | 0.133424975084044 |
| 51 | 1.84 | 1.71382749606308 | 0.12617250393692 |
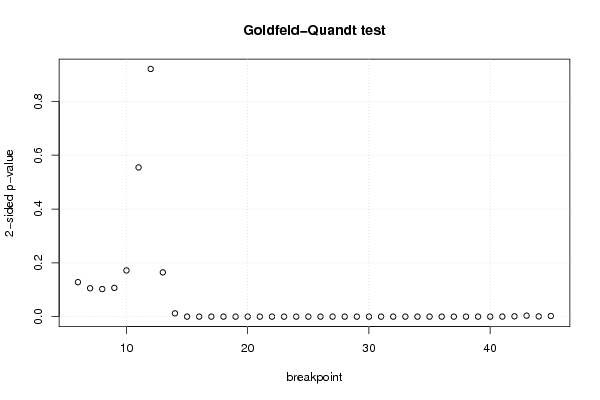
| Goldfeld-Quandt test for Heteroskedasticity | |||
| p-values | Alternative Hypothesis | ||
| breakpoint index | greater | 2-sided | less |
| 6 | 0.064122376047037 | 0.128244752094074 | 0.935877623952963 |
| 7 | 0.0527567291787215 | 0.105513458357443 | 0.947243270821279 |
| 8 | 0.051243186632942 | 0.102486373265884 | 0.948756813367058 |
| 9 | 0.0534714175881916 | 0.106942835176383 | 0.946528582411808 |
| 10 | 0.0859569297001921 | 0.171913859400384 | 0.914043070299808 |
| 11 | 0.277300084909644 | 0.554600169819289 | 0.722699915090356 |
| 12 | 0.539723038290673 | 0.920553923418654 | 0.460276961709327 |
| 13 | 0.917676383787405 | 0.164647232425191 | 0.0823236162125953 |
| 14 | 0.993872119045893 | 0.0122557619082146 | 0.00612788095410732 |
| 15 | 0.999939542769433 | 0.000120914461133127 | 6.04572305665634e-05 |
| 16 | 0.999986311763128 | 2.7376473744361e-05 | 1.36882368721805e-05 |
| 17 | 0.999998169063246 | 3.66187350819578e-06 | 1.83093675409789e-06 |
| 18 | 0.999999995926298 | 8.14740421123241e-09 | 4.0737021056162e-09 |
| 19 | 0.999999999348314 | 1.30337296506899e-09 | 6.51686482534497e-10 |
| 20 | 0.999999999854762 | 2.90475507565909e-10 | 1.45237753782955e-10 |
| 21 | 0.999999999943267 | 1.13466352621954e-10 | 5.67331763109768e-11 |
| 22 | 0.999999999967069 | 6.58623491016893e-11 | 3.29311745508446e-11 |
| 23 | 0.999999999964021 | 7.19588513374894e-11 | 3.59794256687447e-11 |
| 24 | 0.999999999961226 | 7.75486168406768e-11 | 3.87743084203384e-11 |
| 25 | 0.99999999991584 | 1.68320396300625e-10 | 8.41601981503123e-11 |
| 26 | 0.999999999794871 | 4.10257406178894e-10 | 2.05128703089447e-10 |
| 27 | 0.999999999432543 | 1.13491476454359e-09 | 5.67457382271794e-10 |
| 28 | 0.999999998845502 | 2.30899556777467e-09 | 1.15449778388733e-09 |
| 29 | 0.999999997175317 | 5.64936680317817e-09 | 2.82468340158908e-09 |
| 30 | 0.999999988981908 | 2.20361846864972e-08 | 1.10180923432486e-08 |
| 31 | 0.999999962257055 | 7.54858891086456e-08 | 3.77429445543228e-08 |
| 32 | 0.999999853892005 | 2.92215989446888e-07 | 1.46107994723444e-07 |
| 33 | 0.999999512798335 | 9.74403330575211e-07 | 4.87201665287605e-07 |
| 34 | 0.999998114615214 | 3.7707695729019e-06 | 1.88538478645095e-06 |
| 35 | 0.999996287388225 | 7.42522354941372e-06 | 3.71261177470686e-06 |
| 36 | 0.999992405312363 | 1.5189375273525e-05 | 7.59468763676252e-06 |
| 37 | 0.999985175052078 | 2.96498958444454e-05 | 1.48249479222227e-05 |
| 38 | 0.999977041245276 | 4.59175094479024e-05 | 2.29587547239512e-05 |
| 39 | 0.999977007307868 | 4.5985384264341e-05 | 2.29926921321705e-05 |
| 40 | 0.999970901817523 | 5.81963649535563e-05 | 2.90981824767782e-05 |
| 41 | 0.999853315720936 | 0.000293368558127566 | 0.000146684279063783 |
| 42 | 0.999358760890132 | 0.00128247821973646 | 0.000641239109868232 |
| 43 | 0.998201601372847 | 0.0035967972543069 | 0.00179839862715345 |
| 44 | 0.999564935491935 | 0.000870129016130109 | 0.000435064508065054 |
| 45 | 0.998764472105074 | 0.00247105578985261 | 0.0012355278949263 |
| Meta Analysis of Goldfeld-Quandt test for Heteroskedasticity | |||
| Description | # significant tests | % significant tests | OK/NOK |
| 1% type I error level | 31 | 0.775 | NOK |
| 5% type I error level | 32 | 0.8 | NOK |
| 10% type I error level | 32 | 0.8 | NOK |