Free Statistics

of Irreproducible Research!

Author's title

Author*The author of this computation has been verified*
R Software Modulerwasp_multipleregression.wasp
Title produced by softwareMultiple Regression
Date of computationTue, 22 Nov 2011 19:05:05 -0500
Cite this page as followsStatistical Computations at FreeStatistics.org, Office for Research Development and Education, URL https://freestatistics.org/blog/index.php?v=date/2011/Nov/22/t1322006808aj8cteifs9sgg5s.htm/, Retrieved Tue, 23 Apr 2024 23:45:47 +0000
Statistical Computations at FreeStatistics.org, Office for Research Development and Education, URL https://freestatistics.org/blog/index.php?pk=146454, Retrieved Tue, 23 Apr 2024 23:45:47 +0000
QR Codes:

Original text written by user:
IsPrivate?No (this computation is public)
User-defined keywords
Estimated Impact72
Family? (F = Feedback message, R = changed R code, M = changed R Module, P = changed Parameters, D = changed Data)
-       [Multiple Regression] [WS7 - A] [2011-11-23 00:05:05] [8aedcf735e397266388b06f47fe45218] [Current]
Feedback Forum

Post a new message
Dataseries X:
410,5	113.938	2,54
418,5	106.985	2,63
393,7	112.758	2,59
390,3	116.718	2,68
376,8	110.100	2,71
336,9	115.045	2,61
284,0	115.613	2,52
253,5	115.212	2,41
254,6	121.744	2,31
285,3	120.471	2,27
352,1	118.660	2,25
404,6	119.471	2,21
404,9	117.424	2,09
398,9	118.254	1,95
388,3	116.159	1,83
397,9	119.425	1,74
368,5	118.641	1,73
300,1	112.672	1,71
283,8	115.388	1,69
328,8	112.010	1,69
360,5	113.698	1,68
377,3	112.326	1,66
388,6	111.871	1,61
412,3	114.562	1,57
420,3	110.687	1,54
395,5	111.612	1,51
392,1	111.343	1,54
378,6	105.426	1,54
338,7	104.577	1,57
285,8	107.336	1,58
255,3	104.130	1,62
256,4	104.149	1,66
287,1	104.200	1,65
353,9	106.824	1,61
406,4	103.778	1,56
406,7	104.897	1,56
400,7	104.275	1,59
390,1	103.851	1,60
399,7	104.583	1,60
370,3	104.904	1,62
301,9	104.903	1,67
285,6	103.447	1,67
330,6	105.642	1,67
362,3	107.039	1,66
379,1	101.256	1,72
390,4	103.278	1,76
383,2	101.587	1,80
353,0	100.658	1,82
333,4	104.587	1,86
379,6	104.509	1,84
405,9	104.902	1,84


Summary of computational transaction
Raw Inputview raw input (R code)
Raw Outputview raw output of R engine
Computing time3 seconds
R Server'Herman Ole Andreas Wold' @ wold.wessa.net

\begin{tabular}{lllllllll}
\hline
Summary of computational transaction \tabularnewline
Raw Input & view raw input (R code)  \tabularnewline
Raw Output & view raw output of R engine  \tabularnewline
Computing time & 3 seconds \tabularnewline
R Server & 'Herman Ole Andreas Wold' @ wold.wessa.net \tabularnewline
\hline
\end{tabular}
%Source: https://freestatistics.org/blog/index.php?pk=146454&T=0

[TABLE]
[ROW][C]Summary of computational transaction[/C][/ROW]
[ROW][C]Raw Input[/C][C]view raw input (R code) [/C][/ROW]
[ROW][C]Raw Output[/C][C]view raw output of R engine [/C][/ROW]
[ROW][C]Computing time[/C][C]3 seconds[/C][/ROW]
[ROW][C]R Server[/C][C]'Herman Ole Andreas Wold' @ wold.wessa.net[/C][/ROW]
[/TABLE]
Source: https://freestatistics.org/blog/index.php?pk=146454&T=0

Globally Unique Identifier (entire table): ba.freestatistics.org/blog/index.php?pk=146454&T=0

As an alternative you can also use a QR Code:  

The GUIDs for individual cells are displayed in the table below:

Summary of computational transaction
Raw Inputview raw input (R code)
Raw Outputview raw output of R engine
Computing time3 seconds
R Server'Herman Ole Andreas Wold' @ wold.wessa.net


Multiple Linear Regression - Estimated Regression Equation
Fertility[t] = -1.28939197575677 -0.000161370275758072Unemployment[t] + 0.0292532045790361Deaths[t] + e[t]

\begin{tabular}{lllllllll}
\hline
Multiple Linear Regression - Estimated Regression Equation \tabularnewline
Fertility[t] =  -1.28939197575677 -0.000161370275758072Unemployment[t] +  0.0292532045790361Deaths[t]  + e[t] \tabularnewline
\hline
\end{tabular}
%Source: https://freestatistics.org/blog/index.php?pk=146454&T=1

[TABLE]
[ROW][C]Multiple Linear Regression - Estimated Regression Equation[/C][/ROW]
[ROW][C]Fertility[t] =  -1.28939197575677 -0.000161370275758072Unemployment[t] +  0.0292532045790361Deaths[t]  + e[t][/C][/ROW]
[/TABLE]
Source: https://freestatistics.org/blog/index.php?pk=146454&T=1

Globally Unique Identifier (entire table): ba.freestatistics.org/blog/index.php?pk=146454&T=1

As an alternative you can also use a QR Code:  

The GUIDs for individual cells are displayed in the table below:

Multiple Linear Regression - Estimated Regression Equation
Fertility[t] = -1.28939197575677 -0.000161370275758072Unemployment[t] + 0.0292532045790361Deaths[t] + e[t]


Multiple Linear Regression - Ordinary Least Squares
VariableParameterS.D.T-STATH0: parameter = 02-tail p-value1-tail p-value
(Intercept)-1.289391975756770.922319-1.3980.1685430.084272
Unemployment-0.0001613702757580720.000923-0.17490.86190.43095
Deaths0.02925320457903610.0077323.78320.000430.000215

\begin{tabular}{lllllllll}
\hline
Multiple Linear Regression - Ordinary Least Squares \tabularnewline
Variable & Parameter & S.D. & T-STATH0: parameter = 0 & 2-tail p-value & 1-tail p-value \tabularnewline
(Intercept) & -1.28939197575677 & 0.922319 & -1.398 & 0.168543 & 0.084272 \tabularnewline
Unemployment & -0.000161370275758072 & 0.000923 & -0.1749 & 0.8619 & 0.43095 \tabularnewline
Deaths & 0.0292532045790361 & 0.007732 & 3.7832 & 0.00043 & 0.000215 \tabularnewline
\hline
\end{tabular}
%Source: https://freestatistics.org/blog/index.php?pk=146454&T=2

[TABLE]
[ROW][C]Multiple Linear Regression - Ordinary Least Squares[/C][/ROW]
[ROW][C]Variable[/C][C]Parameter[/C][C]S.D.[/C][C]T-STATH0: parameter = 0[/C][C]2-tail p-value[/C][C]1-tail p-value[/C][/ROW]
[ROW][C](Intercept)[/C][C]-1.28939197575677[/C][C]0.922319[/C][C]-1.398[/C][C]0.168543[/C][C]0.084272[/C][/ROW]
[ROW][C]Unemployment[/C][C]-0.000161370275758072[/C][C]0.000923[/C][C]-0.1749[/C][C]0.8619[/C][C]0.43095[/C][/ROW]
[ROW][C]Deaths[/C][C]0.0292532045790361[/C][C]0.007732[/C][C]3.7832[/C][C]0.00043[/C][C]0.000215[/C][/ROW]
[/TABLE]
Source: https://freestatistics.org/blog/index.php?pk=146454&T=2

Globally Unique Identifier (entire table): ba.freestatistics.org/blog/index.php?pk=146454&T=2

As an alternative you can also use a QR Code:  

The GUIDs for individual cells are displayed in the table below:

Multiple Linear Regression - Ordinary Least Squares
VariableParameterS.D.T-STATH0: parameter = 02-tail p-value1-tail p-value
(Intercept)-1.289391975756770.922319-1.3980.1685430.084272
Unemployment-0.0001613702757580720.000923-0.17490.86190.43095
Deaths0.02925320457903610.0077323.78320.000430.000215


Multiple Linear Regression - Regression Statistics
Multiple R0.480347389560815
R-squared0.230733614657889
Adjusted R-squared0.198680848601968
F-TEST (value)7.19855547740676
F-TEST (DF numerator)2
F-TEST (DF denominator)48
p-value0.00184434486684115
Multiple Linear Regression - Residual Statistics
Residual Standard Deviation0.328730916253266
Sum Squared Residuals5.18707273443416

\begin{tabular}{lllllllll}
\hline
Multiple Linear Regression - Regression Statistics \tabularnewline
Multiple R & 0.480347389560815 \tabularnewline
R-squared & 0.230733614657889 \tabularnewline
Adjusted R-squared & 0.198680848601968 \tabularnewline
F-TEST (value) & 7.19855547740676 \tabularnewline
F-TEST (DF numerator) & 2 \tabularnewline
F-TEST (DF denominator) & 48 \tabularnewline
p-value & 0.00184434486684115 \tabularnewline
Multiple Linear Regression - Residual Statistics \tabularnewline
Residual Standard Deviation & 0.328730916253266 \tabularnewline
Sum Squared Residuals & 5.18707273443416 \tabularnewline
\hline
\end{tabular}
%Source: https://freestatistics.org/blog/index.php?pk=146454&T=3

[TABLE]
[ROW][C]Multiple Linear Regression - Regression Statistics[/C][/ROW]
[ROW][C]Multiple R[/C][C]0.480347389560815[/C][/ROW]
[ROW][C]R-squared[/C][C]0.230733614657889[/C][/ROW]
[ROW][C]Adjusted R-squared[/C][C]0.198680848601968[/C][/ROW]
[ROW][C]F-TEST (value)[/C][C]7.19855547740676[/C][/ROW]
[ROW][C]F-TEST (DF numerator)[/C][C]2[/C][/ROW]
[ROW][C]F-TEST (DF denominator)[/C][C]48[/C][/ROW]
[ROW][C]p-value[/C][C]0.00184434486684115[/C][/ROW]
[ROW][C]Multiple Linear Regression - Residual Statistics[/C][/ROW]
[ROW][C]Residual Standard Deviation[/C][C]0.328730916253266[/C][/ROW]
[ROW][C]Sum Squared Residuals[/C][C]5.18707273443416[/C][/ROW]
[/TABLE]
Source: https://freestatistics.org/blog/index.php?pk=146454&T=3

Globally Unique Identifier (entire table): ba.freestatistics.org/blog/index.php?pk=146454&T=3

As an alternative you can also use a QR Code:  

The GUIDs for individual cells are displayed in the table below:

Multiple Linear Regression - Regression Statistics
Multiple R0.480347389560815
R-squared0.230733614657889
Adjusted R-squared0.198680848601968
F-TEST (value)7.19855547740676
F-TEST (DF numerator)2
F-TEST (DF denominator)48
p-value0.00184434486684115
Multiple Linear Regression - Residual Statistics
Residual Standard Deviation0.328730916253266
Sum Squared Residuals5.18707273443416


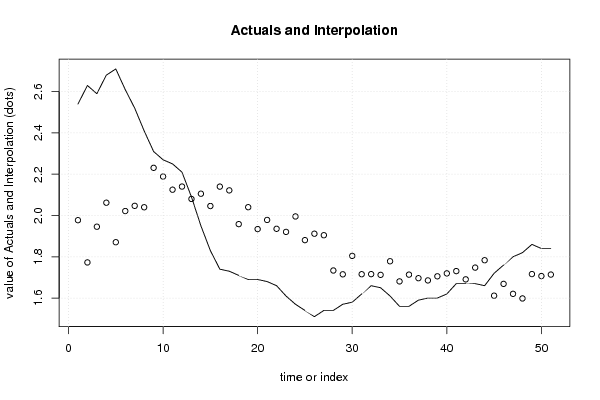
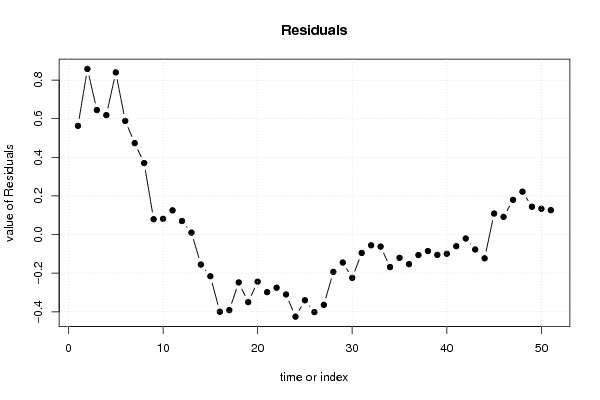
Multiple Linear Regression - Actuals, Interpolation, and Residuals
Time or IndexActualsInterpolationForecastResidualsPrediction Error
12.541.977417149370760.562582850629238
22.631.772728655726660.857271344273339
32.591.945609388600240.644390611399763
42.682.06200073767080.617999262329203
52.711.870581528489470.83941847151053
62.612.021677299135550.588322700864449
72.522.046829606924050.473170393075955
82.412.040020865298470.369979134701527
92.312.23092529030540.0790747096945969
102.272.188731893410520.0812681065894826
112.252.124974805497240.125025194502756
122.212.140227214933540.0697727850664566
132.092.080297494077530.00970250592247082
141.952.10554587553268-0.155545875532677
151.832.04597093686263-0.215970936862632
161.742.13996274837049-0.399962748370487
171.732.12177252208781-0.39177252208781
181.711.9581978708174-0.248197870817395
191.692.04027990994891-0.350279909948914
201.691.93420092247182-0.244200922471817
211.681.9784648940597-0.298464894059699
221.661.93561847674453-0.275618476744525
231.611.920484784545-0.310484784544998
241.571.99538068253172-0.425380682531718
251.541.88073355258189-0.340733552581888
261.511.9117947496563-0.401794749656297
271.541.90447429656211-0.364474296562114
281.541.73356158379069-0.193561583790691
291.571.71516428710584-0.145164287105836
301.581.804410366127-0.224410366126999
311.621.71554638565723-0.0955463856572299
321.661.7159246892409-0.0559246892408981
331.651.71246253520866-0.0624625352086562
341.611.77844340960341-0.168443409603407
351.561.68086620897837-0.120866208978365
361.561.71355213381958-0.153552133819579
371.591.69632486222597-0.106324862225967
381.61.68563202840749-0.085632028407491
391.61.70549621951207-0.105496219512068
401.621.71963078428923-0.0996307842892257
411.671.7306392579465-0.0606392579464992
421.671.69067692757428-0.0206769275742791
431.671.74762604921615-0.0776260492161499
441.661.78337733827153-0.123377338271533
451.721.611495035558230.108504964441769
461.761.668821531100980.091178468899024
471.81.620516228143280.179483771856716
481.821.598213383417250.221786616582747
491.861.716312081613140.143687918386856
501.841.706575024915960.133424975084044
511.841.713827496063080.12617250393692

\begin{tabular}{lllllllll}
\hline
Multiple Linear Regression - Actuals, Interpolation, and Residuals \tabularnewline
Time or Index & Actuals & InterpolationForecast & ResidualsPrediction Error \tabularnewline
1 & 2.54 & 1.97741714937076 & 0.562582850629238 \tabularnewline
2 & 2.63 & 1.77272865572666 & 0.857271344273339 \tabularnewline
3 & 2.59 & 1.94560938860024 & 0.644390611399763 \tabularnewline
4 & 2.68 & 2.0620007376708 & 0.617999262329203 \tabularnewline
5 & 2.71 & 1.87058152848947 & 0.83941847151053 \tabularnewline
6 & 2.61 & 2.02167729913555 & 0.588322700864449 \tabularnewline
7 & 2.52 & 2.04682960692405 & 0.473170393075955 \tabularnewline
8 & 2.41 & 2.04002086529847 & 0.369979134701527 \tabularnewline
9 & 2.31 & 2.2309252903054 & 0.0790747096945969 \tabularnewline
10 & 2.27 & 2.18873189341052 & 0.0812681065894826 \tabularnewline
11 & 2.25 & 2.12497480549724 & 0.125025194502756 \tabularnewline
12 & 2.21 & 2.14022721493354 & 0.0697727850664566 \tabularnewline
13 & 2.09 & 2.08029749407753 & 0.00970250592247082 \tabularnewline
14 & 1.95 & 2.10554587553268 & -0.155545875532677 \tabularnewline
15 & 1.83 & 2.04597093686263 & -0.215970936862632 \tabularnewline
16 & 1.74 & 2.13996274837049 & -0.399962748370487 \tabularnewline
17 & 1.73 & 2.12177252208781 & -0.39177252208781 \tabularnewline
18 & 1.71 & 1.9581978708174 & -0.248197870817395 \tabularnewline
19 & 1.69 & 2.04027990994891 & -0.350279909948914 \tabularnewline
20 & 1.69 & 1.93420092247182 & -0.244200922471817 \tabularnewline
21 & 1.68 & 1.9784648940597 & -0.298464894059699 \tabularnewline
22 & 1.66 & 1.93561847674453 & -0.275618476744525 \tabularnewline
23 & 1.61 & 1.920484784545 & -0.310484784544998 \tabularnewline
24 & 1.57 & 1.99538068253172 & -0.425380682531718 \tabularnewline
25 & 1.54 & 1.88073355258189 & -0.340733552581888 \tabularnewline
26 & 1.51 & 1.9117947496563 & -0.401794749656297 \tabularnewline
27 & 1.54 & 1.90447429656211 & -0.364474296562114 \tabularnewline
28 & 1.54 & 1.73356158379069 & -0.193561583790691 \tabularnewline
29 & 1.57 & 1.71516428710584 & -0.145164287105836 \tabularnewline
30 & 1.58 & 1.804410366127 & -0.224410366126999 \tabularnewline
31 & 1.62 & 1.71554638565723 & -0.0955463856572299 \tabularnewline
32 & 1.66 & 1.7159246892409 & -0.0559246892408981 \tabularnewline
33 & 1.65 & 1.71246253520866 & -0.0624625352086562 \tabularnewline
34 & 1.61 & 1.77844340960341 & -0.168443409603407 \tabularnewline
35 & 1.56 & 1.68086620897837 & -0.120866208978365 \tabularnewline
36 & 1.56 & 1.71355213381958 & -0.153552133819579 \tabularnewline
37 & 1.59 & 1.69632486222597 & -0.106324862225967 \tabularnewline
38 & 1.6 & 1.68563202840749 & -0.085632028407491 \tabularnewline
39 & 1.6 & 1.70549621951207 & -0.105496219512068 \tabularnewline
40 & 1.62 & 1.71963078428923 & -0.0996307842892257 \tabularnewline
41 & 1.67 & 1.7306392579465 & -0.0606392579464992 \tabularnewline
42 & 1.67 & 1.69067692757428 & -0.0206769275742791 \tabularnewline
43 & 1.67 & 1.74762604921615 & -0.0776260492161499 \tabularnewline
44 & 1.66 & 1.78337733827153 & -0.123377338271533 \tabularnewline
45 & 1.72 & 1.61149503555823 & 0.108504964441769 \tabularnewline
46 & 1.76 & 1.66882153110098 & 0.091178468899024 \tabularnewline
47 & 1.8 & 1.62051622814328 & 0.179483771856716 \tabularnewline
48 & 1.82 & 1.59821338341725 & 0.221786616582747 \tabularnewline
49 & 1.86 & 1.71631208161314 & 0.143687918386856 \tabularnewline
50 & 1.84 & 1.70657502491596 & 0.133424975084044 \tabularnewline
51 & 1.84 & 1.71382749606308 & 0.12617250393692 \tabularnewline
\hline
\end{tabular}
%Source: https://freestatistics.org/blog/index.php?pk=146454&T=4

[TABLE]
[ROW][C]Multiple Linear Regression - Actuals, Interpolation, and Residuals[/C][/ROW]
[ROW][C]Time or Index[/C][C]Actuals[/C][C]InterpolationForecast[/C][C]ResidualsPrediction Error[/C][/ROW]
[ROW][C]1[/C][C]2.54[/C][C]1.97741714937076[/C][C]0.562582850629238[/C][/ROW]
[ROW][C]2[/C][C]2.63[/C][C]1.77272865572666[/C][C]0.857271344273339[/C][/ROW]
[ROW][C]3[/C][C]2.59[/C][C]1.94560938860024[/C][C]0.644390611399763[/C][/ROW]
[ROW][C]4[/C][C]2.68[/C][C]2.0620007376708[/C][C]0.617999262329203[/C][/ROW]
[ROW][C]5[/C][C]2.71[/C][C]1.87058152848947[/C][C]0.83941847151053[/C][/ROW]
[ROW][C]6[/C][C]2.61[/C][C]2.02167729913555[/C][C]0.588322700864449[/C][/ROW]
[ROW][C]7[/C][C]2.52[/C][C]2.04682960692405[/C][C]0.473170393075955[/C][/ROW]
[ROW][C]8[/C][C]2.41[/C][C]2.04002086529847[/C][C]0.369979134701527[/C][/ROW]
[ROW][C]9[/C][C]2.31[/C][C]2.2309252903054[/C][C]0.0790747096945969[/C][/ROW]
[ROW][C]10[/C][C]2.27[/C][C]2.18873189341052[/C][C]0.0812681065894826[/C][/ROW]
[ROW][C]11[/C][C]2.25[/C][C]2.12497480549724[/C][C]0.125025194502756[/C][/ROW]
[ROW][C]12[/C][C]2.21[/C][C]2.14022721493354[/C][C]0.0697727850664566[/C][/ROW]
[ROW][C]13[/C][C]2.09[/C][C]2.08029749407753[/C][C]0.00970250592247082[/C][/ROW]
[ROW][C]14[/C][C]1.95[/C][C]2.10554587553268[/C][C]-0.155545875532677[/C][/ROW]
[ROW][C]15[/C][C]1.83[/C][C]2.04597093686263[/C][C]-0.215970936862632[/C][/ROW]
[ROW][C]16[/C][C]1.74[/C][C]2.13996274837049[/C][C]-0.399962748370487[/C][/ROW]
[ROW][C]17[/C][C]1.73[/C][C]2.12177252208781[/C][C]-0.39177252208781[/C][/ROW]
[ROW][C]18[/C][C]1.71[/C][C]1.9581978708174[/C][C]-0.248197870817395[/C][/ROW]
[ROW][C]19[/C][C]1.69[/C][C]2.04027990994891[/C][C]-0.350279909948914[/C][/ROW]
[ROW][C]20[/C][C]1.69[/C][C]1.93420092247182[/C][C]-0.244200922471817[/C][/ROW]
[ROW][C]21[/C][C]1.68[/C][C]1.9784648940597[/C][C]-0.298464894059699[/C][/ROW]
[ROW][C]22[/C][C]1.66[/C][C]1.93561847674453[/C][C]-0.275618476744525[/C][/ROW]
[ROW][C]23[/C][C]1.61[/C][C]1.920484784545[/C][C]-0.310484784544998[/C][/ROW]
[ROW][C]24[/C][C]1.57[/C][C]1.99538068253172[/C][C]-0.425380682531718[/C][/ROW]
[ROW][C]25[/C][C]1.54[/C][C]1.88073355258189[/C][C]-0.340733552581888[/C][/ROW]
[ROW][C]26[/C][C]1.51[/C][C]1.9117947496563[/C][C]-0.401794749656297[/C][/ROW]
[ROW][C]27[/C][C]1.54[/C][C]1.90447429656211[/C][C]-0.364474296562114[/C][/ROW]
[ROW][C]28[/C][C]1.54[/C][C]1.73356158379069[/C][C]-0.193561583790691[/C][/ROW]
[ROW][C]29[/C][C]1.57[/C][C]1.71516428710584[/C][C]-0.145164287105836[/C][/ROW]
[ROW][C]30[/C][C]1.58[/C][C]1.804410366127[/C][C]-0.224410366126999[/C][/ROW]
[ROW][C]31[/C][C]1.62[/C][C]1.71554638565723[/C][C]-0.0955463856572299[/C][/ROW]
[ROW][C]32[/C][C]1.66[/C][C]1.7159246892409[/C][C]-0.0559246892408981[/C][/ROW]
[ROW][C]33[/C][C]1.65[/C][C]1.71246253520866[/C][C]-0.0624625352086562[/C][/ROW]
[ROW][C]34[/C][C]1.61[/C][C]1.77844340960341[/C][C]-0.168443409603407[/C][/ROW]
[ROW][C]35[/C][C]1.56[/C][C]1.68086620897837[/C][C]-0.120866208978365[/C][/ROW]
[ROW][C]36[/C][C]1.56[/C][C]1.71355213381958[/C][C]-0.153552133819579[/C][/ROW]
[ROW][C]37[/C][C]1.59[/C][C]1.69632486222597[/C][C]-0.106324862225967[/C][/ROW]
[ROW][C]38[/C][C]1.6[/C][C]1.68563202840749[/C][C]-0.085632028407491[/C][/ROW]
[ROW][C]39[/C][C]1.6[/C][C]1.70549621951207[/C][C]-0.105496219512068[/C][/ROW]
[ROW][C]40[/C][C]1.62[/C][C]1.71963078428923[/C][C]-0.0996307842892257[/C][/ROW]
[ROW][C]41[/C][C]1.67[/C][C]1.7306392579465[/C][C]-0.0606392579464992[/C][/ROW]
[ROW][C]42[/C][C]1.67[/C][C]1.69067692757428[/C][C]-0.0206769275742791[/C][/ROW]
[ROW][C]43[/C][C]1.67[/C][C]1.74762604921615[/C][C]-0.0776260492161499[/C][/ROW]
[ROW][C]44[/C][C]1.66[/C][C]1.78337733827153[/C][C]-0.123377338271533[/C][/ROW]
[ROW][C]45[/C][C]1.72[/C][C]1.61149503555823[/C][C]0.108504964441769[/C][/ROW]
[ROW][C]46[/C][C]1.76[/C][C]1.66882153110098[/C][C]0.091178468899024[/C][/ROW]
[ROW][C]47[/C][C]1.8[/C][C]1.62051622814328[/C][C]0.179483771856716[/C][/ROW]
[ROW][C]48[/C][C]1.82[/C][C]1.59821338341725[/C][C]0.221786616582747[/C][/ROW]
[ROW][C]49[/C][C]1.86[/C][C]1.71631208161314[/C][C]0.143687918386856[/C][/ROW]
[ROW][C]50[/C][C]1.84[/C][C]1.70657502491596[/C][C]0.133424975084044[/C][/ROW]
[ROW][C]51[/C][C]1.84[/C][C]1.71382749606308[/C][C]0.12617250393692[/C][/ROW]
[/TABLE]
Source: https://freestatistics.org/blog/index.php?pk=146454&T=4

Globally Unique Identifier (entire table): ba.freestatistics.org/blog/index.php?pk=146454&T=4

As an alternative you can also use a QR Code:  

The GUIDs for individual cells are displayed in the table below:

Multiple Linear Regression - Actuals, Interpolation, and Residuals
Time or IndexActualsInterpolationForecastResidualsPrediction Error
12.541.977417149370760.562582850629238
22.631.772728655726660.857271344273339
32.591.945609388600240.644390611399763
42.682.06200073767080.617999262329203
52.711.870581528489470.83941847151053
62.612.021677299135550.588322700864449
72.522.046829606924050.473170393075955
82.412.040020865298470.369979134701527
92.312.23092529030540.0790747096945969
102.272.188731893410520.0812681065894826
112.252.124974805497240.125025194502756
122.212.140227214933540.0697727850664566
132.092.080297494077530.00970250592247082
141.952.10554587553268-0.155545875532677
151.832.04597093686263-0.215970936862632
161.742.13996274837049-0.399962748370487
171.732.12177252208781-0.39177252208781
181.711.9581978708174-0.248197870817395
191.692.04027990994891-0.350279909948914
201.691.93420092247182-0.244200922471817
211.681.9784648940597-0.298464894059699
221.661.93561847674453-0.275618476744525
231.611.920484784545-0.310484784544998
241.571.99538068253172-0.425380682531718
251.541.88073355258189-0.340733552581888
261.511.9117947496563-0.401794749656297
271.541.90447429656211-0.364474296562114
281.541.73356158379069-0.193561583790691
291.571.71516428710584-0.145164287105836
301.581.804410366127-0.224410366126999
311.621.71554638565723-0.0955463856572299
321.661.7159246892409-0.0559246892408981
331.651.71246253520866-0.0624625352086562
341.611.77844340960341-0.168443409603407
351.561.68086620897837-0.120866208978365
361.561.71355213381958-0.153552133819579
371.591.69632486222597-0.106324862225967
381.61.68563202840749-0.085632028407491
391.61.70549621951207-0.105496219512068
401.621.71963078428923-0.0996307842892257
411.671.7306392579465-0.0606392579464992
421.671.69067692757428-0.0206769275742791
431.671.74762604921615-0.0776260492161499
441.661.78337733827153-0.123377338271533
451.721.611495035558230.108504964441769
461.761.668821531100980.091178468899024
471.81.620516228143280.179483771856716
481.821.598213383417250.221786616582747
491.861.716312081613140.143687918386856
501.841.706575024915960.133424975084044
511.841.713827496063080.12617250393692


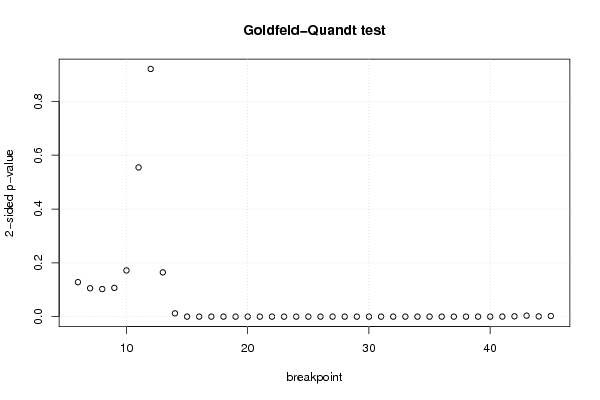
Goldfeld-Quandt test for Heteroskedasticity
p-valuesAlternative Hypothesis
breakpoint indexgreater2-sidedless
60.0641223760470370.1282447520940740.935877623952963
70.05275672917872150.1055134583574430.947243270821279
80.0512431866329420.1024863732658840.948756813367058
90.05347141758819160.1069428351763830.946528582411808
100.08595692970019210.1719138594003840.914043070299808
110.2773000849096440.5546001698192890.722699915090356
120.5397230382906730.9205539234186540.460276961709327
130.9176763837874050.1646472324251910.0823236162125953
140.9938721190458930.01225576190821460.00612788095410732
150.9999395427694330.0001209144611331276.04572305665634e-05
160.9999863117631282.7376473744361e-051.36882368721805e-05
170.9999981690632463.66187350819578e-061.83093675409789e-06
180.9999999959262988.14740421123241e-094.0737021056162e-09
190.9999999993483141.30337296506899e-096.51686482534497e-10
200.9999999998547622.90475507565909e-101.45237753782955e-10
210.9999999999432671.13466352621954e-105.67331763109768e-11
220.9999999999670696.58623491016893e-113.29311745508446e-11
230.9999999999640217.19588513374894e-113.59794256687447e-11
240.9999999999612267.75486168406768e-113.87743084203384e-11
250.999999999915841.68320396300625e-108.41601981503123e-11
260.9999999997948714.10257406178894e-102.05128703089447e-10
270.9999999994325431.13491476454359e-095.67457382271794e-10
280.9999999988455022.30899556777467e-091.15449778388733e-09
290.9999999971753175.64936680317817e-092.82468340158908e-09
300.9999999889819082.20361846864972e-081.10180923432486e-08
310.9999999622570557.54858891086456e-083.77429445543228e-08
320.9999998538920052.92215989446888e-071.46107994723444e-07
330.9999995127983359.74403330575211e-074.87201665287605e-07
340.9999981146152143.7707695729019e-061.88538478645095e-06
350.9999962873882257.42522354941372e-063.71261177470686e-06
360.9999924053123631.5189375273525e-057.59468763676252e-06
370.9999851750520782.96498958444454e-051.48249479222227e-05
380.9999770412452764.59175094479024e-052.29587547239512e-05
390.9999770073078684.5985384264341e-052.29926921321705e-05
400.9999709018175235.81963649535563e-052.90981824767782e-05
410.9998533157209360.0002933685581275660.000146684279063783
420.9993587608901320.001282478219736460.000641239109868232
430.9982016013728470.00359679725430690.00179839862715345
440.9995649354919350.0008701290161301090.000435064508065054
450.9987644721050740.002471055789852610.0012355278949263

\begin{tabular}{lllllllll}
\hline
Goldfeld-Quandt test for Heteroskedasticity \tabularnewline
p-values & Alternative Hypothesis \tabularnewline
breakpoint index & greater & 2-sided & less \tabularnewline
6 & 0.064122376047037 & 0.128244752094074 & 0.935877623952963 \tabularnewline
7 & 0.0527567291787215 & 0.105513458357443 & 0.947243270821279 \tabularnewline
8 & 0.051243186632942 & 0.102486373265884 & 0.948756813367058 \tabularnewline
9 & 0.0534714175881916 & 0.106942835176383 & 0.946528582411808 \tabularnewline
10 & 0.0859569297001921 & 0.171913859400384 & 0.914043070299808 \tabularnewline
11 & 0.277300084909644 & 0.554600169819289 & 0.722699915090356 \tabularnewline
12 & 0.539723038290673 & 0.920553923418654 & 0.460276961709327 \tabularnewline
13 & 0.917676383787405 & 0.164647232425191 & 0.0823236162125953 \tabularnewline
14 & 0.993872119045893 & 0.0122557619082146 & 0.00612788095410732 \tabularnewline
15 & 0.999939542769433 & 0.000120914461133127 & 6.04572305665634e-05 \tabularnewline
16 & 0.999986311763128 & 2.7376473744361e-05 & 1.36882368721805e-05 \tabularnewline
17 & 0.999998169063246 & 3.66187350819578e-06 & 1.83093675409789e-06 \tabularnewline
18 & 0.999999995926298 & 8.14740421123241e-09 & 4.0737021056162e-09 \tabularnewline
19 & 0.999999999348314 & 1.30337296506899e-09 & 6.51686482534497e-10 \tabularnewline
20 & 0.999999999854762 & 2.90475507565909e-10 & 1.45237753782955e-10 \tabularnewline
21 & 0.999999999943267 & 1.13466352621954e-10 & 5.67331763109768e-11 \tabularnewline
22 & 0.999999999967069 & 6.58623491016893e-11 & 3.29311745508446e-11 \tabularnewline
23 & 0.999999999964021 & 7.19588513374894e-11 & 3.59794256687447e-11 \tabularnewline
24 & 0.999999999961226 & 7.75486168406768e-11 & 3.87743084203384e-11 \tabularnewline
25 & 0.99999999991584 & 1.68320396300625e-10 & 8.41601981503123e-11 \tabularnewline
26 & 0.999999999794871 & 4.10257406178894e-10 & 2.05128703089447e-10 \tabularnewline
27 & 0.999999999432543 & 1.13491476454359e-09 & 5.67457382271794e-10 \tabularnewline
28 & 0.999999998845502 & 2.30899556777467e-09 & 1.15449778388733e-09 \tabularnewline
29 & 0.999999997175317 & 5.64936680317817e-09 & 2.82468340158908e-09 \tabularnewline
30 & 0.999999988981908 & 2.20361846864972e-08 & 1.10180923432486e-08 \tabularnewline
31 & 0.999999962257055 & 7.54858891086456e-08 & 3.77429445543228e-08 \tabularnewline
32 & 0.999999853892005 & 2.92215989446888e-07 & 1.46107994723444e-07 \tabularnewline
33 & 0.999999512798335 & 9.74403330575211e-07 & 4.87201665287605e-07 \tabularnewline
34 & 0.999998114615214 & 3.7707695729019e-06 & 1.88538478645095e-06 \tabularnewline
35 & 0.999996287388225 & 7.42522354941372e-06 & 3.71261177470686e-06 \tabularnewline
36 & 0.999992405312363 & 1.5189375273525e-05 & 7.59468763676252e-06 \tabularnewline
37 & 0.999985175052078 & 2.96498958444454e-05 & 1.48249479222227e-05 \tabularnewline
38 & 0.999977041245276 & 4.59175094479024e-05 & 2.29587547239512e-05 \tabularnewline
39 & 0.999977007307868 & 4.5985384264341e-05 & 2.29926921321705e-05 \tabularnewline
40 & 0.999970901817523 & 5.81963649535563e-05 & 2.90981824767782e-05 \tabularnewline
41 & 0.999853315720936 & 0.000293368558127566 & 0.000146684279063783 \tabularnewline
42 & 0.999358760890132 & 0.00128247821973646 & 0.000641239109868232 \tabularnewline
43 & 0.998201601372847 & 0.0035967972543069 & 0.00179839862715345 \tabularnewline
44 & 0.999564935491935 & 0.000870129016130109 & 0.000435064508065054 \tabularnewline
45 & 0.998764472105074 & 0.00247105578985261 & 0.0012355278949263 \tabularnewline
\hline
\end{tabular}
%Source: https://freestatistics.org/blog/index.php?pk=146454&T=5

[TABLE]
[ROW][C]Goldfeld-Quandt test for Heteroskedasticity[/C][/ROW]
[ROW][C]p-values[/C][C]Alternative Hypothesis[/C][/ROW]
[ROW][C]breakpoint index[/C][C]greater[/C][C]2-sided[/C][C]less[/C][/ROW]
[ROW][C]6[/C][C]0.064122376047037[/C][C]0.128244752094074[/C][C]0.935877623952963[/C][/ROW]
[ROW][C]7[/C][C]0.0527567291787215[/C][C]0.105513458357443[/C][C]0.947243270821279[/C][/ROW]
[ROW][C]8[/C][C]0.051243186632942[/C][C]0.102486373265884[/C][C]0.948756813367058[/C][/ROW]
[ROW][C]9[/C][C]0.0534714175881916[/C][C]0.106942835176383[/C][C]0.946528582411808[/C][/ROW]
[ROW][C]10[/C][C]0.0859569297001921[/C][C]0.171913859400384[/C][C]0.914043070299808[/C][/ROW]
[ROW][C]11[/C][C]0.277300084909644[/C][C]0.554600169819289[/C][C]0.722699915090356[/C][/ROW]
[ROW][C]12[/C][C]0.539723038290673[/C][C]0.920553923418654[/C][C]0.460276961709327[/C][/ROW]
[ROW][C]13[/C][C]0.917676383787405[/C][C]0.164647232425191[/C][C]0.0823236162125953[/C][/ROW]
[ROW][C]14[/C][C]0.993872119045893[/C][C]0.0122557619082146[/C][C]0.00612788095410732[/C][/ROW]
[ROW][C]15[/C][C]0.999939542769433[/C][C]0.000120914461133127[/C][C]6.04572305665634e-05[/C][/ROW]
[ROW][C]16[/C][C]0.999986311763128[/C][C]2.7376473744361e-05[/C][C]1.36882368721805e-05[/C][/ROW]
[ROW][C]17[/C][C]0.999998169063246[/C][C]3.66187350819578e-06[/C][C]1.83093675409789e-06[/C][/ROW]
[ROW][C]18[/C][C]0.999999995926298[/C][C]8.14740421123241e-09[/C][C]4.0737021056162e-09[/C][/ROW]
[ROW][C]19[/C][C]0.999999999348314[/C][C]1.30337296506899e-09[/C][C]6.51686482534497e-10[/C][/ROW]
[ROW][C]20[/C][C]0.999999999854762[/C][C]2.90475507565909e-10[/C][C]1.45237753782955e-10[/C][/ROW]
[ROW][C]21[/C][C]0.999999999943267[/C][C]1.13466352621954e-10[/C][C]5.67331763109768e-11[/C][/ROW]
[ROW][C]22[/C][C]0.999999999967069[/C][C]6.58623491016893e-11[/C][C]3.29311745508446e-11[/C][/ROW]
[ROW][C]23[/C][C]0.999999999964021[/C][C]7.19588513374894e-11[/C][C]3.59794256687447e-11[/C][/ROW]
[ROW][C]24[/C][C]0.999999999961226[/C][C]7.75486168406768e-11[/C][C]3.87743084203384e-11[/C][/ROW]
[ROW][C]25[/C][C]0.99999999991584[/C][C]1.68320396300625e-10[/C][C]8.41601981503123e-11[/C][/ROW]
[ROW][C]26[/C][C]0.999999999794871[/C][C]4.10257406178894e-10[/C][C]2.05128703089447e-10[/C][/ROW]
[ROW][C]27[/C][C]0.999999999432543[/C][C]1.13491476454359e-09[/C][C]5.67457382271794e-10[/C][/ROW]
[ROW][C]28[/C][C]0.999999998845502[/C][C]2.30899556777467e-09[/C][C]1.15449778388733e-09[/C][/ROW]
[ROW][C]29[/C][C]0.999999997175317[/C][C]5.64936680317817e-09[/C][C]2.82468340158908e-09[/C][/ROW]
[ROW][C]30[/C][C]0.999999988981908[/C][C]2.20361846864972e-08[/C][C]1.10180923432486e-08[/C][/ROW]
[ROW][C]31[/C][C]0.999999962257055[/C][C]7.54858891086456e-08[/C][C]3.77429445543228e-08[/C][/ROW]
[ROW][C]32[/C][C]0.999999853892005[/C][C]2.92215989446888e-07[/C][C]1.46107994723444e-07[/C][/ROW]
[ROW][C]33[/C][C]0.999999512798335[/C][C]9.74403330575211e-07[/C][C]4.87201665287605e-07[/C][/ROW]
[ROW][C]34[/C][C]0.999998114615214[/C][C]3.7707695729019e-06[/C][C]1.88538478645095e-06[/C][/ROW]
[ROW][C]35[/C][C]0.999996287388225[/C][C]7.42522354941372e-06[/C][C]3.71261177470686e-06[/C][/ROW]
[ROW][C]36[/C][C]0.999992405312363[/C][C]1.5189375273525e-05[/C][C]7.59468763676252e-06[/C][/ROW]
[ROW][C]37[/C][C]0.999985175052078[/C][C]2.96498958444454e-05[/C][C]1.48249479222227e-05[/C][/ROW]
[ROW][C]38[/C][C]0.999977041245276[/C][C]4.59175094479024e-05[/C][C]2.29587547239512e-05[/C][/ROW]
[ROW][C]39[/C][C]0.999977007307868[/C][C]4.5985384264341e-05[/C][C]2.29926921321705e-05[/C][/ROW]
[ROW][C]40[/C][C]0.999970901817523[/C][C]5.81963649535563e-05[/C][C]2.90981824767782e-05[/C][/ROW]
[ROW][C]41[/C][C]0.999853315720936[/C][C]0.000293368558127566[/C][C]0.000146684279063783[/C][/ROW]
[ROW][C]42[/C][C]0.999358760890132[/C][C]0.00128247821973646[/C][C]0.000641239109868232[/C][/ROW]
[ROW][C]43[/C][C]0.998201601372847[/C][C]0.0035967972543069[/C][C]0.00179839862715345[/C][/ROW]
[ROW][C]44[/C][C]0.999564935491935[/C][C]0.000870129016130109[/C][C]0.000435064508065054[/C][/ROW]
[ROW][C]45[/C][C]0.998764472105074[/C][C]0.00247105578985261[/C][C]0.0012355278949263[/C][/ROW]
[/TABLE]
Source: https://freestatistics.org/blog/index.php?pk=146454&T=5

Globally Unique Identifier (entire table): ba.freestatistics.org/blog/index.php?pk=146454&T=5

As an alternative you can also use a QR Code:  

The GUIDs for individual cells are displayed in the table below:

Goldfeld-Quandt test for Heteroskedasticity
p-valuesAlternative Hypothesis
breakpoint indexgreater2-sidedless
60.0641223760470370.1282447520940740.935877623952963
70.05275672917872150.1055134583574430.947243270821279
80.0512431866329420.1024863732658840.948756813367058
90.05347141758819160.1069428351763830.946528582411808
100.08595692970019210.1719138594003840.914043070299808
110.2773000849096440.5546001698192890.722699915090356
120.5397230382906730.9205539234186540.460276961709327
130.9176763837874050.1646472324251910.0823236162125953
140.9938721190458930.01225576190821460.00612788095410732
150.9999395427694330.0001209144611331276.04572305665634e-05
160.9999863117631282.7376473744361e-051.36882368721805e-05
170.9999981690632463.66187350819578e-061.83093675409789e-06
180.9999999959262988.14740421123241e-094.0737021056162e-09
190.9999999993483141.30337296506899e-096.51686482534497e-10
200.9999999998547622.90475507565909e-101.45237753782955e-10
210.9999999999432671.13466352621954e-105.67331763109768e-11
220.9999999999670696.58623491016893e-113.29311745508446e-11
230.9999999999640217.19588513374894e-113.59794256687447e-11
240.9999999999612267.75486168406768e-113.87743084203384e-11
250.999999999915841.68320396300625e-108.41601981503123e-11
260.9999999997948714.10257406178894e-102.05128703089447e-10
270.9999999994325431.13491476454359e-095.67457382271794e-10
280.9999999988455022.30899556777467e-091.15449778388733e-09
290.9999999971753175.64936680317817e-092.82468340158908e-09
300.9999999889819082.20361846864972e-081.10180923432486e-08
310.9999999622570557.54858891086456e-083.77429445543228e-08
320.9999998538920052.92215989446888e-071.46107994723444e-07
330.9999995127983359.74403330575211e-074.87201665287605e-07
340.9999981146152143.7707695729019e-061.88538478645095e-06
350.9999962873882257.42522354941372e-063.71261177470686e-06
360.9999924053123631.5189375273525e-057.59468763676252e-06
370.9999851750520782.96498958444454e-051.48249479222227e-05
380.9999770412452764.59175094479024e-052.29587547239512e-05
390.9999770073078684.5985384264341e-052.29926921321705e-05
400.9999709018175235.81963649535563e-052.90981824767782e-05
410.9998533157209360.0002933685581275660.000146684279063783
420.9993587608901320.001282478219736460.000641239109868232
430.9982016013728470.00359679725430690.00179839862715345
440.9995649354919350.0008701290161301090.000435064508065054
450.9987644721050740.002471055789852610.0012355278949263


Meta Analysis of Goldfeld-Quandt test for Heteroskedasticity
Description# significant tests% significant testsOK/NOK
1% type I error level310.775NOK
5% type I error level320.8NOK
10% type I error level320.8NOK

\begin{tabular}{lllllllll}
\hline
Meta Analysis of Goldfeld-Quandt test for Heteroskedasticity \tabularnewline
Description & # significant tests & % significant tests & OK/NOK \tabularnewline
1% type I error level & 31 & 0.775 & NOK \tabularnewline
5% type I error level & 32 & 0.8 & NOK \tabularnewline
10% type I error level & 32 & 0.8 & NOK \tabularnewline
\hline
\end{tabular}
%Source: https://freestatistics.org/blog/index.php?pk=146454&T=6

[TABLE]
[ROW][C]Meta Analysis of Goldfeld-Quandt test for Heteroskedasticity[/C][/ROW]
[ROW][C]Description[/C][C]# significant tests[/C][C]% significant tests[/C][C]OK/NOK[/C][/ROW]
[ROW][C]1% type I error level[/C][C]31[/C][C]0.775[/C][C]NOK[/C][/ROW]
[ROW][C]5% type I error level[/C][C]32[/C][C]0.8[/C][C]NOK[/C][/ROW]
[ROW][C]10% type I error level[/C][C]32[/C][C]0.8[/C][C]NOK[/C][/ROW]
[/TABLE]
Source: https://freestatistics.org/blog/index.php?pk=146454&T=6

Globally Unique Identifier (entire table): ba.freestatistics.org/blog/index.php?pk=146454&T=6

As an alternative you can also use a QR Code:  

The GUIDs for individual cells are displayed in the table below:

Meta Analysis of Goldfeld-Quandt test for Heteroskedasticity
Description# significant tests% significant testsOK/NOK
1% type I error level310.775NOK
5% type I error level320.8NOK
10% type I error level320.8NOK


Parameters (Session):
par1 = 3 ; par2 = Do not include Seasonal Dummies ; par3 = First Differences ;
Parameters (R input):
par1 = 3 ; par2 = Do not include Seasonal Dummies ; par3 = No Linear Trend ;
R code (references can be found in the software module):
library(lattice)
library(lmtest)
n25 <- 25 #minimum number of obs. for Goldfeld-Quandt test
par1 <- as.numeric(par1)
x <- t(y)
k <- length(x[1,])
n <- length(x[,1])
x1 <- cbind(x[,par1], x[,1:k!=par1])
mycolnames <- c(colnames(x)[par1], colnames(x)[1:k!=par1])
colnames(x1) <- mycolnames #colnames(x)[par1]
x <- x1
if (par3 == 'First Differences'){
x2 <- array(0, dim=c(n-1,k), dimnames=list(1:(n-1), paste('(1-B)',colnames(x),sep='')))
for (i in 1:n-1) {
for (j in 1:k) {
x2[i,j] <- x[i+1,j] - x[i,j]
}
}
x <- x2
}
if (par2 == 'Include Monthly Dummies'){
x2 <- array(0, dim=c(n,11), dimnames=list(1:n, paste('M', seq(1:11), sep ='')))
for (i in 1:11){
x2[seq(i,n,12),i] <- 1
}
x <- cbind(x, x2)
}
if (par2 == 'Include Quarterly Dummies'){
x2 <- array(0, dim=c(n,3), dimnames=list(1:n, paste('Q', seq(1:3), sep ='')))
for (i in 1:3){
x2[seq(i,n,4),i] <- 1
}
x <- cbind(x, x2)
}
k <- length(x[1,])
if (par3 == 'Linear Trend'){
x <- cbind(x, c(1:n))
colnames(x)[k+1] <- 't'
}
x
k <- length(x[1,])
df <- as.data.frame(x)
(mylm <- lm(df))
(mysum <- summary(mylm))
if (n > n25) {
kp3 <- k + 3
nmkm3 <- n - k - 3
gqarr <- array(NA, dim=c(nmkm3-kp3+1,3))
numgqtests <- 0
numsignificant1 <- 0
numsignificant5 <- 0
numsignificant10 <- 0
for (mypoint in kp3:nmkm3) {
j <- 0
numgqtests <- numgqtests + 1
for (myalt in c('greater', 'two.sided', 'less')) {
j <- j + 1
gqarr[mypoint-kp3+1,j] <- gqtest(mylm, point=mypoint, alternative=myalt)$p.value
}
if (gqarr[mypoint-kp3+1,2] < 0.01) numsignificant1 <- numsignificant1 + 1
if (gqarr[mypoint-kp3+1,2] < 0.05) numsignificant5 <- numsignificant5 + 1
if (gqarr[mypoint-kp3+1,2] < 0.10) numsignificant10 <- numsignificant10 + 1
}
gqarr
}
bitmap(file='test0.png')
plot(x[,1], type='l', main='Actuals and Interpolation', ylab='value of Actuals and Interpolation (dots)', xlab='time or index')
points(x[,1]-mysum$resid)
grid()
dev.off()
bitmap(file='test1.png')
plot(mysum$resid, type='b', pch=19, main='Residuals', ylab='value of Residuals', xlab='time or index')
grid()
dev.off()
bitmap(file='test2.png')
hist(mysum$resid, main='Residual Histogram', xlab='values of Residuals')
grid()
dev.off()
bitmap(file='test3.png')
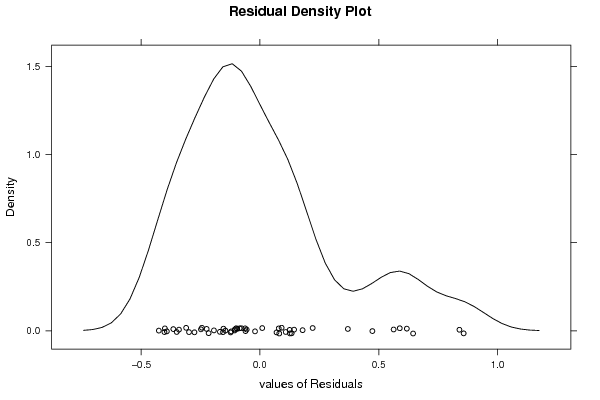
densityplot(~mysum$resid,col='black',main='Residual Density Plot', xlab='values of Residuals')
dev.off()
bitmap(file='test4.png')
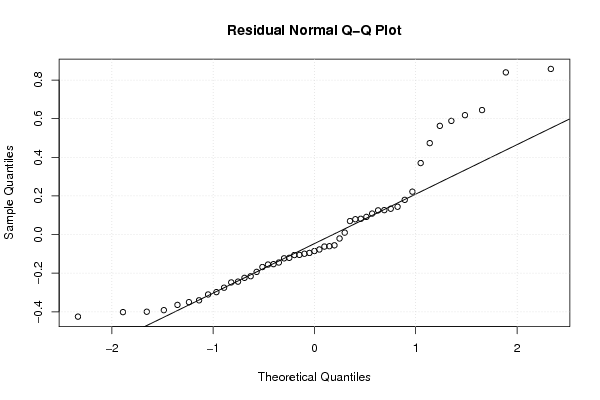
qqnorm(mysum$resid, main='Residual Normal Q-Q Plot')
qqline(mysum$resid)
grid()
dev.off()
(myerror <- as.ts(mysum$resid))
bitmap(file='test5.png')
dum <- cbind(lag(myerror,k=1),myerror)
dum
dum1 <- dum[2:length(myerror),]
dum1
z <- as.data.frame(dum1)
z
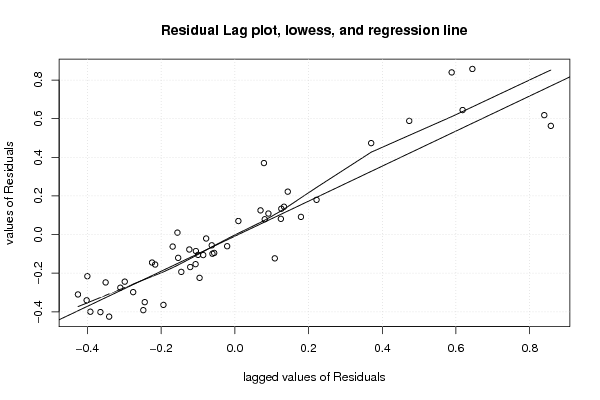
plot(z,main=paste('Residual Lag plot, lowess, and regression line'), ylab='values of Residuals', xlab='lagged values of Residuals')
lines(lowess(z))
abline(lm(z))
grid()
dev.off()
bitmap(file='test6.png')
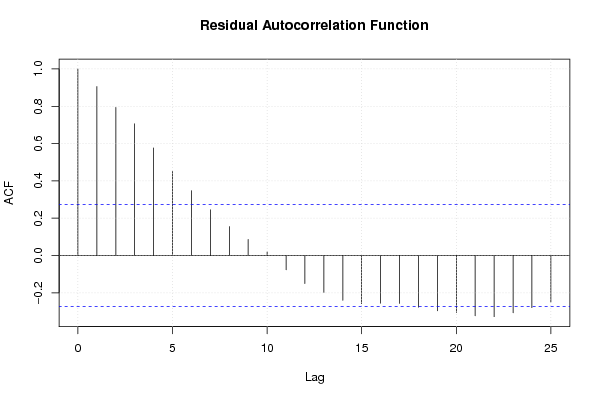
acf(mysum$resid, lag.max=length(mysum$resid)/2, main='Residual Autocorrelation Function')
grid()
dev.off()
bitmap(file='test7.png')
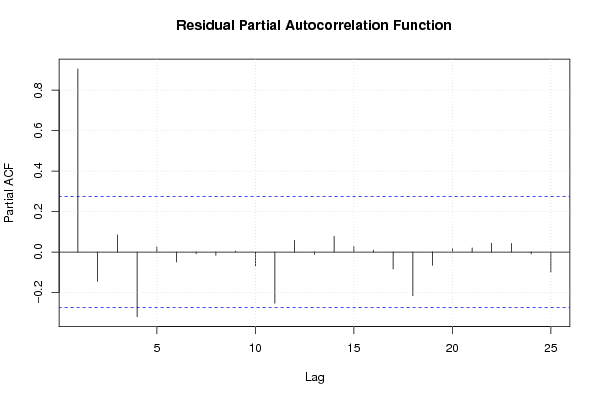
pacf(mysum$resid, lag.max=length(mysum$resid)/2, main='Residual Partial Autocorrelation Function')
grid()
dev.off()
bitmap(file='test8.png')
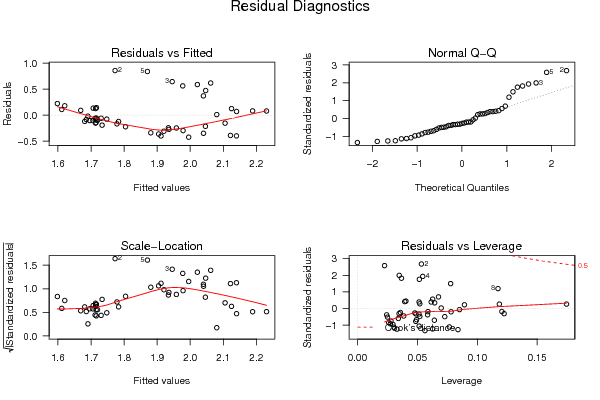
opar <- par(mfrow = c(2,2), oma = c(0, 0, 1.1, 0))
plot(mylm, las = 1, sub='Residual Diagnostics')
par(opar)
dev.off()
if (n > n25) {
bitmap(file='test9.png')
plot(kp3:nmkm3,gqarr[,2], main='Goldfeld-Quandt test',ylab='2-sided p-value',xlab='breakpoint')
grid()
dev.off()
}
load(file='createtable')
a<-table.start()
a<-table.row.start(a)
a<-table.element(a, 'Multiple Linear Regression - Estimated Regression Equation', 1, TRUE)
a<-table.row.end(a)
myeq <- colnames(x)[1]
myeq <- paste(myeq, '[t] = ', sep='')
for (i in 1:k){
if (mysum$coefficients[i,1] > 0) myeq <- paste(myeq, '+', '')
myeq <- paste(myeq, mysum$coefficients[i,1], sep=' ')
if (rownames(mysum$coefficients)[i] != '(Intercept)') {
myeq <- paste(myeq, rownames(mysum$coefficients)[i], sep='')
if (rownames(mysum$coefficients)[i] != 't') myeq <- paste(myeq, '[t]', sep='')
}
}
myeq <- paste(myeq, ' + e[t]')
a<-table.row.start(a)
a<-table.element(a, myeq)
a<-table.row.end(a)
a<-table.end(a)
table.save(a,file='mytable1.tab')
a<-table.start()
a<-table.row.start(a)
a<-table.element(a,hyperlink('ols1.htm','Multiple Linear Regression - Ordinary Least Squares',''), 6, TRUE)
a<-table.row.end(a)
a<-table.row.start(a)
a<-table.element(a,'Variable',header=TRUE)
a<-table.element(a,'Parameter',header=TRUE)
a<-table.element(a,'S.D.',header=TRUE)
a<-table.element(a,'T-STAT
H0: parameter = 0',header=TRUE)
a<-table.element(a,'2-tail p-value',header=TRUE)
a<-table.element(a,'1-tail p-value',header=TRUE)
a<-table.row.end(a)
for (i in 1:k){
a<-table.row.start(a)
a<-table.element(a,rownames(mysum$coefficients)[i],header=TRUE)
a<-table.element(a,mysum$coefficients[i,1])
a<-table.element(a, round(mysum$coefficients[i,2],6))
a<-table.element(a, round(mysum$coefficients[i,3],4))
a<-table.element(a, round(mysum$coefficients[i,4],6))
a<-table.element(a, round(mysum$coefficients[i,4]/2,6))
a<-table.row.end(a)
}
a<-table.end(a)
table.save(a,file='mytable2.tab')
a<-table.start()
a<-table.row.start(a)
a<-table.element(a, 'Multiple Linear Regression - Regression Statistics', 2, TRUE)
a<-table.row.end(a)
a<-table.row.start(a)
a<-table.element(a, 'Multiple R',1,TRUE)
a<-table.element(a, sqrt(mysum$r.squared))
a<-table.row.end(a)
a<-table.row.start(a)
a<-table.element(a, 'R-squared',1,TRUE)
a<-table.element(a, mysum$r.squared)
a<-table.row.end(a)
a<-table.row.start(a)
a<-table.element(a, 'Adjusted R-squared',1,TRUE)
a<-table.element(a, mysum$adj.r.squared)
a<-table.row.end(a)
a<-table.row.start(a)
a<-table.element(a, 'F-TEST (value)',1,TRUE)
a<-table.element(a, mysum$fstatistic[1])
a<-table.row.end(a)
a<-table.row.start(a)
a<-table.element(a, 'F-TEST (DF numerator)',1,TRUE)
a<-table.element(a, mysum$fstatistic[2])
a<-table.row.end(a)
a<-table.row.start(a)
a<-table.element(a, 'F-TEST (DF denominator)',1,TRUE)
a<-table.element(a, mysum$fstatistic[3])
a<-table.row.end(a)
a<-table.row.start(a)
a<-table.element(a, 'p-value',1,TRUE)
a<-table.element(a, 1-pf(mysum$fstatistic[1],mysum$fstatistic[2],mysum$fstatistic[3]))
a<-table.row.end(a)
a<-table.row.start(a)
a<-table.element(a, 'Multiple Linear Regression - Residual Statistics', 2, TRUE)
a<-table.row.end(a)
a<-table.row.start(a)
a<-table.element(a, 'Residual Standard Deviation',1,TRUE)
a<-table.element(a, mysum$sigma)
a<-table.row.end(a)
a<-table.row.start(a)
a<-table.element(a, 'Sum Squared Residuals',1,TRUE)
a<-table.element(a, sum(myerror*myerror))
a<-table.row.end(a)
a<-table.end(a)
table.save(a,file='mytable3.tab')
a<-table.start()
a<-table.row.start(a)
a<-table.element(a, 'Multiple Linear Regression - Actuals, Interpolation, and Residuals', 4, TRUE)
a<-table.row.end(a)
a<-table.row.start(a)
a<-table.element(a, 'Time or Index', 1, TRUE)
a<-table.element(a, 'Actuals', 1, TRUE)
a<-table.element(a, 'Interpolation
Forecast', 1, TRUE)
a<-table.element(a, 'Residuals
Prediction Error', 1, TRUE)
a<-table.row.end(a)
for (i in 1:n) {
a<-table.row.start(a)
a<-table.element(a,i, 1, TRUE)
a<-table.element(a,x[i])
a<-table.element(a,x[i]-mysum$resid[i])
a<-table.element(a,mysum$resid[i])
a<-table.row.end(a)
}
a<-table.end(a)
table.save(a,file='mytable4.tab')
if (n > n25) {
a<-table.start()
a<-table.row.start(a)
a<-table.element(a,'Goldfeld-Quandt test for Heteroskedasticity',4,TRUE)
a<-table.row.end(a)
a<-table.row.start(a)
a<-table.element(a,'p-values',header=TRUE)
a<-table.element(a,'Alternative Hypothesis',3,header=TRUE)
a<-table.row.end(a)
a<-table.row.start(a)
a<-table.element(a,'breakpoint index',header=TRUE)
a<-table.element(a,'greater',header=TRUE)
a<-table.element(a,'2-sided',header=TRUE)
a<-table.element(a,'less',header=TRUE)
a<-table.row.end(a)
for (mypoint in kp3:nmkm3) {
a<-table.row.start(a)
a<-table.element(a,mypoint,header=TRUE)
a<-table.element(a,gqarr[mypoint-kp3+1,1])
a<-table.element(a,gqarr[mypoint-kp3+1,2])
a<-table.element(a,gqarr[mypoint-kp3+1,3])
a<-table.row.end(a)
}
a<-table.end(a)
table.save(a,file='mytable5.tab')
a<-table.start()
a<-table.row.start(a)
a<-table.element(a,'Meta Analysis of Goldfeld-Quandt test for Heteroskedasticity',4,TRUE)
a<-table.row.end(a)
a<-table.row.start(a)
a<-table.element(a,'Description',header=TRUE)
a<-table.element(a,'# significant tests',header=TRUE)
a<-table.element(a,'% significant tests',header=TRUE)
a<-table.element(a,'OK/NOK',header=TRUE)
a<-table.row.end(a)
a<-table.row.start(a)
a<-table.element(a,'1% type I error level',header=TRUE)
a<-table.element(a,numsignificant1)
a<-table.element(a,numsignificant1/numgqtests)
if (numsignificant1/numgqtests < 0.01) dum <- 'OK' else dum <- 'NOK'
a<-table.element(a,dum)
a<-table.row.end(a)
a<-table.row.start(a)
a<-table.element(a,'5% type I error level',header=TRUE)
a<-table.element(a,numsignificant5)
a<-table.element(a,numsignificant5/numgqtests)
if (numsignificant5/numgqtests < 0.05) dum <- 'OK' else dum <- 'NOK'
a<-table.element(a,dum)
a<-table.row.end(a)
a<-table.row.start(a)
a<-table.element(a,'10% type I error level',header=TRUE)
a<-table.element(a,numsignificant10)
a<-table.element(a,numsignificant10/numgqtests)
if (numsignificant10/numgqtests < 0.1) dum <- 'OK' else dum <- 'NOK'
a<-table.element(a,dum)
a<-table.row.end(a)
a<-table.end(a)
table.save(a,file='mytable6.tab')
}