| Multiple Linear Regression - Estimated Regression Equation |
| Happiness[t] = + 11.7355599214145 + 0.309626719056974Leeftijd[t] + e[t] |
| Multiple Linear Regression - Ordinary Least Squares | |||||
| Variable | Parameter | S.D. | T-STAT H0: parameter = 0 | 2-tail p-value | 1-tail p-value |
| (Intercept) | 11.7355599214145 | 1.515799 | 7.7422 | 0 | 0 |
| Leeftijd | 0.309626719056974 | 0.26173 | 1.183 | 0.241554 | 0.120777 |
| Multiple Linear Regression - Regression Statistics | |
| Multiple R | 0.152218745551693 |
| R-squared | 0.0231705464973311 |
| Adjusted R-squared | 0.00661411508203169 |
| F-TEST (value) | 1.39948917228139 |
| F-TEST (DF numerator) | 1 |
| F-TEST (DF denominator) | 59 |
| p-value | 0.241554263220562 |
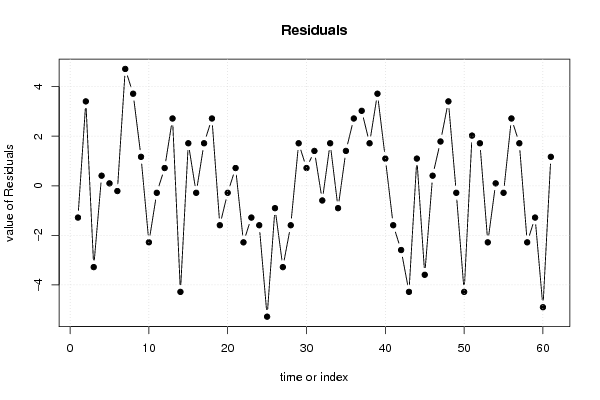
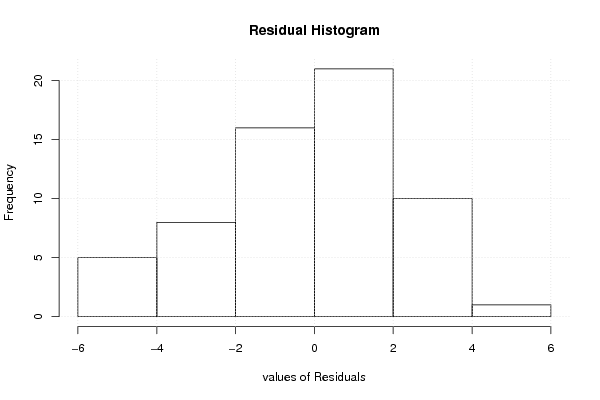
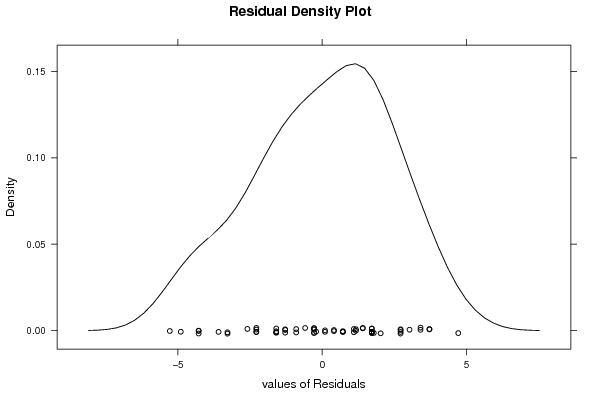
| Multiple Linear Regression - Residual Statistics | |
| Residual Standard Deviation | 2.39082414491427 |
| Sum Squared Residuals | 337.246365422397 |
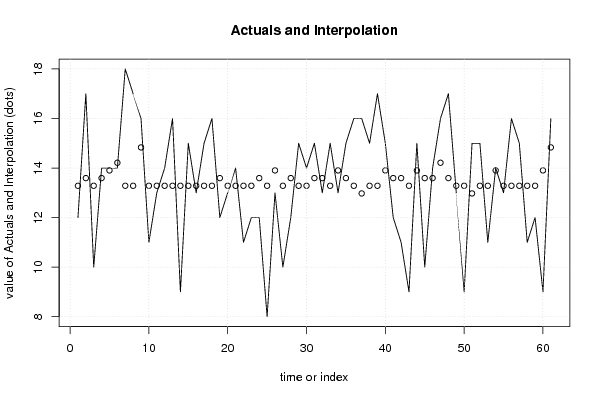
| Multiple Linear Regression - Actuals, Interpolation, and Residuals | |||
| Time or Index | Actuals | Interpolation Forecast | Residuals Prediction Error |
| 1 | 12 | 13.2836935166994 | -1.28369351669941 |
| 2 | 17 | 13.5933202357564 | 3.40667976424361 |
| 3 | 10 | 13.2836935166994 | -3.28369351669941 |
| 4 | 14 | 13.5933202357564 | 0.406679764243615 |
| 5 | 14 | 13.9029469548134 | 0.0970530451866404 |
| 6 | 14 | 14.2125736738703 | -0.212573673870334 |
| 7 | 18 | 13.2836935166994 | 4.71630648330059 |
| 8 | 17 | 13.2836935166994 | 3.71630648330059 |
| 9 | 16 | 14.8318271119843 | 1.16817288801572 |
| 10 | 11 | 13.2836935166994 | -2.28369351669941 |
| 11 | 13 | 13.2836935166994 | -0.283693516699411 |
| 12 | 14 | 13.2836935166994 | 0.716306483300589 |
| 13 | 16 | 13.2836935166994 | 2.71630648330059 |
| 14 | 9 | 13.2836935166994 | -4.28369351669941 |
| 15 | 15 | 13.2836935166994 | 1.71630648330059 |
| 16 | 13 | 13.2836935166994 | -0.283693516699411 |
| 17 | 15 | 13.2836935166994 | 1.71630648330059 |
| 18 | 16 | 13.2836935166994 | 2.71630648330059 |
| 19 | 12 | 13.5933202357564 | -1.59332023575638 |
| 20 | 13 | 13.2836935166994 | -0.283693516699411 |
| 21 | 14 | 13.2836935166994 | 0.716306483300589 |
| 22 | 11 | 13.2836935166994 | -2.28369351669941 |
| 23 | 12 | 13.2836935166994 | -1.28369351669941 |
| 24 | 12 | 13.5933202357564 | -1.59332023575638 |
| 25 | 8 | 13.2836935166994 | -5.28369351669941 |
| 26 | 13 | 13.9029469548134 | -0.90294695481336 |
| 27 | 10 | 13.2836935166994 | -3.28369351669941 |
| 28 | 12 | 13.5933202357564 | -1.59332023575638 |
| 29 | 15 | 13.2836935166994 | 1.71630648330059 |
| 30 | 14 | 13.2836935166994 | 0.716306483300589 |
| 31 | 15 | 13.5933202357564 | 1.40667976424362 |
| 32 | 13 | 13.5933202357564 | -0.593320235756385 |
| 33 | 15 | 13.2836935166994 | 1.71630648330059 |
| 34 | 13 | 13.9029469548134 | -0.90294695481336 |
| 35 | 15 | 13.5933202357564 | 1.40667976424362 |
| 36 | 16 | 13.2836935166994 | 2.71630648330059 |
| 37 | 16 | 12.9740667976424 | 3.02593320235756 |
| 38 | 15 | 13.2836935166994 | 1.71630648330059 |
| 39 | 17 | 13.2836935166994 | 3.71630648330059 |
| 40 | 15 | 13.9029469548134 | 1.09705304518664 |
| 41 | 12 | 13.5933202357564 | -1.59332023575638 |
| 42 | 11 | 13.5933202357564 | -2.59332023575638 |
| 43 | 9 | 13.2836935166994 | -4.28369351669941 |
| 44 | 15 | 13.9029469548134 | 1.09705304518664 |
| 45 | 10 | 13.5933202357564 | -3.59332023575638 |
| 46 | 14 | 13.5933202357564 | 0.406679764243615 |
| 47 | 16 | 14.2125736738703 | 1.78742632612967 |
| 48 | 17 | 13.5933202357564 | 3.40667976424362 |
| 49 | 13 | 13.2836935166994 | -0.283693516699411 |
| 50 | 9 | 13.2836935166994 | -4.28369351669941 |
| 51 | 15 | 12.9740667976424 | 2.02593320235756 |
| 52 | 15 | 13.2836935166994 | 1.71630648330059 |
| 53 | 11 | 13.2836935166994 | -2.28369351669941 |
| 54 | 14 | 13.9029469548134 | 0.0970530451866404 |
| 55 | 13 | 13.2836935166994 | -0.283693516699411 |
| 56 | 16 | 13.2836935166994 | 2.71630648330059 |
| 57 | 15 | 13.2836935166994 | 1.71630648330059 |
| 58 | 11 | 13.2836935166994 | -2.28369351669941 |
| 59 | 12 | 13.2836935166994 | -1.28369351669941 |
| 60 | 9 | 13.9029469548134 | -4.90294695481336 |
| 61 | 16 | 14.8318271119843 | 1.16817288801572 |
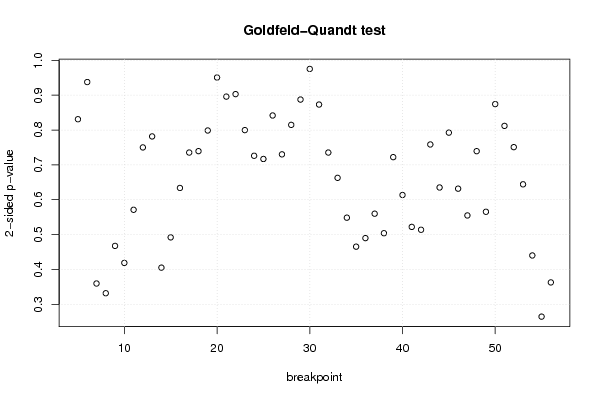
| Goldfeld-Quandt test for Heteroskedasticity | |||
| p-values | Alternative Hypothesis | ||
| breakpoint index | greater | 2-sided | less |
| 5 | 0.584452037908241 | 0.831095924183517 | 0.415547962091759 |
| 6 | 0.531096811211722 | 0.937806377576555 | 0.468903188788277 |
| 7 | 0.820203380178626 | 0.359593239642748 | 0.179796619821374 |
| 8 | 0.834137218492847 | 0.331725563014306 | 0.165862781507153 |
| 9 | 0.766257882978704 | 0.467484234042591 | 0.233742117021296 |
| 10 | 0.790635457323851 | 0.418729085352298 | 0.209364542676149 |
| 11 | 0.714411449296523 | 0.571177101406954 | 0.285588550703477 |
| 12 | 0.624936839606959 | 0.750126320786082 | 0.375063160393041 |
| 13 | 0.609132050178008 | 0.781735899643984 | 0.390867949821992 |
| 14 | 0.79742773273228 | 0.405144534535441 | 0.20257226726772 |
| 15 | 0.753991916861197 | 0.492016166277606 | 0.246008083138803 |
| 16 | 0.683109550085323 | 0.633780899829354 | 0.316890449914677 |
| 17 | 0.632271650776535 | 0.73545669844693 | 0.367728349223465 |
| 18 | 0.630254887042101 | 0.739490225915799 | 0.3697451129579 |
| 19 | 0.600626505859296 | 0.798746988281409 | 0.399373494140704 |
| 20 | 0.524604166629802 | 0.950791666740395 | 0.475395833370198 |
| 21 | 0.447978031861216 | 0.895956063722432 | 0.552021968138784 |
| 22 | 0.451540506648278 | 0.903081013296556 | 0.548459493351722 |
| 23 | 0.399909557944647 | 0.799819115889294 | 0.600090442055353 |
| 24 | 0.363085008937274 | 0.726170017874548 | 0.636914991062726 |
| 25 | 0.641503489963397 | 0.716993020073206 | 0.358496510036603 |
| 26 | 0.579104466020423 | 0.841791067959154 | 0.420895533979577 |
| 27 | 0.634848995713365 | 0.73030200857327 | 0.365151004286635 |
| 28 | 0.592570909115649 | 0.814858181768702 | 0.407429090884351 |
| 29 | 0.5562453569226 | 0.8875092861548 | 0.4437546430774 |
| 30 | 0.487675001315713 | 0.975350002631427 | 0.512324998684287 |
| 31 | 0.436608654380092 | 0.873217308760183 | 0.563391345619908 |
| 32 | 0.367712078274582 | 0.735424156549163 | 0.632287921725418 |
| 33 | 0.331430865169549 | 0.662861730339098 | 0.668569134830451 |
| 34 | 0.274243255799876 | 0.548486511599752 | 0.725756744200124 |
| 35 | 0.232667228758891 | 0.465334457517782 | 0.767332771241109 |
| 36 | 0.244931071858714 | 0.489862143717428 | 0.755068928141286 |
| 37 | 0.279972478466354 | 0.559944956932708 | 0.720027521533646 |
| 38 | 0.251983600274061 | 0.503967200548123 | 0.748016399725939 |
| 39 | 0.361095329497336 | 0.722190658994673 | 0.638904670502664 |
| 40 | 0.306812883547322 | 0.613625767094643 | 0.693187116452678 |
| 41 | 0.261015670123248 | 0.522031340246496 | 0.738984329876752 |
| 42 | 0.256918672627627 | 0.513837345255255 | 0.743081327372373 |
| 43 | 0.379295873324223 | 0.758591746648447 | 0.620704126675777 |
| 44 | 0.317584631314004 | 0.635169262628008 | 0.682415368685996 |
| 45 | 0.396284064917569 | 0.792568129835139 | 0.603715935082431 |
| 46 | 0.315908281371736 | 0.631816562743473 | 0.684091718628264 |
| 47 | 0.277466628775699 | 0.554933257551398 | 0.722533371224301 |
| 48 | 0.369699431756015 | 0.739398863512031 | 0.630300568243985 |
| 49 | 0.282709417237044 | 0.565418834474089 | 0.717290582762956 |
| 50 | 0.43724124745323 | 0.87448249490646 | 0.56275875254677 |
| 51 | 0.405986429723038 | 0.811972859446077 | 0.594013570276962 |
| 52 | 0.375470526154107 | 0.750941052308215 | 0.624529473845893 |
| 53 | 0.322140213704704 | 0.644280427409408 | 0.677859786295296 |
| 54 | 0.220036672478244 | 0.440073344956488 | 0.779963327521756 |
| 55 | 0.132250601887741 | 0.264501203775483 | 0.867749398112259 |
| 56 | 0.181379768328118 | 0.362759536656235 | 0.818620231671882 |
| Meta Analysis of Goldfeld-Quandt test for Heteroskedasticity | |||
| Description | # significant tests | % significant tests | OK/NOK |
| 1% type I error level | 0 | 0 | OK |
| 5% type I error level | 0 | 0 | OK |
| 10% type I error level | 0 | 0 | OK |