| Multiple Linear Regression - Estimated Regression Equation |
| Mannen[t] = + 267912.577777778 -6253.24444444444rente[t] + e[t] |
| Multiple Linear Regression - Ordinary Least Squares | |||||
| Variable | Parameter | S.D. | T-STAT H0: parameter = 0 | 2-tail p-value | 1-tail p-value |
| (Intercept) | 267912.577777778 | 2671.648691 | 100.2799 | 0 | 0 |
| rente | -6253.24444444444 | 5343.297382 | -1.1703 | 0.246668 | 0.123334 |
| Multiple Linear Regression - Regression Statistics | |
| Multiple R | 0.151884696481867 |
| R-squared | 0.023068961025389 |
| Adjusted R-squared | 0.0062253224223785 |
| F-TEST (value) | 1.36959487015269 |
| F-TEST (DF numerator) | 1 |
| F-TEST (DF denominator) | 58 |
| p-value | 0.246667802057424 |
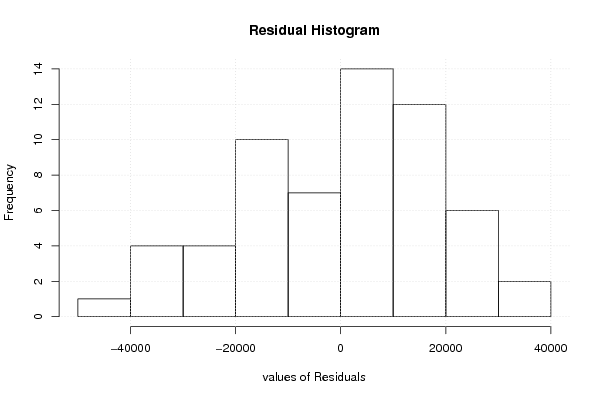
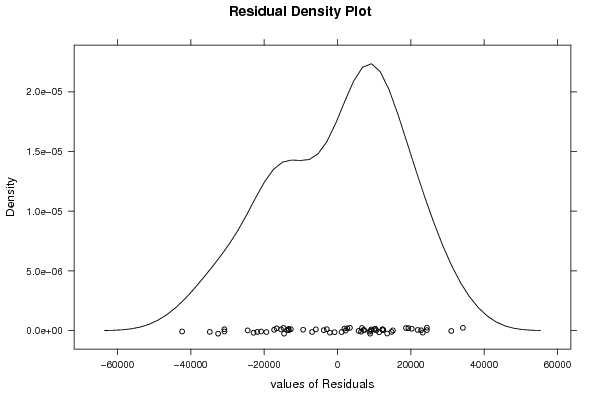
| Multiple Linear Regression - Residual Statistics | |
| Residual Standard Deviation | 17921.964256143 |
| Sum Squared Residuals | 18629414562.3111 |
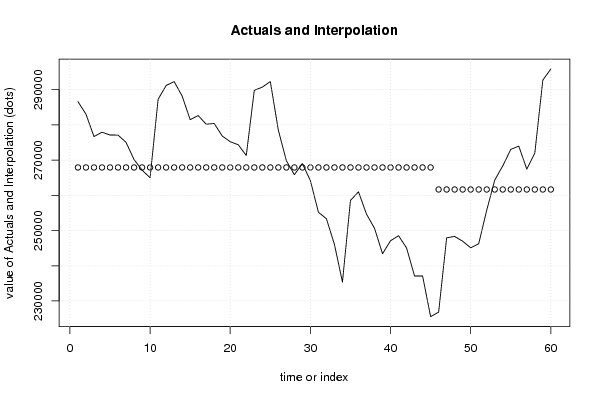
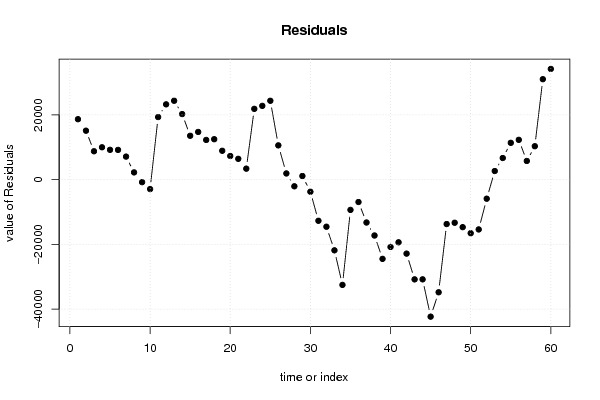
| Multiple Linear Regression - Actuals, Interpolation, and Residuals | |||
| Time or Index | Actuals | Interpolation Forecast | Residuals Prediction Error |
| 1 | 286602 | 267912.577777778 | 18689.4222222219 |
| 2 | 283042 | 267912.577777778 | 15129.4222222222 |
| 3 | 276687 | 267912.577777778 | 8774.42222222223 |
| 4 | 277915 | 267912.577777778 | 10002.4222222222 |
| 5 | 277128 | 267912.577777778 | 9215.42222222223 |
| 6 | 277103 | 267912.577777778 | 9190.42222222223 |
| 7 | 275037 | 267912.577777778 | 7124.42222222223 |
| 8 | 270150 | 267912.577777778 | 2237.42222222223 |
| 9 | 267140 | 267912.577777778 | -772.57777777777 |
| 10 | 264993 | 267912.577777778 | -2919.57777777777 |
| 11 | 287259 | 267912.577777778 | 19346.4222222222 |
| 12 | 291186 | 267912.577777778 | 23273.4222222222 |
| 13 | 292300 | 267912.577777778 | 24387.4222222222 |
| 14 | 288186 | 267912.577777778 | 20273.4222222222 |
| 15 | 281477 | 267912.577777778 | 13564.4222222222 |
| 16 | 282656 | 267912.577777778 | 14743.4222222222 |
| 17 | 280190 | 267912.577777778 | 12277.4222222222 |
| 18 | 280408 | 267912.577777778 | 12495.4222222222 |
| 19 | 276836 | 267912.577777778 | 8923.42222222223 |
| 20 | 275216 | 267912.577777778 | 7303.42222222223 |
| 21 | 274352 | 267912.577777778 | 6439.42222222223 |
| 22 | 271311 | 267912.577777778 | 3398.42222222223 |
| 23 | 289802 | 267912.577777778 | 21889.4222222222 |
| 24 | 290726 | 267912.577777778 | 22813.4222222222 |
| 25 | 292300 | 267912.577777778 | 24387.4222222222 |
| 26 | 278506 | 267912.577777778 | 10593.4222222222 |
| 27 | 269826 | 267912.577777778 | 1913.42222222223 |
| 28 | 265861 | 267912.577777778 | -2051.57777777777 |
| 29 | 269034 | 267912.577777778 | 1121.42222222223 |
| 30 | 264176 | 267912.577777778 | -3736.57777777777 |
| 31 | 255198 | 267912.577777778 | -12714.5777777778 |
| 32 | 253353 | 267912.577777778 | -14559.5777777778 |
| 33 | 246057 | 267912.577777778 | -21855.5777777778 |
| 34 | 235372 | 267912.577777778 | -32540.5777777778 |
| 35 | 258556 | 267912.577777778 | -9356.57777777777 |
| 36 | 260993 | 267912.577777778 | -6919.57777777777 |
| 37 | 254663 | 267912.577777778 | -13249.5777777778 |
| 38 | 250643 | 267912.577777778 | -17269.5777777778 |
| 39 | 243422 | 267912.577777778 | -24490.5777777778 |
| 40 | 247105 | 267912.577777778 | -20807.5777777778 |
| 41 | 248541 | 267912.577777778 | -19371.5777777778 |
| 42 | 245039 | 267912.577777778 | -22873.5777777778 |
| 43 | 237080 | 267912.577777778 | -30832.5777777778 |
| 44 | 237085 | 267912.577777778 | -30827.5777777778 |
| 45 | 225554 | 267912.577777778 | -42358.5777777778 |
| 46 | 226839 | 261659.333333333 | -34820.3333333333 |
| 47 | 247934 | 261659.333333333 | -13725.3333333333 |
| 48 | 248333 | 261659.333333333 | -13326.3333333333 |
| 49 | 246969 | 261659.333333333 | -14690.3333333333 |
| 50 | 245098 | 261659.333333333 | -16561.3333333333 |
| 51 | 246263 | 261659.333333333 | -15396.3333333333 |
| 52 | 255765 | 261659.333333333 | -5894.33333333333 |
| 53 | 264319 | 261659.333333333 | 2659.66666666667 |
| 54 | 268347 | 261659.333333333 | 6687.66666666667 |
| 55 | 273046 | 261659.333333333 | 11386.6666666667 |
| 56 | 273963 | 261659.333333333 | 12303.6666666667 |
| 57 | 267430 | 261659.333333333 | 5770.66666666667 |
| 58 | 271993 | 261659.333333333 | 10333.6666666667 |
| 59 | 292710 | 261659.333333333 | 31050.6666666667 |
| 60 | 295881 | 261659.333333333 | 34221.6666666667 |
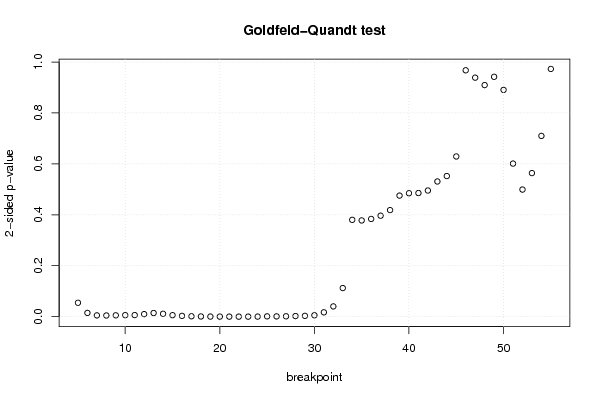
| Goldfeld-Quandt test for Heteroskedasticity | |||
| p-values | Alternative Hypothesis | ||
| breakpoint index | greater | 2-sided | less |
| 5 | 0.027289512898536 | 0.054579025797072 | 0.972710487101464 |
| 6 | 0.00740811672593794 | 0.0148162334518759 | 0.992591883274062 |
| 7 | 0.00253702284269952 | 0.00507404568539903 | 0.9974629771573 |
| 8 | 0.0023144366825155 | 0.004628873365031 | 0.997685563317484 |
| 9 | 0.0026572683680663 | 0.0053145367361326 | 0.997342731631934 |
| 10 | 0.00295950215893887 | 0.00591900431787774 | 0.99704049784106 |
| 11 | 0.00313045295485721 | 0.00626090590971441 | 0.996869547045143 |
| 12 | 0.00500917893602989 | 0.0100183578720598 | 0.99499082106397 |
| 13 | 0.00717621196404921 | 0.0143524239280984 | 0.99282378803595 |
| 14 | 0.00566421118652252 | 0.011328422373045 | 0.994335788813478 |
| 15 | 0.00293032134310245 | 0.0058606426862049 | 0.997069678656898 |
| 16 | 0.00157566451334914 | 0.00315132902669828 | 0.99842433548665 |
| 17 | 0.00078308732082057 | 0.00156617464164114 | 0.99921691267918 |
| 18 | 0.00039140145246029 | 0.00078280290492058 | 0.99960859854754 |
| 19 | 0.000195314520854545 | 0.00039062904170909 | 0.999804685479145 |
| 20 | 0.000102378861873729 | 0.000204757723747458 | 0.999897621138126 |
| 21 | 5.56853980804258e-05 | 0.000111370796160852 | 0.99994431460192 |
| 22 | 3.73313706641157e-05 | 7.46627413282313e-05 | 0.999962668629336 |
| 23 | 6.69654652638736e-05 | 0.000133930930527747 | 0.999933034534736 |
| 24 | 0.000158168276335494 | 0.000316336552670987 | 0.999841831723664 |
| 25 | 0.000601868763757596 | 0.00120373752751519 | 0.999398131236242 |
| 26 | 0.000595351383861805 | 0.00119070276772361 | 0.999404648616138 |
| 27 | 0.000742565808823788 | 0.00148513161764758 | 0.999257434191176 |
| 28 | 0.00121565640400222 | 0.00243131280800443 | 0.998784343595998 |
| 29 | 0.00160413678016423 | 0.00320827356032845 | 0.998395863219836 |
| 30 | 0.00275199744036401 | 0.00550399488072801 | 0.997248002559636 |
| 31 | 0.00852247017103957 | 0.0170449403420791 | 0.99147752982896 |
| 32 | 0.0201196901533705 | 0.040239380306741 | 0.97988030984663 |
| 33 | 0.0561846865497266 | 0.112369373099453 | 0.943815313450273 |
| 34 | 0.19011332851186 | 0.380226657023719 | 0.80988667148814 |
| 35 | 0.188939007175252 | 0.377878014350504 | 0.811060992824748 |
| 36 | 0.191836420240464 | 0.383672840480927 | 0.808163579759536 |
| 37 | 0.198224596559514 | 0.396449193119028 | 0.801775403440486 |
| 38 | 0.209277569801611 | 0.418555139603223 | 0.790722430198389 |
| 39 | 0.237676426205206 | 0.475352852410412 | 0.762323573794794 |
| 40 | 0.242400978913519 | 0.484801957827037 | 0.757599021086481 |
| 41 | 0.242743154096923 | 0.485486308193845 | 0.757256845903077 |
| 42 | 0.247689667908432 | 0.495379335816864 | 0.752310332091568 |
| 43 | 0.265417898132186 | 0.530835796264372 | 0.734582101867814 |
| 44 | 0.276107726324627 | 0.552215452649253 | 0.723892273675373 |
| 45 | 0.31450472382757 | 0.629009447655141 | 0.68549527617243 |
| 46 | 0.483717751234171 | 0.967435502468343 | 0.516282248765829 |
| 47 | 0.469264979812257 | 0.938529959624514 | 0.530735020187743 |
| 48 | 0.454676669192868 | 0.909353338385735 | 0.545323330807132 |
| 49 | 0.470918231705179 | 0.941836463410359 | 0.529081768294821 |
| 50 | 0.554770575200205 | 0.89045884959959 | 0.445229424799795 |
| 51 | 0.699423295134775 | 0.601153409730451 | 0.300576704865225 |
| 52 | 0.750414457147423 | 0.499171085705154 | 0.249585542852577 |
| 53 | 0.718067475589595 | 0.56386504882081 | 0.281932524410405 |
| 54 | 0.645079126420356 | 0.709841747159289 | 0.354920873579644 |
| 55 | 0.513639362940099 | 0.972721274119802 | 0.486360637059901 |
| Meta Analysis of Goldfeld-Quandt test for Heteroskedasticity | |||
| Description | # significant tests | % significant tests | OK/NOK |
| 1% type I error level | 21 | 0.411764705882353 | NOK |
| 5% type I error level | 27 | 0.529411764705882 | NOK |
| 10% type I error level | 28 | 0.549019607843137 | NOK |