| Multiple Linear Regression - Estimated Regression Equation |
| totaleslaap[t] = + 15.9045939067489 -1.6117594600388e-06gewicht[t] + 2.07321499875609e-06brein[t] -0.0477119610443166levensduur[t] -0.0119939929006805drachttijd[t] + 2.07493347685895`jager?`[t] + 0.313113835483447blootgesteldheidslaap[t] -3.84823801074653algemeengevaar[t] + e[t] |
| Multiple Linear Regression - Ordinary Least Squares | |||||
| Variable | Parameter | S.D. | T-STAT H0: parameter = 0 | 2-tail p-value | 1-tail p-value |
| (Intercept) | 15.9045939067489 | 1.068495 | 14.885 | 0 | 0 |
| gewicht | -1.6117594600388e-06 | 2e-06 | -1.0257 | 0.309993 | 0.154996 |
| brein | 2.07321499875609e-06 | 2e-06 | 1.2004 | 0.235647 | 0.117823 |
| levensduur | -0.0477119610443166 | 0.037131 | -1.285 | 0.204727 | 0.102363 |
| drachttijd | -0.0119939929006805 | 0.006433 | -1.8643 | 0.06815 | 0.034075 |
| `jager?` | 2.07493347685895 | 0.891892 | 2.3264 | 0.024088 | 0.012044 |
| blootgesteldheidslaap | 0.313113835483447 | 0.580145 | 0.5397 | 0.591788 | 0.295894 |
| algemeengevaar | -3.84823801074653 | 1.107553 | -3.4745 | 0.001067 | 0.000533 |
| Multiple Linear Regression - Regression Statistics | |
| Multiple R | 0.7741492855136 |
| R-squared | 0.599307116261218 |
| Adjusted R-squared | 0.543210112537789 |
| F-TEST (value) | 10.6834068931013 |
| F-TEST (DF numerator) | 7 |
| F-TEST (DF denominator) | 50 |
| p-value | 3.88024755659799e-08 |
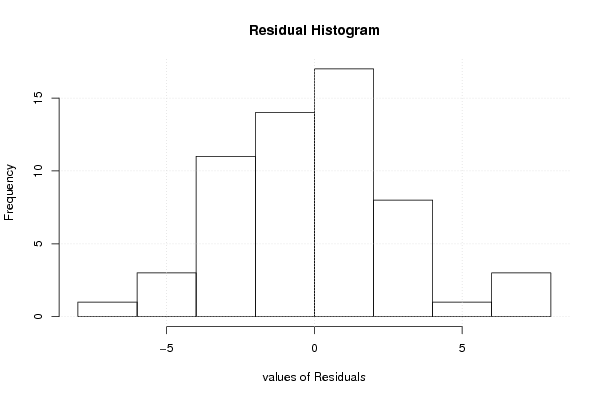
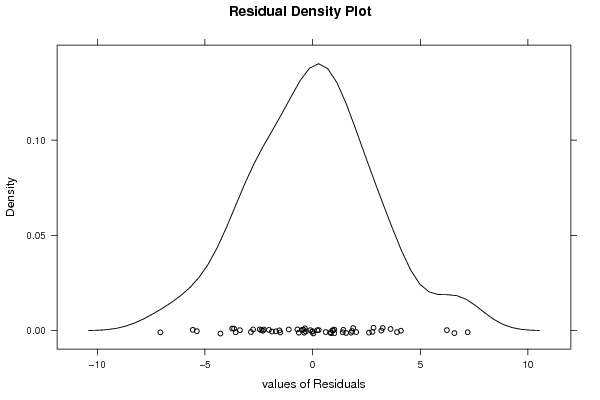
| Multiple Linear Regression - Residual Statistics | |
| Residual Standard Deviation | 3.11353581179839 |
| Sum Squared Residuals | 484.705262567553 |
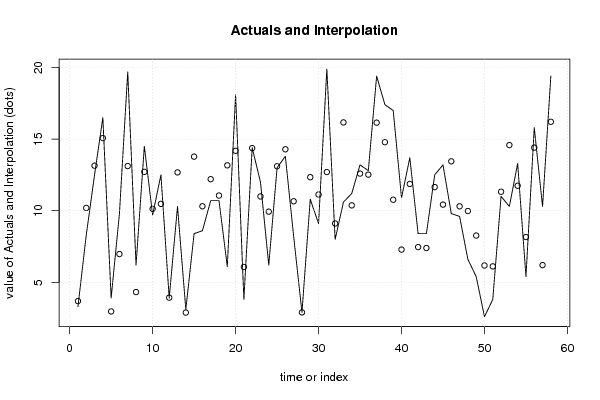
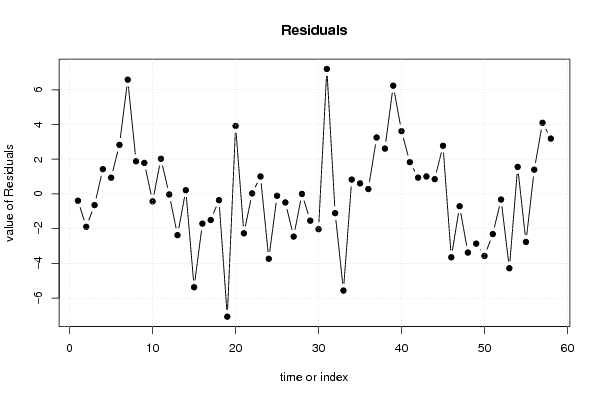
| Multiple Linear Regression - Actuals, Interpolation, and Residuals | |||
| Time or Index | Actuals | Interpolation Forecast | Residuals Prediction Error |
| 1 | 3.3 | 3.68999899105046 | -0.389998991050456 |
| 2 | 8.3 | 10.1914140735733 | -1.89141407357333 |
| 3 | 12.5 | 13.1435984413559 | -0.643598441355881 |
| 4 | 16.5 | 15.0727409499281 | 1.42725905007187 |
| 5 | 3.9 | 2.96349188422981 | 0.93650811577019 |
| 6 | 9.8 | 6.97182747278661 | 2.82817252721339 |
| 7 | 19.7 | 13.1180867818729 | 6.58191321812707 |
| 8 | 6.2 | 4.31734793698538 | 1.88265206301462 |
| 9 | 14.5 | 12.7137160795945 | 1.78628392040553 |
| 10 | 9.7 | 10.1283320149894 | -0.428332014989438 |
| 11 | 12.5 | 10.4747215487991 | 2.02527845120087 |
| 12 | 3.9 | 3.92947137386328 | -0.0294713738632782 |
| 13 | 10.3 | 12.6760735039865 | -2.37607350398647 |
| 14 | 3.1 | 2.8844714537127 | 0.215528546287296 |
| 15 | 8.4 | 13.7761513799776 | -5.37615137997759 |
| 16 | 8.6 | 10.3097777530945 | -1.70977775309451 |
| 17 | 10.7 | 12.2014480291106 | -1.50144802911059 |
| 18 | 10.7 | 11.0590947196399 | -0.359094719639937 |
| 19 | 6.1 | 13.169319049961 | -7.06931904996099 |
| 20 | 18.1 | 14.1816443283314 | 3.91835567166857 |
| 21 | 3.8 | 6.06812870273344 | -2.26812870273344 |
| 22 | 14.4 | 14.37012463842 | 0.0298753615799922 |
| 23 | 12 | 10.9942695160489 | 1.00573048395112 |
| 24 | 6.2 | 9.93309799777611 | -3.73309799777611 |
| 25 | 13 | 13.1050418578521 | -0.105041857852073 |
| 26 | 13.8 | 14.2907143408769 | -0.490714340876903 |
| 27 | 8.2 | 10.6571747859795 | -2.45717478597949 |
| 28 | 2.9 | 2.89713773756602 | 0.00286226243397486 |
| 29 | 10.8 | 12.3405747996848 | -1.54057479968481 |
| 30 | 9.1 | 11.1306152551359 | -2.03061525513585 |
| 31 | 19.9 | 12.6996170004333 | 7.20038299956674 |
| 32 | 8 | 9.10752571126701 | -1.107525711267 |
| 33 | 10.6 | 16.1657363465449 | -5.56573634654488 |
| 34 | 11.2 | 10.3726816262578 | 0.827318373742169 |
| 35 | 13.2 | 12.5921642691893 | 0.607835730810676 |
| 36 | 12.8 | 12.517484515116 | 0.282515484884019 |
| 37 | 19.4 | 16.147170228584 | 3.25282977141597 |
| 38 | 17.4 | 14.7866793542104 | 2.61332064578961 |
| 39 | 17 | 10.7646440301497 | 6.23535596985029 |
| 40 | 10.9 | 7.28337283717803 | 3.61662716282197 |
| 41 | 13.7 | 11.86796890223 | 1.83203109776997 |
| 42 | 8.4 | 7.46001986480618 | 0.939980135193815 |
| 43 | 8.4 | 7.39406783884428 | 1.00593216115572 |
| 44 | 12.5 | 11.6492958942772 | 0.850704105722814 |
| 45 | 13.2 | 10.425612729952 | 2.77438727004801 |
| 46 | 9.8 | 13.4508025938991 | -3.65080259389908 |
| 47 | 9.6 | 10.3068101598763 | -0.706810159876341 |
| 48 | 6.6 | 9.97707971564237 | -3.37707971564237 |
| 49 | 5.4 | 8.26372298805175 | -2.86372298805175 |
| 50 | 2.6 | 6.17312546195823 | -3.57312546195823 |
| 51 | 3.8 | 6.11166824058929 | -2.31166824058929 |
| 52 | 11 | 11.3224699678569 | -0.322469967856933 |
| 53 | 10.3 | 14.5811134059542 | -4.28111340595419 |
| 54 | 13.3 | 11.7421441841302 | 1.55785581586985 |
| 55 | 5.4 | 8.16343287816573 | -2.76343287816572 |
| 56 | 15.8 | 14.4028676728402 | 1.39713232715977 |
| 57 | 10.3 | 6.20038490123268 | 4.09961509876732 |
| 58 | 19.4 | 16.2107292818462 | 3.18927071815378 |
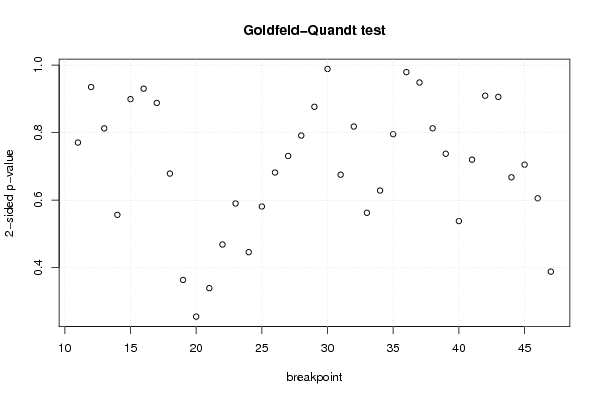
| Goldfeld-Quandt test for Heteroskedasticity | |||
| p-values | Alternative Hypothesis | ||
| breakpoint index | greater | 2-sided | less |
| 11 | 0.614755894616575 | 0.77048821076685 | 0.385244105383425 |
| 12 | 0.467499827809316 | 0.934999655618633 | 0.532500172190684 |
| 13 | 0.406286505951506 | 0.812573011903012 | 0.593713494048494 |
| 14 | 0.27811602639083 | 0.556232052781661 | 0.721883973609169 |
| 15 | 0.449518550907453 | 0.899037101814907 | 0.550481449092547 |
| 16 | 0.534928178312483 | 0.930143643375035 | 0.465071821687517 |
| 17 | 0.443930081100837 | 0.887860162201674 | 0.556069918899163 |
| 18 | 0.339257387133052 | 0.678514774266105 | 0.660742612866948 |
| 19 | 0.818319886595128 | 0.363360226809745 | 0.181680113404872 |
| 20 | 0.872710592446513 | 0.254578815106974 | 0.127289407553487 |
| 21 | 0.830516082951198 | 0.338967834097604 | 0.169483917048802 |
| 22 | 0.765825156522158 | 0.468349686955683 | 0.234174843477842 |
| 23 | 0.705057012631802 | 0.589885974736396 | 0.294942987368198 |
| 24 | 0.777205910143931 | 0.445588179712139 | 0.222794089856069 |
| 25 | 0.709507208465846 | 0.580985583068307 | 0.290492791534154 |
| 26 | 0.659156007087861 | 0.681687985824277 | 0.340843992912139 |
| 27 | 0.634622024567474 | 0.730755950865053 | 0.365377975432526 |
| 28 | 0.604399894248257 | 0.791200211503485 | 0.395600105751743 |
| 29 | 0.561794044746233 | 0.876411910507534 | 0.438205955253767 |
| 30 | 0.50571791865637 | 0.988564162687261 | 0.49428208134363 |
| 31 | 0.662409543354339 | 0.675180913291323 | 0.337590456645661 |
| 32 | 0.591028994923513 | 0.817942010152974 | 0.408971005076487 |
| 33 | 0.718863860665085 | 0.562272278669829 | 0.281136139334915 |
| 34 | 0.685861936661564 | 0.628276126676873 | 0.314138063338436 |
| 35 | 0.602393244815577 | 0.795213510368846 | 0.397606755184423 |
| 36 | 0.5104330656574 | 0.9791338686852 | 0.4895669343426 |
| 37 | 0.474198179459268 | 0.948396358918536 | 0.525801820540732 |
| 38 | 0.406345607518114 | 0.812691215036228 | 0.593654392481886 |
| 39 | 0.631368385176618 | 0.737263229646765 | 0.368631614823382 |
| 40 | 0.73114269182318 | 0.537714616353641 | 0.26885730817682 |
| 41 | 0.640105879225258 | 0.719788241549483 | 0.359894120774742 |
| 42 | 0.545403131730019 | 0.909193736539963 | 0.454596868269981 |
| 43 | 0.452924006374488 | 0.905848012748976 | 0.547075993625512 |
| 44 | 0.333769871765024 | 0.667539743530047 | 0.666230128234977 |
| 45 | 0.352458939626752 | 0.704917879253504 | 0.647541060373248 |
| 46 | 0.302685810843434 | 0.605371621686868 | 0.697314189156566 |
| 47 | 0.193976446469197 | 0.387952892938394 | 0.806023553530803 |
| Meta Analysis of Goldfeld-Quandt test for Heteroskedasticity | |||
| Description | # significant tests | % significant tests | OK/NOK |
| 1% type I error level | 0 | 0 | OK |
| 5% type I error level | 0 | 0 | OK |
| 10% type I error level | 0 | 0 | OK |