| Multiple Linear Regression - Estimated Regression Equation |
| totaleslaap[t] = + 10.2314152443998 -9.30667342550917e-07gewicht[t] + 1.39853576241897e-06brein[t] + 0.538124315062497nietdroomslaap[t] + 0.13805574568951droomslaap[t] -0.0423038850739984levensduur[t] -0.00670493165598979drachttijd[t] + 0.693102682433721`jager?`[t] + 0.342226565964136blootgesteldheidslaap[t] -2.1280216343138algemeengevaar[t] + e[t] |
| Multiple Linear Regression - Ordinary Least Squares | |||||
| Variable | Parameter | S.D. | T-STAT H0: parameter = 0 | 2-tail p-value | 1-tail p-value |
| (Intercept) | 10.2314152443998 | 1.428993 | 7.1599 | 0 | 0 |
| gewicht | -9.30667342550917e-07 | 2e-06 | -0.5894 | 0.558134 | 0.279067 |
| brein | 1.39853576241897e-06 | 2e-06 | 0.7993 | 0.427769 | 0.213885 |
| nietdroomslaap | 0.538124315062497 | 0.118912 | 4.5254 | 3.5e-05 | 1.8e-05 |
| droomslaap | 0.13805574568951 | 0.39216 | 0.352 | 0.726231 | 0.363116 |
| levensduur | -0.0423038850739984 | 0.036911 | -1.1461 | 0.257 | 0.1285 |
| drachttijd | -0.00670493165598979 | 0.005353 | -1.2526 | 0.215943 | 0.107971 |
| `jager?` | 0.693102682433721 | 0.749099 | 0.9252 | 0.359111 | 0.179555 |
| blootgesteldheidslaap | 0.342226565964136 | 0.550863 | 0.6213 | 0.537146 | 0.268573 |
| algemeengevaar | -2.1280216343138 | 0.976056 | -2.1802 | 0.03379 | 0.016895 |
| Multiple Linear Regression - Regression Statistics | |
| Multiple R | 0.843092874360912 |
| R-squared | 0.710805594798144 |
| Adjusted R-squared | 0.660752716974746 |
| F-TEST (value) | 14.2010934377457 |
| F-TEST (DF numerator) | 9 |
| F-TEST (DF denominator) | 52 |
| p-value | 3.21528359492618e-11 |
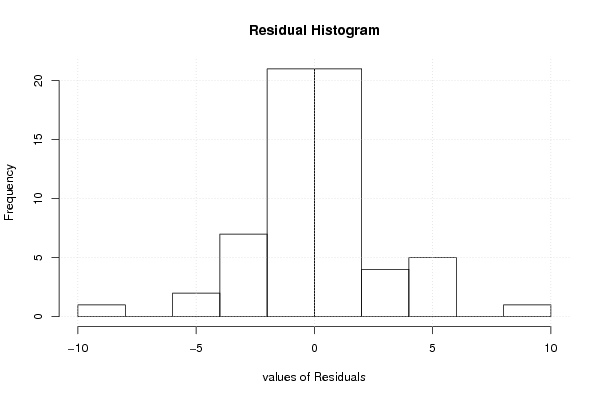
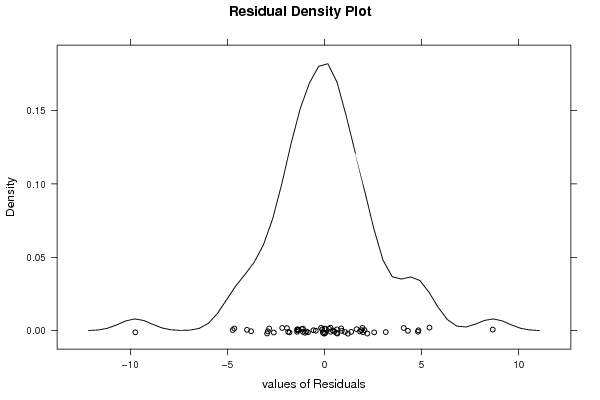
| Multiple Linear Regression - Residual Statistics | |
| Residual Standard Deviation | 3.00602419837397 |
| Sum Squared Residuals | 469.881437022914 |
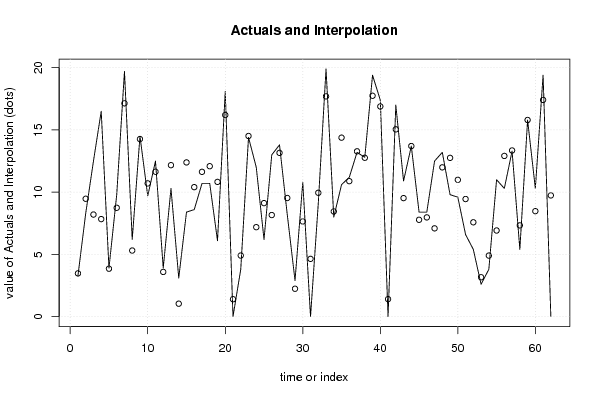
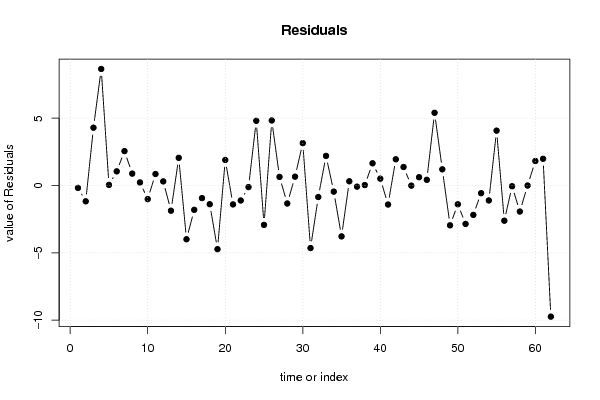
| Multiple Linear Regression - Actuals, Interpolation, and Residuals | |||
| Time or Index | Actuals | Interpolation Forecast | Residuals Prediction Error |
| 1 | 3.3 | 3.47595611421389 | -0.175956114213889 |
| 2 | 8.3 | 9.47150468730132 | -1.17150468730132 |
| 3 | 12.5 | 8.20325710056161 | 4.29674289943839 |
| 4 | 16.5 | 7.83766439178738 | 8.66233560821262 |
| 5 | 3.9 | 3.85253595763266 | 0.0474640423673386 |
| 6 | 9.8 | 8.74634202360161 | 1.05365797639839 |
| 7 | 19.7 | 17.1410584184502 | 2.55894158154982 |
| 8 | 6.2 | 5.31224890435779 | 0.887751095642206 |
| 9 | 14.5 | 14.2693169799997 | 0.230683020000343 |
| 10 | 9.7 | 10.7079163097672 | -1.00791630976723 |
| 11 | 12.5 | 11.6420701597485 | 0.857929840251478 |
| 12 | 3.9 | 3.59220811066673 | 0.307791889333273 |
| 13 | 10.3 | 12.1696551884032 | -1.86965518840321 |
| 14 | 3.1 | 1.04035648208618 | 2.05964351791382 |
| 15 | 8.4 | 12.3908305551299 | -3.99083055512986 |
| 16 | 8.6 | 10.4031386340706 | -1.80313863407059 |
| 17 | 10.7 | 11.6331432139064 | -0.933143213906442 |
| 18 | 10.7 | 12.0863186496793 | -1.38631864967933 |
| 19 | 6.1 | 10.8282486485177 | -4.72824864851774 |
| 20 | 18.1 | 16.1996688486247 | 1.90033115137527 |
| 21 | 0 | 1.40156988829456 | -1.40156988829456 |
| 22 | 3.8 | 4.90947319478787 | -1.10947319478787 |
| 23 | 14.4 | 14.5147979558672 | -0.114797955867223 |
| 24 | 12 | 7.18837447529278 | 4.81162552470722 |
| 25 | 6.2 | 9.12187318701871 | -2.92187318701871 |
| 26 | 13 | 8.16430310501193 | 4.83569689498807 |
| 27 | 13.8 | 13.158093728604 | 0.641906271395963 |
| 28 | 8.2 | 9.53336551870708 | -1.33336551870708 |
| 29 | 2.9 | 2.24078646210187 | 0.659213537898131 |
| 30 | 10.8 | 7.64712604767201 | 3.15287395232799 |
| 31 | 0 | 4.64469815861881 | -4.64469815861881 |
| 32 | 9.1 | 9.95198458053353 | -0.851984580533534 |
| 33 | 19.9 | 17.6967201052334 | 2.20327989476659 |
| 34 | 8 | 8.45134766878095 | -0.451347668780946 |
| 35 | 10.6 | 14.378826258151 | -3.77882625815104 |
| 36 | 11.2 | 10.8840351034229 | 0.315964896577069 |
| 37 | 13.2 | 13.2823738601059 | -0.0823738601058733 |
| 38 | 12.8 | 12.7640864282285 | 0.0359135717714938 |
| 39 | 19.4 | 17.7463033002203 | 1.65369669977966 |
| 40 | 17.4 | 16.8872558567842 | 0.512744143215785 |
| 41 | 0 | 1.41008313207532 | -1.41008313207532 |
| 42 | 17 | 15.0493602086296 | 1.95063979137038 |
| 43 | 10.9 | 9.52328710172123 | 1.37671289827878 |
| 44 | 13.7 | 13.7064848805715 | -0.00648488057146583 |
| 45 | 8.4 | 7.78053593548121 | 0.619464064518791 |
| 46 | 8.4 | 7.97340865061064 | 0.426591349389362 |
| 47 | 12.5 | 7.09488845304876 | 5.40511154695124 |
| 48 | 13.2 | 11.9949727659171 | 1.20502723408292 |
| 49 | 9.8 | 12.7554868859947 | -2.95548688599473 |
| 50 | 9.6 | 10.9917560846998 | -1.39175608469983 |
| 51 | 6.6 | 9.45005371330628 | -2.85005371330628 |
| 52 | 5.4 | 7.58053445287477 | -2.18053445287477 |
| 53 | 2.6 | 3.16658193534318 | -0.566581935343184 |
| 54 | 3.8 | 4.90735390981113 | -1.10735390981113 |
| 55 | 11 | 6.92150604583973 | 4.07849395416027 |
| 56 | 10.3 | 12.912771063724 | -2.61277106372405 |
| 57 | 13.3 | 13.3516715605664 | -0.0516715605664345 |
| 58 | 5.4 | 7.33179715731442 | -1.93179715731442 |
| 59 | 15.8 | 15.7990895033903 | 0.000910496609745418 |
| 60 | 10.3 | 8.47494512681304 | 1.82505487318696 |
| 61 | 19.4 | 17.412400950637 | 1.98759904936303 |
| 62 | 0 | 9.74019621968551 | -9.74019621968551 |
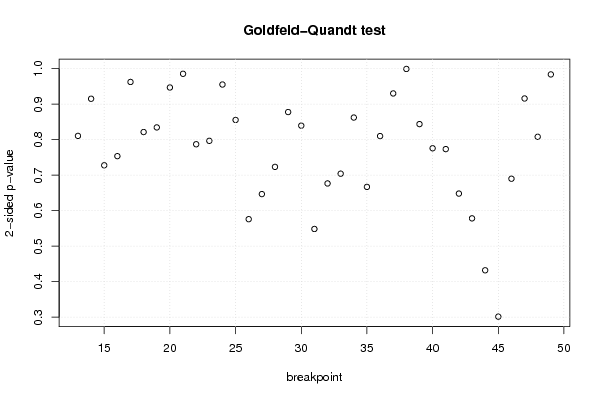
| Goldfeld-Quandt test for Heteroskedasticity | |||
| p-values | Alternative Hypothesis | ||
| breakpoint index | greater | 2-sided | less |
| 13 | 0.594663038766477 | 0.810673922467046 | 0.405336961233523 |
| 14 | 0.457654349171227 | 0.915308698342453 | 0.542345650828773 |
| 15 | 0.636027565225735 | 0.72794486954853 | 0.363972434774265 |
| 16 | 0.623173974955708 | 0.753652050088584 | 0.376826025044292 |
| 17 | 0.518684140157398 | 0.962631719685204 | 0.481315859842602 |
| 18 | 0.410762623481235 | 0.821525246962469 | 0.589237376518765 |
| 19 | 0.582708583797863 | 0.834582832404274 | 0.417291416202137 |
| 20 | 0.526468043164469 | 0.947063913671062 | 0.473531956835531 |
| 21 | 0.492814857480606 | 0.985629714961212 | 0.507185142519394 |
| 22 | 0.393591998164316 | 0.787183996328631 | 0.606408001835684 |
| 23 | 0.398407379214469 | 0.796814758428939 | 0.601592620785531 |
| 24 | 0.477714240970184 | 0.955428481940369 | 0.522285759029816 |
| 25 | 0.572172911981022 | 0.855654176037955 | 0.427827088018978 |
| 26 | 0.711935367891666 | 0.576129264216667 | 0.288064632108333 |
| 27 | 0.676595673300316 | 0.646808653399367 | 0.323404326699684 |
| 28 | 0.638301369277794 | 0.723397261444413 | 0.361698630722206 |
| 29 | 0.561043745387045 | 0.87791250922591 | 0.438956254612955 |
| 30 | 0.580235357027546 | 0.839529285944909 | 0.419764642972454 |
| 31 | 0.725727052101839 | 0.548545895796322 | 0.274272947898161 |
| 32 | 0.661632193255025 | 0.67673561348995 | 0.338367806744975 |
| 33 | 0.647865590389961 | 0.704268819220077 | 0.352134409610039 |
| 34 | 0.568803481527681 | 0.862393036944637 | 0.431196518472319 |
| 35 | 0.666507606308035 | 0.66698478738393 | 0.333492393691965 |
| 36 | 0.594908798089519 | 0.810182403820961 | 0.40509120191048 |
| 37 | 0.534854246175278 | 0.930291507649443 | 0.465145753824722 |
| 38 | 0.499639841991309 | 0.999279683982618 | 0.500360158008691 |
| 39 | 0.421984808298358 | 0.843969616596716 | 0.578015191701642 |
| 40 | 0.387912666694313 | 0.775825333388627 | 0.612087333305687 |
| 41 | 0.386772778861517 | 0.773545557723033 | 0.613227221138483 |
| 42 | 0.324118983085215 | 0.64823796617043 | 0.675881016914785 |
| 43 | 0.28923803290313 | 0.57847606580626 | 0.71076196709687 |
| 44 | 0.216107941891516 | 0.432215883783032 | 0.783892058108484 |
| 45 | 0.150782618401525 | 0.30156523680305 | 0.849217381598475 |
| 46 | 0.345020222965174 | 0.690040445930347 | 0.654979777034826 |
| 47 | 0.541967771905574 | 0.916064456188851 | 0.458032228094426 |
| 48 | 0.40410991079848 | 0.808219821596959 | 0.59589008920152 |
| 49 | 0.491950717343851 | 0.983901434687701 | 0.508049282656149 |
| Meta Analysis of Goldfeld-Quandt test for Heteroskedasticity | |||
| Description | # significant tests | % significant tests | OK/NOK |
| 1% type I error level | 0 | 0 | OK |
| 5% type I error level | 0 | 0 | OK |
| 10% type I error level | 0 | 0 | OK |