| Multiple Linear Regression - Estimated Regression Equation |
| vertrouwen[t] = -32.9128082466274 + 0.80852988836357CPI[t] + 2.85111894983952Werkloosheid[t] + 0.70116828621066Rente[t] + e[t] |
| Multiple Linear Regression - Ordinary Least Squares | |||||
| Variable | Parameter | S.D. | T-STAT H0: parameter = 0 | 2-tail p-value | 1-tail p-value |
| (Intercept) | -32.9128082466274 | 14.176454 | -2.3217 | 0.023915 | 0.011957 |
| CPI | 0.80852988836357 | 0.650364 | 1.2432 | 0.218976 | 0.109488 |
| Werkloosheid | 2.85111894983952 | 1.740191 | 1.6384 | 0.106947 | 0.053473 |
| Rente | 0.70116828621066 | 0.862928 | 0.8125 | 0.419919 | 0.20996 |
| Multiple Linear Regression - Regression Statistics | |
| Multiple R | 0.249975469257163 |
| R-squared | 0.0624877352303386 |
| Adjusted R-squared | 0.0122638639033924 |
| F-TEST (value) | 1.2441839623146 |
| F-TEST (DF numerator) | 3 |
| F-TEST (DF denominator) | 56 |
| p-value | 0.302403319880965 |
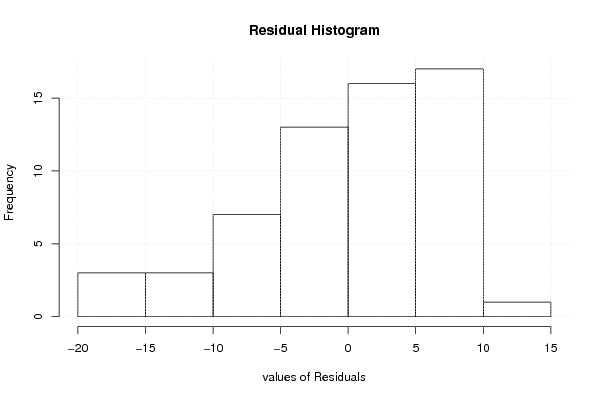
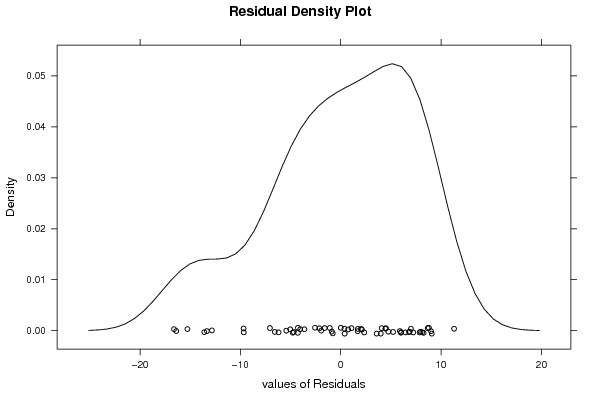
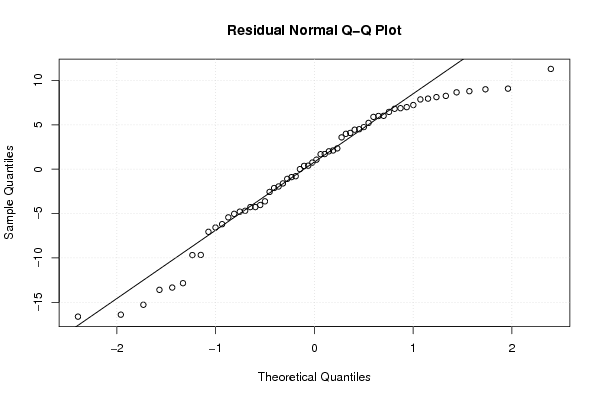
| Multiple Linear Regression - Residual Statistics | |
| Residual Standard Deviation | 7.33550112249891 |
| Sum Squared Residuals | 3013.33629621823 |
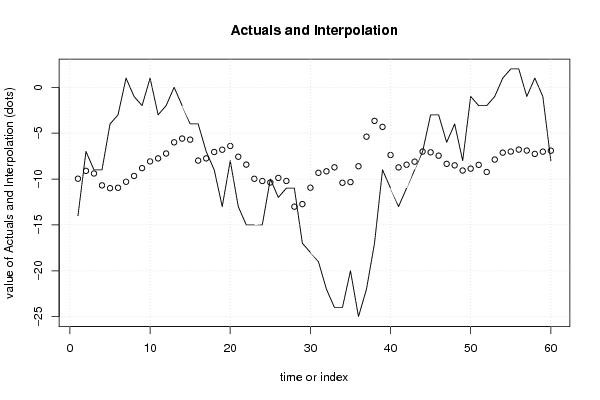
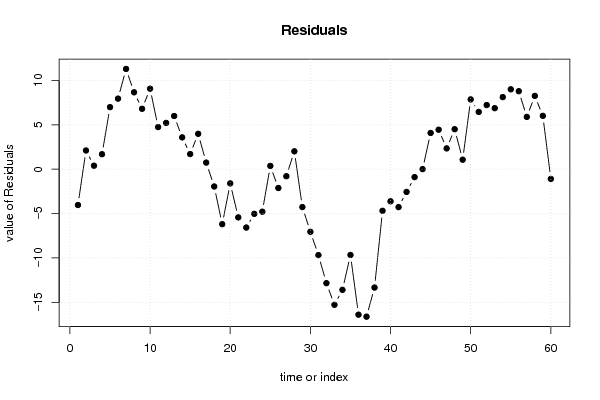
| Multiple Linear Regression - Actuals, Interpolation, and Residuals | |||
| Time or Index | Actuals | Interpolation Forecast | Residuals Prediction Error |
| 1 | -14 | -9.96520965764052 | -4.03479034235947 |
| 2 | -7 | -9.10987397268875 | 2.10987397268875 |
| 3 | -9 | -9.3949858676727 | 0.394985867672706 |
| 4 | -9 | -10.6906561331793 | 1.69065613317934 |
| 5 | -4 | -10.9958374141451 | 6.99583741414513 |
| 6 | -3 | -10.9532844856702 | 7.95328448567025 |
| 7 | 1 | -10.2984832295128 | 11.2984832295128 |
| 8 | -1 | -9.66471702194168 | 8.66471702194168 |
| 9 | -2 | -8.80938133698982 | 6.80938133698982 |
| 10 | 1 | -8.0774515693492 | 9.0774515693492 |
| 11 | -3 | -7.74978674589037 | 4.74978674589037 |
| 12 | -2 | -7.21786301628395 | 5.21786301628395 |
| 13 | 0 | -5.99656244751179 | 5.99656244751179 |
| 14 | -2 | -5.5880446352166 | 3.5880446352166 |
| 15 | -4 | -5.70719768441443 | 1.70719768441443 |
| 16 | -4 | -7.98809284428604 | 3.98809284428604 |
| 17 | -7 | -7.74553387777697 | 0.74553387777697 |
| 18 | -9 | -7.05190417049783 | -1.94809582950217 |
| 19 | -13 | -6.80509233587535 | -6.19490766412465 |
| 20 | -8 | -6.39657452358017 | -1.60342547641983 |
| 21 | -13 | -7.57106929576404 | -5.42893070423596 |
| 22 | -15 | -8.4264049807159 | -6.5735950192841 |
| 23 | -15 | -9.9711175048335 | -5.02888249516651 |
| 24 | -15 | -10.2136764713426 | -4.78632352865744 |
| 25 | -10 | -10.3711295809019 | 0.371129580901872 |
| 26 | -12 | -9.88175877977032 | -2.11824122022968 |
| 27 | -11 | -10.2094236032292 | -0.790576396770842 |
| 28 | -11 | -13.0137367564804 | 2.01373675648039 |
| 29 | -17 | -12.7328777296098 | -4.26712227039016 |
| 30 | -18 | -10.9456062389832 | -7.05439376101682 |
| 31 | -19 | -9.32052355733147 | -9.67947644266853 |
| 32 | -22 | -9.1559676459941 | -12.8440323540059 |
| 33 | -24 | -8.72181725876169 | -15.2781827412383 |
| 34 | -24 | -10.40628210351 | -13.59371789649 |
| 35 | -20 | -10.334763835131 | -9.66523616486903 |
| 36 | -25 | -8.60538045423619 | -16.3946195457638 |
| 37 | -22 | -5.38369909422546 | -16.6163009057745 |
| 38 | -17 | -3.66325722671094 | -13.3367427732891 |
| 39 | -9 | -4.3143340055152 | -4.6856659944848 |
| 40 | -11 | -7.38049358117559 | -3.61950641882441 |
| 41 | -13 | -8.72800444146567 | -4.27199555853433 |
| 42 | -11 | -8.43863967836831 | -2.56136032163169 |
| 43 | -9 | -8.10672198679608 | -0.893278013203924 |
| 44 | -7 | -7.00882733533515 | 0.00882733533515002 |
| 45 | -3 | -7.0854274560581 | 4.0854274560581 |
| 46 | -3 | -7.45139233987841 | 4.45139233987841 |
| 47 | -6 | -8.34502808519174 | 2.34502808519174 |
| 48 | -4 | -8.50673406286446 | 4.50673406286446 |
| 49 | -8 | -9.07270498471896 | 1.07270498471896 |
| 50 | -1 | -8.86419321045796 | 7.86419321045796 |
| 51 | -2 | -8.45567539816277 | 6.45567539816277 |
| 52 | -2 | -9.23015809427826 | 7.23015809427826 |
| 53 | -1 | -7.87471544797957 | 6.87471544797957 |
| 54 | 1 | -7.12455500595932 | 8.12455500595932 |
| 55 | 2 | -7.00540195676148 | 9.00540195676148 |
| 56 | 2 | -6.7904068903986 | 8.7904068903986 |
| 57 | -1 | -6.8955821333302 | 5.8955821333302 |
| 58 | 1 | -7.2615470171505 | 8.2615470171505 |
| 59 | -1 | -7.01526357328825 | 6.01526357328825 |
| 60 | -8 | -6.90916822721015 | -1.09083177278985 |
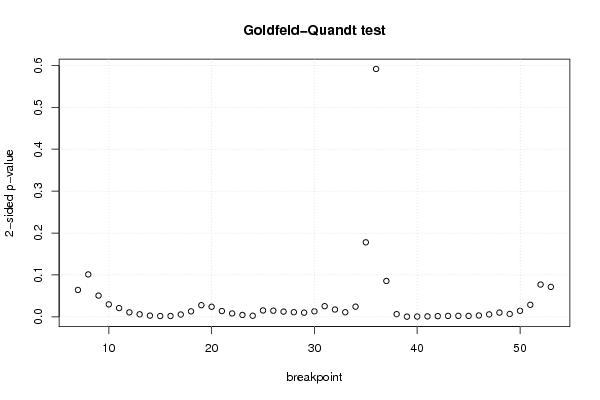
| Goldfeld-Quandt test for Heteroskedasticity | |||
| p-values | Alternative Hypothesis | ||
| breakpoint index | greater | 2-sided | less |
| 7 | 0.0320694327030035 | 0.0641388654060071 | 0.967930567296996 |
| 8 | 0.0505893579227092 | 0.101178715845418 | 0.94941064207729 |
| 9 | 0.0253058647964563 | 0.0506117295929127 | 0.974694135203544 |
| 10 | 0.0148762705438349 | 0.0297525410876699 | 0.985123729456165 |
| 11 | 0.0104255133945492 | 0.0208510267890984 | 0.98957448660545 |
| 12 | 0.0053342296704285 | 0.010668459340857 | 0.994665770329571 |
| 13 | 0.00304033003573724 | 0.00608066007147449 | 0.996959669964263 |
| 14 | 0.0014069399296029 | 0.00281387985920579 | 0.998593060070397 |
| 15 | 0.000949641068781902 | 0.0018992821375638 | 0.999050358931218 |
| 16 | 0.000972224403285047 | 0.00194444880657009 | 0.999027775596715 |
| 17 | 0.0027743683276621 | 0.0055487366553242 | 0.997225631672338 |
| 18 | 0.0065497008933332 | 0.0130994017866664 | 0.993450299106667 |
| 19 | 0.0138935502414039 | 0.0277871004828078 | 0.986106449758596 |
| 20 | 0.0120054613630086 | 0.0240109227260172 | 0.987994538636991 |
| 21 | 0.00690510642199667 | 0.0138102128439933 | 0.993094893578003 |
| 22 | 0.00401989708870638 | 0.00803979417741275 | 0.995980102911294 |
| 23 | 0.00223394253021399 | 0.00446788506042797 | 0.997766057469786 |
| 24 | 0.00128181698773837 | 0.00256363397547675 | 0.998718183012262 |
| 25 | 0.00760816411427165 | 0.0152163282285433 | 0.992391835885728 |
| 26 | 0.00728652129971424 | 0.0145730425994285 | 0.992713478700286 |
| 27 | 0.00620417820235978 | 0.0124083564047196 | 0.99379582179764 |
| 28 | 0.00550387341209044 | 0.0110077468241809 | 0.99449612658791 |
| 29 | 0.00498898905566187 | 0.00997797811132374 | 0.995011010944338 |
| 30 | 0.0065565143758595 | 0.013113028751719 | 0.99344348562414 |
| 31 | 0.0127017781530399 | 0.0254035563060799 | 0.98729822184696 |
| 32 | 0.00871973316729246 | 0.0174394663345849 | 0.991280266832708 |
| 33 | 0.00548299735250829 | 0.0109659947050166 | 0.994517002647492 |
| 34 | 0.0121144452134106 | 0.0242288904268212 | 0.98788555478659 |
| 35 | 0.088894528551966 | 0.177789057103932 | 0.911105471448034 |
| 36 | 0.704253126358616 | 0.591493747282769 | 0.295746873641384 |
| 37 | 0.957204271261609 | 0.0855914574767827 | 0.0427957287383914 |
| 38 | 0.99681037450498 | 0.00637925099004087 | 0.00318962549502043 |
| 39 | 0.999794888869438 | 0.000410222261124355 | 0.000205111130562177 |
| 40 | 0.999687998208567 | 0.000624003582865 | 0.0003120017914325 |
| 41 | 0.999456830116666 | 0.00108633976666899 | 0.000543169883334495 |
| 42 | 0.999180007868048 | 0.00163998426390387 | 0.000819992131951936 |
| 43 | 0.998892108820833 | 0.00221578235833397 | 0.00110789117916698 |
| 44 | 0.998836783347058 | 0.00232643330588413 | 0.00116321665294206 |
| 45 | 0.998899564018267 | 0.00220087196346687 | 0.00110043598173343 |
| 46 | 0.99840109486717 | 0.00319781026565922 | 0.00159890513282961 |
| 47 | 0.99710247339792 | 0.0057950532041595 | 0.00289752660207975 |
| 48 | 0.994944880605757 | 0.0101102387884868 | 0.00505511939424338 |
| 49 | 0.9966270885141 | 0.00674582297180132 | 0.00337291148590066 |
| 50 | 0.992831465282773 | 0.014337069434453 | 0.00716853471722652 |
| 51 | 0.985642201275908 | 0.0287155974481831 | 0.0143577987240916 |
| 52 | 0.961480859102218 | 0.0770382817955647 | 0.0385191408977823 |
| 53 | 0.964318941613223 | 0.0713621167735547 | 0.0356810583867774 |
| Meta Analysis of Goldfeld-Quandt test for Heteroskedasticity | |||
| Description | # significant tests | % significant tests | OK/NOK |
| 1% type I error level | 20 | 0.425531914893617 | NOK |
| 5% type I error level | 39 | 0.829787234042553 | NOK |
| 10% type I error level | 44 | 0.936170212765957 | NOK |