| Multiple Linear Regression - Estimated Regression Equation |
| y[t] = + 61.4075931643679 + 127.734586519242Pop[t] + 4.82323688675399t + 0.13668061961216pop_t[t] + 2.05466339206892x1[t] + 0.00831474027475941x1_p[t] + 0.945522033007033x2[t] -0.169168513370292x2_p[t] + e[t] |
| Multiple Linear Regression - Ordinary Least Squares | |||||
| Variable | Parameter | S.D. | T-STAT H0: parameter = 0 | 2-tail p-value | 1-tail p-value |
| (Intercept) | 61.4075931643679 | 195.515413 | 0.3141 | 0.754716 | 0.377358 |
| Pop | 127.734586519242 | 216.831301 | 0.5891 | 0.558347 | 0.279174 |
| t | 4.82323688675399 | 3.843805 | 1.2548 | 0.215159 | 0.107579 |
| pop_t | 0.13668061961216 | 5.465292 | 0.025 | 0.980144 | 0.490072 |
| x1 | 2.05466339206892 | 0.15357 | 13.3793 | 0 | 0 |
| x1_p | 0.00831474027475941 | 0.214291 | 0.0388 | 0.969197 | 0.484599 |
| x2 | 0.945522033007033 | 0.421586 | 2.2428 | 0.0292 | 0.0146 |
| x2_p | -0.169168513370292 | 1.64245 | -0.103 | 0.918361 | 0.45918 |
| Multiple Linear Regression - Regression Statistics | |
| Multiple R | 0.964918267593926 |
| R-squared | 0.931067263136464 |
| Adjusted R-squared | 0.921787856250988 |
| F-TEST (value) | 100.336936899896 |
| F-TEST (DF numerator) | 7 |
| F-TEST (DF denominator) | 52 |
| p-value | 0 |
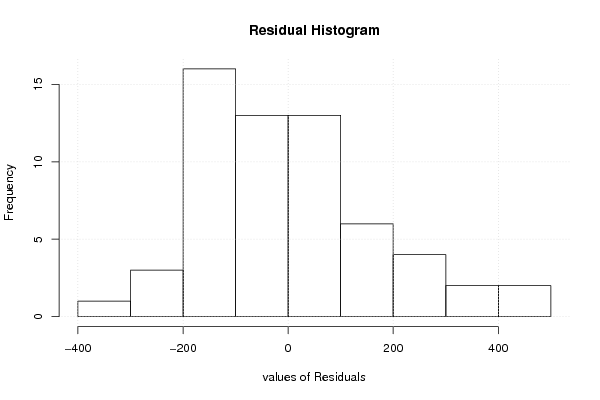
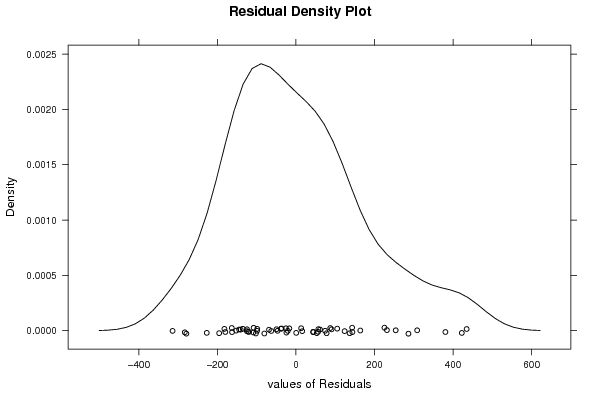
| Multiple Linear Regression - Residual Statistics | |
| Residual Standard Deviation | 180.864464805365 |
| Sum Squared Residuals | 1701021.64072521 |
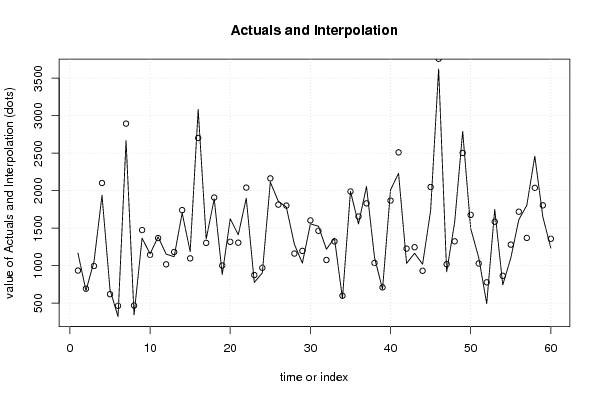
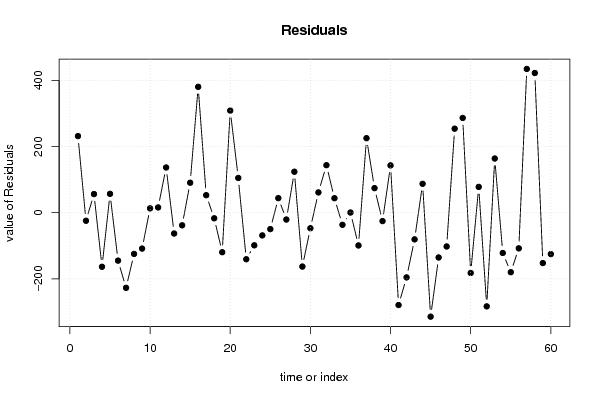
| Multiple Linear Regression - Actuals, Interpolation, and Residuals | |||
| Time or Index | Actuals | Interpolation Forecast | Residuals Prediction Error |
| 1 | 1167 | 935.418561634993 | 231.581438365007 |
| 2 | 669 | 693.265693072999 | -24.265693072999 |
| 3 | 1053 | 996.559192489499 | 56.4408075105012 |
| 4 | 1939 | 2102.34782808188 | -163.347828081877 |
| 5 | 678 | 620.946305420467 | 57.053694579533 |
| 6 | 321 | 465.748388363601 | -144.748388363601 |
| 7 | 2667 | 2893.99693913434 | -226.996939134338 |
| 8 | 345 | 469.523076499427 | -124.523076499427 |
| 9 | 1367 | 1475.33725813917 | -108.337258139169 |
| 10 | 1158 | 1144.78619983309 | 13.2138001669102 |
| 11 | 1385 | 1368.97585798108 | 16.0241420189183 |
| 12 | 1155 | 1018.26150192451 | 136.73849807549 |
| 13 | 1120 | 1182.84708914098 | -62.847089140976 |
| 14 | 1703 | 1741.03880358227 | -38.0388035822656 |
| 15 | 1189 | 1098.35830739891 | 90.6416926010936 |
| 16 | 3083 | 2702.52372245857 | 380.476277541434 |
| 17 | 1357 | 1304.01687631778 | 52.9831236822156 |
| 18 | 1892 | 1908.85884052328 | -16.8588405232791 |
| 19 | 883 | 1002.40511958656 | -119.405119586559 |
| 20 | 1627 | 1318.38635774381 | 308.613642256187 |
| 21 | 1412 | 1306.93002523168 | 105.069974768319 |
| 22 | 1900 | 2040.6533883085 | -140.653388308498 |
| 23 | 777 | 875.529153549118 | -98.5291535491184 |
| 24 | 904 | 972.568627251376 | -68.5686272513762 |
| 25 | 2115 | 2164.49207330912 | -49.4920733091186 |
| 26 | 1858 | 1813.91243711874 | 44.087562881264 |
| 27 | 1781 | 1801.61406980678 | -20.614069806779 |
| 28 | 1286 | 1162.10466898216 | 123.895331017845 |
| 29 | 1035 | 1197.72128228705 | -162.721282287047 |
| 30 | 1557 | 1603.87235482829 | -46.8723548282895 |
| 31 | 1527 | 1465.60040405699 | 61.3995959430133 |
| 32 | 1220 | 1076.34673979803 | 143.653260201971 |
| 33 | 1368 | 1324.1473088504 | 43.8526911495982 |
| 34 | 564 | 600.546757509019 | -36.5467575090194 |
| 35 | 1990 | 1989.35883009663 | 0.641169903372898 |
| 36 | 1557 | 1655.94450999896 | -98.9445099989619 |
| 37 | 2057 | 1831.75947248228 | 225.240527517721 |
| 38 | 1111 | 1036.73656039665 | 74.2634396033515 |
| 39 | 686 | 711.286043061794 | -25.2860430617935 |
| 40 | 2011 | 1867.95734626894 | 143.042653731064 |
| 41 | 2232 | 2510.99899538217 | -278.998995382171 |
| 42 | 1032 | 1227.47589759507 | -195.47589759507 |
| 43 | 1166 | 1246.51815890025 | -80.5181589002511 |
| 44 | 1020 | 932.577525287535 | 87.4224747124647 |
| 45 | 1735 | 2049.10108268631 | -314.101082686306 |
| 46 | 3623 | 3758.2656481889 | -135.265648188899 |
| 47 | 918 | 1020.03340210595 | -102.033402105949 |
| 48 | 1579 | 1325.00111356082 | 253.99888643918 |
| 49 | 2790 | 2503.54684892986 | 286.453151070143 |
| 50 | 1496 | 1678.10361246195 | -182.103612461947 |
| 51 | 1108 | 1029.94351716954 | 78.0564828304611 |
| 52 | 496 | 779.04297140674 | -283.04297140674 |
| 53 | 1750 | 1586.18549078947 | 163.814509210532 |
| 54 | 744 | 865.657512719805 | -121.657512719805 |
| 55 | 1101 | 1280.81398827221 | -179.813988272212 |
| 56 | 1612 | 1719.69825278699 | -107.698252786994 |
| 57 | 1805 | 1370.46490893367 | 434.535091066325 |
| 58 | 2460 | 2037.70934803911 | 422.290651960894 |
| 59 | 1653 | 1805.13566013666 | -152.135660136661 |
| 60 | 1234 | 1359.04209212732 | -125.042092127315 |
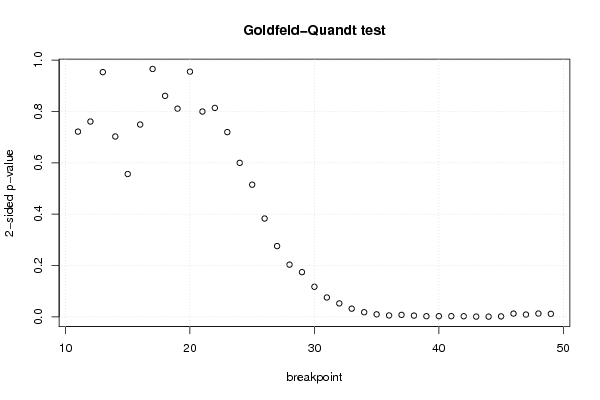
| Goldfeld-Quandt test for Heteroskedasticity | |||
| p-values | Alternative Hypothesis | ||
| breakpoint index | greater | 2-sided | less |
| 11 | 0.639402718798789 | 0.721194562402421 | 0.360597281201211 |
| 12 | 0.619742008531772 | 0.760515982936455 | 0.380257991468228 |
| 13 | 0.476428822338408 | 0.952857644676816 | 0.523571177661592 |
| 14 | 0.351085884263052 | 0.702171768526104 | 0.648914115736948 |
| 15 | 0.278070635650812 | 0.556141271301624 | 0.721929364349188 |
| 16 | 0.625582753420539 | 0.748834493158922 | 0.374417246579461 |
| 17 | 0.517389114021385 | 0.965221771957229 | 0.482610885978615 |
| 18 | 0.430231098585972 | 0.860462197171943 | 0.569768901414028 |
| 19 | 0.405272721268569 | 0.810545442537139 | 0.594727278731431 |
| 20 | 0.477316050333519 | 0.954632100667037 | 0.522683949666481 |
| 21 | 0.39972085048559 | 0.799441700971181 | 0.60027914951441 |
| 22 | 0.406740990974863 | 0.813481981949727 | 0.593259009025137 |
| 23 | 0.359635934360027 | 0.719271868720055 | 0.640364065639973 |
| 24 | 0.299818942632837 | 0.599637885265674 | 0.700181057367163 |
| 25 | 0.257276005218795 | 0.51455201043759 | 0.742723994781205 |
| 26 | 0.191452904475937 | 0.382905808951874 | 0.808547095524063 |
| 27 | 0.137796858823824 | 0.275593717647648 | 0.862203141176176 |
| 28 | 0.101617196748854 | 0.203234393497708 | 0.898382803251146 |
| 29 | 0.0870510444989195 | 0.174102088997839 | 0.912948955501081 |
| 30 | 0.0586086582664346 | 0.117217316532869 | 0.941391341733565 |
| 31 | 0.0377871580980869 | 0.0755743161961738 | 0.962212841901913 |
| 32 | 0.0261715473361057 | 0.0523430946722114 | 0.973828452663894 |
| 33 | 0.0159557330903345 | 0.0319114661806689 | 0.984044266909666 |
| 34 | 0.00904146534487885 | 0.0180829306897577 | 0.990958534655121 |
| 35 | 0.0049574010735124 | 0.00991480214702481 | 0.995042598926488 |
| 36 | 0.00278069055077839 | 0.00556138110155679 | 0.997219309449222 |
| 37 | 0.00388740729212749 | 0.00777481458425498 | 0.996112592707873 |
| 38 | 0.00245251253098088 | 0.00490502506196176 | 0.997547487469019 |
| 39 | 0.00127072577807565 | 0.00254145155615131 | 0.998729274221924 |
| 40 | 0.00133024286946537 | 0.00266048573893074 | 0.998669757130535 |
| 41 | 0.00135731934860415 | 0.00271463869720829 | 0.998642680651396 |
| 42 | 0.00120310167780233 | 0.00240620335560467 | 0.998796898322198 |
| 43 | 0.000531362663555193 | 0.00106272532711039 | 0.999468637336445 |
| 44 | 0.000419597576841733 | 0.000839195153683466 | 0.999580402423158 |
| 45 | 0.000903159614011065 | 0.00180631922802213 | 0.999096840385989 |
| 46 | 0.00633103720144443 | 0.0126620744028889 | 0.993668962798556 |
| 47 | 0.00452805443270184 | 0.00905610886540368 | 0.995471945567298 |
| 48 | 0.0064662552693854 | 0.0129325105387708 | 0.993533744730615 |
| 49 | 0.00587706385637926 | 0.0117541277127585 | 0.994122936143621 |
| Meta Analysis of Goldfeld-Quandt test for Heteroskedasticity | |||
| Description | # significant tests | % significant tests | OK/NOK |
| 1% type I error level | 12 | 0.307692307692308 | NOK |
| 5% type I error level | 17 | 0.435897435897436 | NOK |
| 10% type I error level | 19 | 0.487179487179487 | NOK |