Free Statistics
of Irreproducible Research!
Description of Statistical Computation | |||||||||||||||||||||
|---|---|---|---|---|---|---|---|---|---|---|---|---|---|---|---|---|---|---|---|---|---|
| Author's title | |||||||||||||||||||||
| Author | *The author of this computation has been verified* | ||||||||||||||||||||
| R Software Module | rwasp_meanplot.wasp | ||||||||||||||||||||
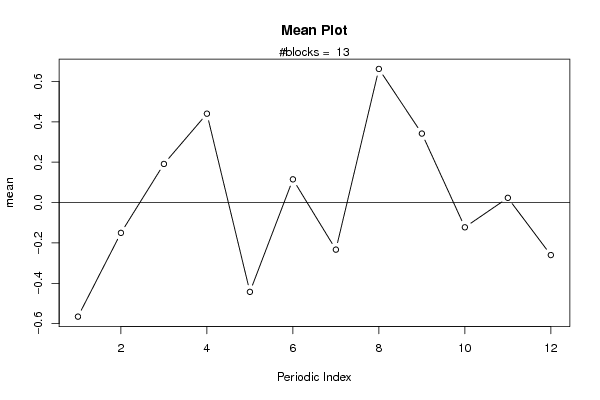
| Title produced by software | Mean Plot | ||||||||||||||||||||
| Date of computation | Tue, 22 Nov 2011 05:29:55 -0500 | ||||||||||||||||||||
| Cite this page as follows | Statistical Computations at FreeStatistics.org, Office for Research Development and Education, URL https://freestatistics.org/blog/index.php?v=date/2011/Nov/22/t1321957883f6rfv15scq6ibxb.htm/, Retrieved Fri, 26 Apr 2024 12:31:05 +0000 | ||||||||||||||||||||
| Statistical Computations at FreeStatistics.org, Office for Research Development and Education, URL https://freestatistics.org/blog/index.php?pk=146117, Retrieved Fri, 26 Apr 2024 12:31:05 +0000 | |||||||||||||||||||||
| QR Codes: | |||||||||||||||||||||
|
| |||||||||||||||||||||
| Original text written by user: | |||||||||||||||||||||
| IsPrivate? | No (this computation is public) | ||||||||||||||||||||
| User-defined keywords | |||||||||||||||||||||
| Estimated Impact | 102 | ||||||||||||||||||||
Tree of Dependent Computations | |||||||||||||||||||||
| Family? (F = Feedback message, R = changed R code, M = changed R Module, P = changed Parameters, D = changed Data) | |||||||||||||||||||||
| - [Central Tendency] [Arabica Price in ...] [2008-01-19 12:03:37] [74be16979710d4c4e7c6647856088456] - RM D [Mean Plot] [] [2010-11-16 19:28:51] [b98453cac15ba1066b407e146608df68] - PD [Mean Plot] [C7.4] [2011-11-22 10:29:55] [51aabe75794be7f34bed5d3096a085df] [Current] | |||||||||||||||||||||
| Feedback Forum | |||||||||||||||||||||
Post a new message | |||||||||||||||||||||
Dataset | |||||||||||||||||||||
| Dataseries X: | |||||||||||||||||||||
1.90191544102663 2.66538889221621 1.34895094508902 -0.189634420531493 0.363275159750658 -1.09557557624667 -1.11155725965572 6.61771406143024 -2.33579814388996 2.34679758810994 4.58060294149841 -1.38947521327073 -2.29263588273236 -7.18746664476603 -5.12310233669369 0.526777297550778 1.63298277703789 0.150017620675773 -1.21821099669079 -0.21720570962175 -0.546813673437087 0.742051769763175 0.0114862566664853 0.420381431338652 0.0904651447829504 -0.0679306250818922 0.335480050436709 -1.23036350289317 1.0396240855975 -0.0388560518920171 1.07793074026925 -2.75399997265848 0.30318939262623 -0.0749796177071758 -2.31057264769841 0.786409182641093 0.989695328351576 2.1677215866805 0.782144170415825 2.98462516018556 -0.916769254837924 -1.31071225916263 -0.594312546524372 0.720410789237553 4.04162559535045 0.563999246852537 -0.626610330561149 0.846252429528168 1.66480443709368 -1.23728116273909 1.31529790660325 3.33397528535547 -0.325840589962623 -2.70298886710691 -1.92501331838815 0.390176663083983 -3.45134222925503 -1.04261103534925 -0.693105741430971 -0.0453879940389715 0.0893629427720446 -1.00837133972183 0.0230778646865252 0.501274475109798 -4.63086471765147 2.00061425231988 0.509944259069826 -1.29824093951819 0.712971508076961 -1.4142657678109 0.0884695869632992 0.201453994226599 -0.28071103976212 1.51554332136573 0.707229439352217 0.353437601307165 -1.95277978323991 -0.40435547732932 -2.45757353417261 1.35462508228861 0.365714765697492 -0.244315476036222 -0.658112674154231 -2.81609623107383 -1.70241357225673 -1.62127939890874 2.75708544649748 2.21733990023233 0.474619647009403 -1.56992617014973 1.76540057600822 1.29063662578494 0.554532739139586 -1.29247098996122 1.96425591775626 3.27702207787294 0.557847617973135 -1.30745553782888 2.55271266918589 0.685545044640456 -2.56927796108232 -0.373175300764953 -0.42706509915059 1.21168719388628 2.79452354273925 -2.0343820261573 -1.70789362981318 -3.33024514318939 -1.34815884290607 0.69195824790584 -0.430088274745342 -2.92422944710671 2.23600454802897 1.13521147240442 0.599559528567213 0.549249005428758 0.269306435055162 -0.416534286082865 -1.70919630376992 1.33533628390266 -2.22150795113951 -1.92281743828336 1.34426094362011 -1.76472456379761 -1.71615589177001 3.2090706052227 1.32149216505492 -0.879228921527817 -2.48388602635172 1.19797946252395 0.133111285220822 1.84727688969044 -4.8708137524157 4.64275120764247 -0.818130329820121 -0.780683232928479 0.132609940074876 2.05304484052966 -0.60739523239862 0.701544904444912 3.47796939269852 0.22996889952846 -1.56425405170999 -4.93950728598721 0.0712252245243581 0.71611990903015 -2.30757290588238 2.01256975666079 0.477600031433273 0.444269103467224 0.0331886424950528 0.921302179096672 0.743676757053049 -0.155043216658764 2.7962106607456 0.424387578580833 | |||||||||||||||||||||
Tables (Output of Computation) | |||||||||||||||||||||
| |||||||||||||||||||||
Figures (Output of Computation) | |||||||||||||||||||||
Input Parameters & R Code | |||||||||||||||||||||
| Parameters (Session): | |||||||||||||||||||||
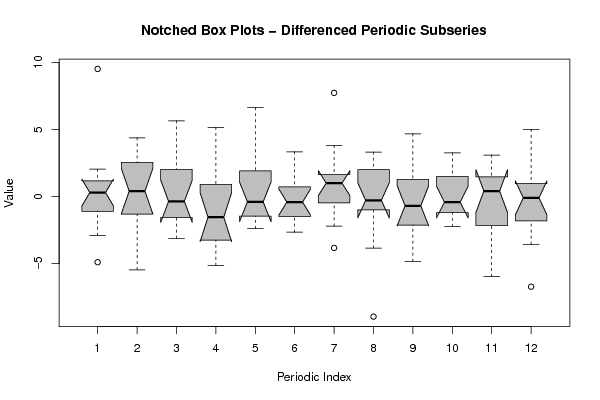
| par1 = 12 ; | |||||||||||||||||||||
| Parameters (R input): | |||||||||||||||||||||
| par1 = 12 ; | |||||||||||||||||||||
| R code (references can be found in the software module): | |||||||||||||||||||||
par1 <- as.numeric(par1) | |||||||||||||||||||||