| Multiple Linear Regression - Estimated Regression Equation |
| Rate[t] = -101.635754448806 + 0.0521185908401921Year[t] + 0.989848512848393Heart_disease[t] + 0.985652705992474Cancer[t] + 6.05030907890774`Diabetes `[t] + e[t] |
| Multiple Linear Regression - Ordinary Least Squares | |||||
| Variable | Parameter | S.D. | T-STAT H0: parameter = 0 | 2-tail p-value | 1-tail p-value |
| (Intercept) | -101.635754448806 | 25.24499 | -4.026 | 0.00029 | 0.000145 |
| Year | 0.0521185908401921 | 0.012556 | 4.151 | 0.000201 | 0.000101 |
| Heart_disease | 0.989848512848393 | 0.150258 | 6.5877 | 0 | 0 |
| Cancer | 0.985652705992474 | 0.316023 | 3.1189 | 0.003622 | 0.001811 |
| `Diabetes ` | 6.05030907890774 | 0.707299 | 8.5541 | 0 | 0 |
| Multiple Linear Regression - Regression Statistics | |
| Multiple R | 0.982027381130005 |
| R-squared | 0.964377777289057 |
| Adjusted R-squared | 0.960306666122092 |
| F-TEST (value) | 236.883184402947 |
| F-TEST (DF numerator) | 4 |
| F-TEST (DF denominator) | 35 |
| p-value | 0 |
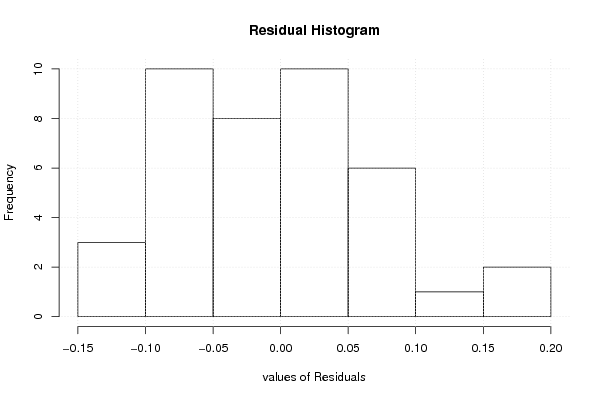
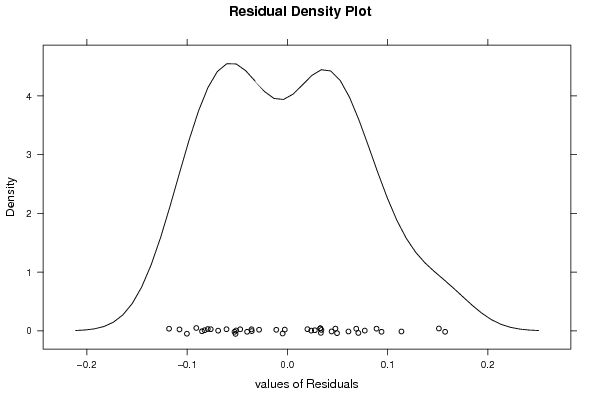
| Multiple Linear Regression - Residual Statistics | |
| Residual Standard Deviation | 0.0762399433934353 |
| Sum Squared Residuals | 0.203438513902197 |
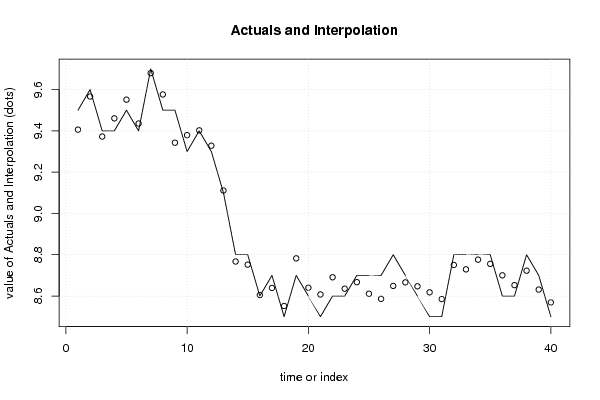
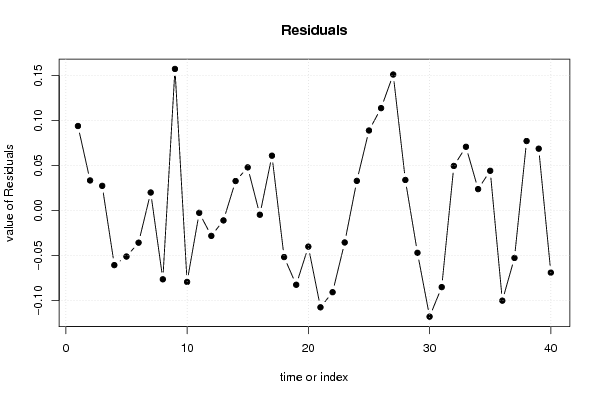
| Multiple Linear Regression - Actuals, Interpolation, and Residuals | |||
| Time or Index | Actuals | Interpolation Forecast | Residuals Prediction Error |
| 1 | 9.5 | 9.40602368022043 | 0.0939763197795691 |
| 2 | 9.6 | 9.5665331076742 | 0.0334668923258001 |
| 3 | 9.4 | 9.3725481131925 | 0.0274518868075007 |
| 4 | 9.4 | 9.46066220636538 | -0.0606622063653848 |
| 5 | 9.5 | 9.55113580444483 | -0.0511358044448348 |
| 6 | 9.4 | 9.43571399415517 | -0.0357139941551661 |
| 7 | 9.7 | 9.67993370439394 | 0.0200662956060583 |
| 8 | 9.5 | 9.57643623013387 | -0.0764362301338692 |
| 9 | 9.5 | 9.34258450945233 | 0.157415490547671 |
| 10 | 9.3 | 9.37938112994453 | -0.0793811299445338 |
| 11 | 9.4 | 9.40252971983993 | -0.00252971983992884 |
| 12 | 9.3 | 9.32817161095622 | -0.0281716109562209 |
| 13 | 9.1 | 9.1109773556953 | -0.0109773556953043 |
| 14 | 8.8 | 8.76719305568511 | 0.0328069443148951 |
| 15 | 8.8 | 8.75200135278537 | 0.0479986472146265 |
| 16 | 8.6 | 8.6046624489637 | -0.00466244896370252 |
| 17 | 8.7 | 8.63901624327846 | 0.0609837567215411 |
| 18 | 8.5 | 8.55170406056704 | -0.0517040605670394 |
| 19 | 8.7 | 8.78249905526347 | -0.0824990552634671 |
| 20 | 8.6 | 8.64011418467912 | -0.0401141846791252 |
| 21 | 8.5 | 8.60757105958967 | -0.107571059589672 |
| 22 | 8.6 | 8.69078625988059 | -0.0907862598805863 |
| 23 | 8.6 | 8.63548501060933 | -0.0354850106093316 |
| 24 | 8.7 | 8.66701823964906 | 0.0329817603509369 |
| 25 | 8.7 | 8.61101251497143 | 0.0889874850285662 |
| 26 | 8.7 | 8.58613696619937 | 0.113863033800626 |
| 27 | 8.8 | 8.64878778372411 | 0.151212216275894 |
| 28 | 8.7 | 8.66600125240494 | 0.0339987475950561 |
| 29 | 8.6 | 8.64699766180028 | -0.0469976618002799 |
| 30 | 8.5 | 8.61795706620062 | -0.117957066200615 |
| 31 | 8.5 | 8.5851228400405 | -0.0851228400405014 |
| 32 | 8.8 | 8.7504163414338 | 0.0495836585661976 |
| 33 | 8.8 | 8.72913775692593 | 0.0708622430740748 |
| 34 | 8.8 | 8.77615452399773 | 0.0238454760022681 |
| 35 | 8.8 | 8.75581750710372 | 0.0441824928962752 |
| 36 | 8.6 | 8.70016848424912 | -0.10016848424912 |
| 37 | 8.6 | 8.6526732729215 | -0.0526732729215053 |
| 38 | 8.8 | 8.72271888107772 | 0.077281118922275 |
| 39 | 8.7 | 8.6312170715638 | 0.0687829284361998 |
| 40 | 8.5 | 8.56899793796584 | -0.0689979379658434 |
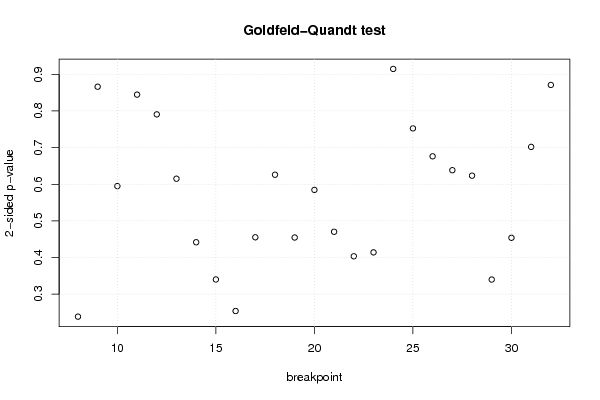
| Goldfeld-Quandt test for Heteroskedasticity | |||
| p-values | Alternative Hypothesis | ||
| breakpoint index | greater | 2-sided | less |
| 8 | 0.119279046657505 | 0.23855809331501 | 0.880720953342495 |
| 9 | 0.433126779809927 | 0.866253559619854 | 0.566873220190073 |
| 10 | 0.297458045037573 | 0.594916090075145 | 0.702541954962427 |
| 11 | 0.422347236923983 | 0.844694473847966 | 0.577652763076017 |
| 12 | 0.395397949856638 | 0.790795899713276 | 0.604602050143362 |
| 13 | 0.307548668517116 | 0.615097337034232 | 0.692451331482884 |
| 14 | 0.220835568238335 | 0.44167113647667 | 0.779164431761665 |
| 15 | 0.170043770697594 | 0.340087541395187 | 0.829956229302406 |
| 16 | 0.126982234686123 | 0.253964469372246 | 0.873017765313877 |
| 17 | 0.227623237298714 | 0.455246474597427 | 0.772376762701286 |
| 18 | 0.312993266972333 | 0.625986533944666 | 0.687006733027667 |
| 19 | 0.227313084035698 | 0.454626168071397 | 0.772686915964302 |
| 20 | 0.292305133914238 | 0.584610267828475 | 0.707694866085762 |
| 21 | 0.235129255293481 | 0.470258510586961 | 0.764870744706519 |
| 22 | 0.201694146664485 | 0.40338829332897 | 0.798305853335515 |
| 23 | 0.207053571779629 | 0.414107143559259 | 0.792946428220371 |
| 24 | 0.457392028200344 | 0.914784056400688 | 0.542607971799656 |
| 25 | 0.623718193303835 | 0.75256361339233 | 0.376281806696165 |
| 26 | 0.661844060045098 | 0.676311879909803 | 0.338155939954902 |
| 27 | 0.680806272505928 | 0.638387454988143 | 0.319193727494072 |
| 28 | 0.688291762973221 | 0.623416474053558 | 0.311708237026779 |
| 29 | 0.83006023368826 | 0.33987953262348 | 0.16993976631174 |
| 30 | 0.773066673932734 | 0.453866652134532 | 0.226933326067266 |
| 31 | 0.649001960194475 | 0.70199607961105 | 0.350998039805525 |
| 32 | 0.564463862651004 | 0.871072274697993 | 0.435536137348996 |
| Meta Analysis of Goldfeld-Quandt test for Heteroskedasticity | |||
| Description | # significant tests | % significant tests | OK/NOK |
| 1% type I error level | 0 | 0 | OK |
| 5% type I error level | 0 | 0 | OK |
| 10% type I error level | 0 | 0 | OK |