| Multiple Linear Regression - Estimated Regression Equation |
| prijsindex[t] = -6.49131317463051 + 0.194126667093335gezondheid[t] + 0.826140660513675tabak[t] + e[t] |
| Multiple Linear Regression - Ordinary Least Squares | |||||
| Variable | Parameter | S.D. | T-STAT H0: parameter = 0 | 2-tail p-value | 1-tail p-value |
| (Intercept) | -6.49131317463051 | 8.0729 | -0.8041 | 0.425395 | 0.212698 |
| gezondheid | 0.194126667093335 | 0.166926 | 1.163 | 0.25072 | 0.12536 |
| tabak | 0.826140660513675 | 0.137668 | 6.001 | 0 | 0 |
| Multiple Linear Regression - Regression Statistics | |
| Multiple R | 0.917991413357293 |
| R-squared | 0.84270823499772 |
| Adjusted R-squared | 0.836014968401879 |
| F-TEST (value) | 125.903880105608 |
| F-TEST (DF numerator) | 2 |
| F-TEST (DF denominator) | 47 |
| p-value | 0 |
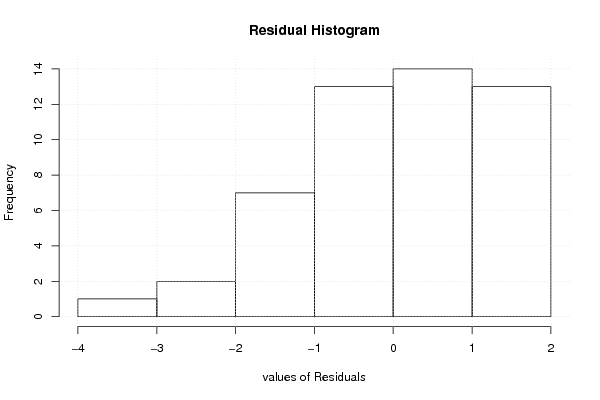
| Multiple Linear Regression - Residual Statistics | |
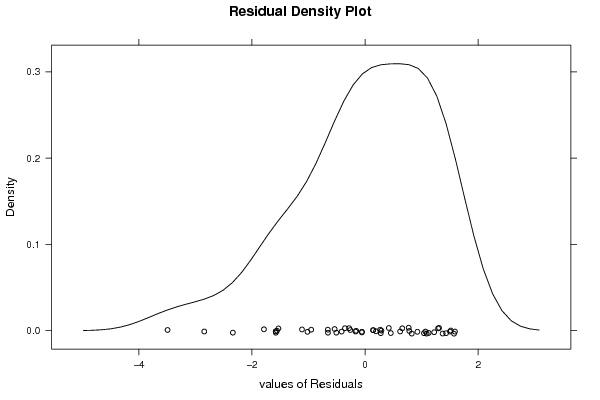
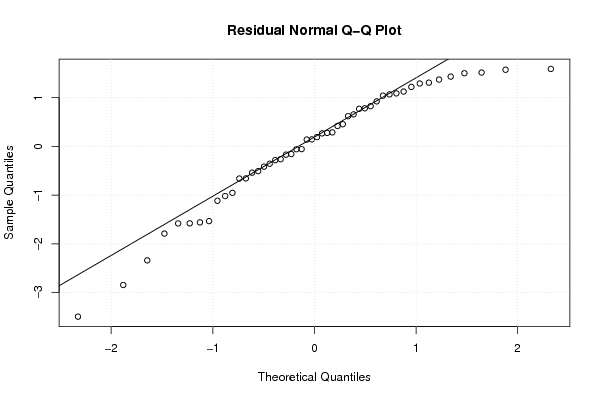
| Residual Standard Deviation | 1.23009476535401 |
| Sum Squared Residuals | 71.1172571923129 |
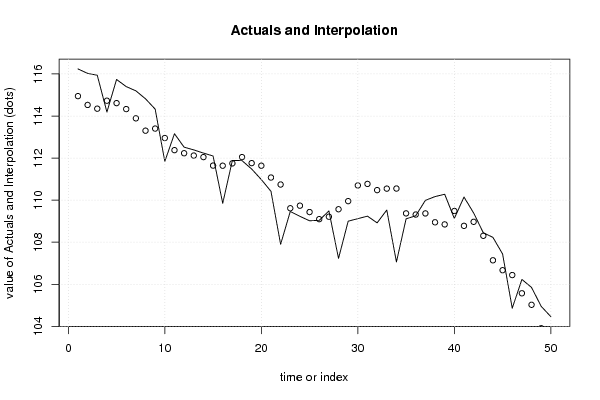
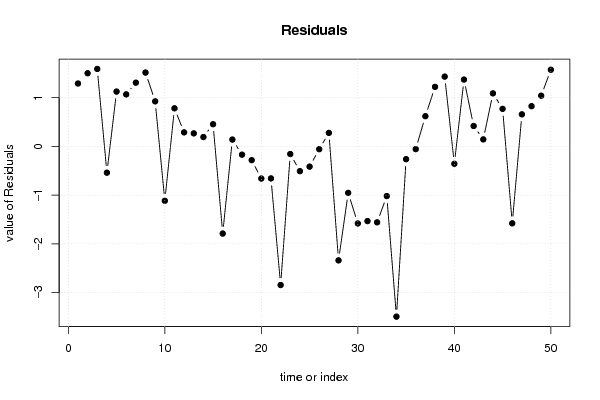
| Multiple Linear Regression - Actuals, Interpolation, and Residuals | |||
| Time or Index | Actuals | Interpolation Forecast | Residuals Prediction Error |
| 1 | 116.24 | 114.948447584741 | 1.2915524152588 |
| 2 | 116.03 | 114.528196713751 | 1.50180328624867 |
| 3 | 115.94 | 114.349920147888 | 1.59007985211185 |
| 4 | 114.19 | 114.728499924975 | -0.538499924974906 |
| 5 | 115.74 | 114.614329252267 | 1.1256707477328 |
| 6 | 115.4 | 114.332040593958 | 1.0679594060423 |
| 7 | 115.2 | 113.891340283401 | 1.30865971659892 |
| 8 | 114.82 | 113.303831827608 | 1.51616817239175 |
| 9 | 114.33 | 113.404954066556 | 0.925045933444501 |
| 10 | 111.84 | 112.954999669551 | -1.11499966955092 |
| 11 | 113.16 | 112.377649794019 | 0.782350205980518 |
| 12 | 112.52 | 112.231426174734 | 0.288573825265968 |
| 13 | 112.39 | 112.122086622196 | 0.267913377803681 |
| 14 | 112.24 | 112.047281715843 | 0.19271828415663 |
| 15 | 112.1 | 111.644414058863 | 0.455585941137394 |
| 16 | 109.85 | 111.637641672022 | -1.78764167202168 |
| 17 | 111.89 | 111.74892249123 | 0.141077508769689 |
| 18 | 111.88 | 112.048770735608 | -0.16877073560758 |
| 19 | 111.48 | 111.761606864113 | -0.281606864113397 |
| 20 | 110.98 | 111.638678444879 | -0.658678444879157 |
| 21 | 110.42 | 111.075998301916 | -0.655998301916409 |
| 22 | 107.9 | 110.743644864055 | -2.84364486405468 |
| 23 | 109.46 | 109.615714692493 | -0.155714692492833 |
| 24 | 109.23 | 109.737242277992 | -0.507242277992211 |
| 25 | 109.02 | 109.434548273131 | -0.414548273130577 |
| 26 | 109.04 | 109.096371035256 | -0.0563710352560447 |
| 27 | 109.49 | 109.212074820743 | 0.277925179257344 |
| 28 | 107.23 | 109.5678557377 | -2.3378557376996 |
| 29 | 109 | 109.952755654721 | -0.952755654720575 |
| 30 | 109.12 | 110.700208875539 | -1.58020887553942 |
| 31 | 109.24 | 110.772168021408 | -1.53216802140801 |
| 32 | 108.92 | 110.477735423152 | -1.5577354231515 |
| 33 | 109.53 | 110.548293735285 | -1.01829373528523 |
| 34 | 107.06 | 110.552760794578 | -3.49276079457785 |
| 35 | 109.11 | 109.371423743058 | -0.261423743057977 |
| 36 | 109.26 | 109.315082916586 | -0.0550829165862294 |
| 37 | 109.99 | 109.369570662416 | 0.62042933758358 |
| 38 | 110.17 | 108.947830771662 | 1.22216922833762 |
| 39 | 110.28 | 108.846840811759 | 1.43315918824082 |
| 40 | 109.13 | 109.485450819962 | -0.355450819961724 |
| 41 | 110.15 | 108.777903798434 | 1.3720962015663 |
| 42 | 109.39 | 108.969901510037 | 0.420098489962538 |
| 43 | 108.45 | 108.305646881221 | 0.144353118779262 |
| 44 | 108.23 | 107.140832642911 | 1.08916735708887 |
| 45 | 107.44 | 106.668531632683 | 0.771468367316505 |
| 46 | 104.86 | 106.437752680676 | -1.57775268067574 |
| 47 | 106.23 | 105.571794006901 | 0.658205993099405 |
| 48 | 105.85 | 105.024147657384 | 0.825852342616074 |
| 49 | 104.95 | 103.908405518784 | 1.04159448121628 |
| 50 | 104.46 | 102.886472799354 | 1.5735272006462 |
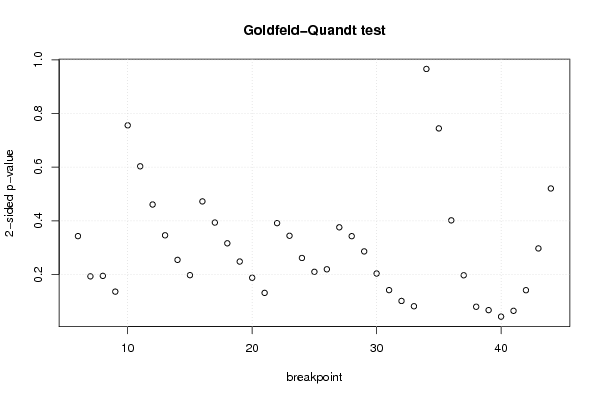
| Goldfeld-Quandt test for Heteroskedasticity | |||
| p-values | Alternative Hypothesis | ||
| breakpoint index | greater | 2-sided | less |
| 6 | 0.17141100025856 | 0.342822000517121 | 0.82858899974144 |
| 7 | 0.0963732468111528 | 0.192746493622306 | 0.903626753188847 |
| 8 | 0.0972771529313291 | 0.194554305862658 | 0.902722847068671 |
| 9 | 0.0679244187695686 | 0.135848837539137 | 0.932075581230431 |
| 10 | 0.377841094604763 | 0.755682189209525 | 0.622158905395237 |
| 11 | 0.301488848648861 | 0.602977697297722 | 0.698511151351139 |
| 12 | 0.230276501372339 | 0.460553002744678 | 0.769723498627661 |
| 13 | 0.17292213195521 | 0.345844263910419 | 0.82707786804479 |
| 14 | 0.127115161821524 | 0.254230323643049 | 0.872884838178476 |
| 15 | 0.0986249918421074 | 0.197249983684215 | 0.901375008157893 |
| 16 | 0.236072549913941 | 0.472145099827883 | 0.763927450086059 |
| 17 | 0.196647235364139 | 0.393294470728279 | 0.803352764635861 |
| 18 | 0.158004786032152 | 0.316009572064305 | 0.841995213967848 |
| 19 | 0.124020112209568 | 0.248040224419136 | 0.875979887790432 |
| 20 | 0.0937859239239084 | 0.187571847847817 | 0.906214076076092 |
| 21 | 0.0655890045115601 | 0.13117800902312 | 0.93441099548844 |
| 22 | 0.195585943210478 | 0.391171886420956 | 0.804414056789522 |
| 23 | 0.172029740890267 | 0.344059481780534 | 0.827970259109733 |
| 24 | 0.130635453597171 | 0.261270907194342 | 0.869364546402829 |
| 25 | 0.104848289836162 | 0.209696579672325 | 0.895151710163838 |
| 26 | 0.109597499070427 | 0.219194998140853 | 0.890402500929573 |
| 27 | 0.187808535587327 | 0.375617071174654 | 0.812191464412673 |
| 28 | 0.171277325922103 | 0.342554651844205 | 0.828722674077897 |
| 29 | 0.142874152310266 | 0.285748304620532 | 0.857125847689734 |
| 30 | 0.101693520502186 | 0.203387041004371 | 0.898306479497814 |
| 31 | 0.0707581528095943 | 0.141516305619189 | 0.929241847190406 |
| 32 | 0.050530445028428 | 0.101060890056856 | 0.949469554971572 |
| 33 | 0.0406695309617041 | 0.0813390619234082 | 0.959330469038296 |
| 34 | 0.482906936944203 | 0.965813873888406 | 0.517093063055797 |
| 35 | 0.62789111744664 | 0.744217765106721 | 0.372108882553361 |
| 36 | 0.799249367038122 | 0.401501265923755 | 0.200750632961878 |
| 37 | 0.901597489814352 | 0.196805020371295 | 0.0984025101856477 |
| 38 | 0.960275500224974 | 0.0794489995500521 | 0.0397244997750261 |
| 39 | 0.96656633861113 | 0.066867322777741 | 0.0334336613888705 |
| 40 | 0.978707456023267 | 0.0425850879534669 | 0.0212925439767334 |
| 41 | 0.967842485121163 | 0.0643150297576746 | 0.0321575148788373 |
| 42 | 0.929411728879438 | 0.141176542241124 | 0.0705882711205621 |
| 43 | 0.851528849481788 | 0.296942301036425 | 0.148471150518212 |
| 44 | 0.739845160975651 | 0.520309678048699 | 0.260154839024349 |
| Meta Analysis of Goldfeld-Quandt test for Heteroskedasticity | |||
| Description | # significant tests | % significant tests | OK/NOK |
| 1% type I error level | 0 | 0 | OK |
| 5% type I error level | 1 | 0.0256410256410256 | OK |
| 10% type I error level | 5 | 0.128205128205128 | NOK |