Free Statistics

of Irreproducible Research!

Author's title

Author*The author of this computation has been verified*
R Software Modulerwasp_multipleregression.wasp
Title produced by softwareMultiple Regression
Date of computationTue, 22 Nov 2011 03:04:47 -0500
Cite this page as followsStatistical Computations at FreeStatistics.org, Office for Research Development and Education, URL https://freestatistics.org/blog/index.php?v=date/2011/Nov/22/t1321949162q3a4fl5d2g404sm.htm/, Retrieved Fri, 26 Apr 2024 04:23:33 +0000
Statistical Computations at FreeStatistics.org, Office for Research Development and Education, URL https://freestatistics.org/blog/index.php?pk=146073, Retrieved Fri, 26 Apr 2024 04:23:33 +0000
QR Codes:

Original text written by user:
IsPrivate?No (this computation is public)
User-defined keywords
Estimated Impact120
Family? (F = Feedback message, R = changed R code, M = changed R Module, P = changed Parameters, D = changed Data)
-     [Multiple Regression] [] [2011-11-22 07:43:48] [80bca13c5f9401fbb753952fd2952f4a]
-   P     [Multiple Regression] [] [2011-11-22 08:04:47] [204816f6f70a8d342ddc2b9d4f4a80d3] [Current]
-    D      [Multiple Regression] [] [2011-11-22 10:08:56] [80bca13c5f9401fbb753952fd2952f4a]
Feedback Forum

Post a new message
Dataseries X:
116,24	112,42	120,58
116,03	112	120,17
115,94	111,72	120,02
114,19	111,67	120,49
115,74	111,55	120,38
115,4	111,33	120,09
115,2	111,06	119,62
114,82	110,97	118,93
114,33	110,81	119,09
111,84	110,62	118,59
113,16	110,71	117,87
112,52	110,51	117,74
112,39	110,5	117,61
112,24	110,37	117,55
112,1	110,38	117,06
109,85	110,26	117,08
111,89	110,28	117,21
111,88	110,25	117,58
111,48	110,09	117,27
110,98	110,01	117,14
110,42	109,75	116,52
107,9	109,57	116,16
109,46	109,59	114,79
109,23	109,45	114,97
109,02	109,21	114,66
109,04	109	114,3
109,49	108,83	114,48
107,23	108,62	114,96
109	108,56	115,44
109,12	108,41	116,38
109,24	108,27	116,5
108,92	108,03	116,2
109,53	107,67	116,37
107,06	107,31	116,46
109,11	107,14	115,07
109,26	107,02	115,03
109,99	106,79	115,15
110,17	106,49	114,71
110,28	106,14	114,67
109,13	105,94	115,49
110,15	105,87	114,65
109,39	105,71	114,92
108,45	105,48	114,17
108,23	105,31	112,8
107,44	105,09	112,28
104,86	104,88	112,05
106,23	104,76	111,03
105,85	104,62	110,4
104,95	104,49	109,08
104,46	104,29	107,89


Summary of computational transaction
Raw Inputview raw input (R code)
Raw Outputview raw output of R engine
Computing time4 seconds
R Server'Herman Ole Andreas Wold' @ wold.wessa.net

\begin{tabular}{lllllllll}
\hline
Summary of computational transaction \tabularnewline
Raw Input & view raw input (R code)  \tabularnewline
Raw Output & view raw output of R engine  \tabularnewline
Computing time & 4 seconds \tabularnewline
R Server & 'Herman Ole Andreas Wold' @ wold.wessa.net \tabularnewline
\hline
\end{tabular}
%Source: https://freestatistics.org/blog/index.php?pk=146073&T=0

[TABLE]
[ROW][C]Summary of computational transaction[/C][/ROW]
[ROW][C]Raw Input[/C][C]view raw input (R code) [/C][/ROW]
[ROW][C]Raw Output[/C][C]view raw output of R engine [/C][/ROW]
[ROW][C]Computing time[/C][C]4 seconds[/C][/ROW]
[ROW][C]R Server[/C][C]'Herman Ole Andreas Wold' @ wold.wessa.net[/C][/ROW]
[/TABLE]
Source: https://freestatistics.org/blog/index.php?pk=146073&T=0

Globally Unique Identifier (entire table): ba.freestatistics.org/blog/index.php?pk=146073&T=0

As an alternative you can also use a QR Code:  

The GUIDs for individual cells are displayed in the table below:

Summary of computational transaction
Raw Inputview raw input (R code)
Raw Outputview raw output of R engine
Computing time4 seconds
R Server'Herman Ole Andreas Wold' @ wold.wessa.net


Multiple Linear Regression - Estimated Regression Equation
prijsindex[t] = -6.49131317463051 + 0.194126667093335gezondheid[t] + 0.826140660513675tabak[t] + e[t]

\begin{tabular}{lllllllll}
\hline
Multiple Linear Regression - Estimated Regression Equation \tabularnewline
prijsindex[t] =  -6.49131317463051 +  0.194126667093335gezondheid[t] +  0.826140660513675tabak[t]  + e[t] \tabularnewline
\hline
\end{tabular}
%Source: https://freestatistics.org/blog/index.php?pk=146073&T=1

[TABLE]
[ROW][C]Multiple Linear Regression - Estimated Regression Equation[/C][/ROW]
[ROW][C]prijsindex[t] =  -6.49131317463051 +  0.194126667093335gezondheid[t] +  0.826140660513675tabak[t]  + e[t][/C][/ROW]
[/TABLE]
Source: https://freestatistics.org/blog/index.php?pk=146073&T=1

Globally Unique Identifier (entire table): ba.freestatistics.org/blog/index.php?pk=146073&T=1

As an alternative you can also use a QR Code:  

The GUIDs for individual cells are displayed in the table below:

Multiple Linear Regression - Estimated Regression Equation
prijsindex[t] = -6.49131317463051 + 0.194126667093335gezondheid[t] + 0.826140660513675tabak[t] + e[t]


Multiple Linear Regression - Ordinary Least Squares
VariableParameterS.D.T-STATH0: parameter = 02-tail p-value1-tail p-value
(Intercept)-6.491313174630518.0729-0.80410.4253950.212698
gezondheid0.1941266670933350.1669261.1630.250720.12536
tabak0.8261406605136750.1376686.00100

\begin{tabular}{lllllllll}
\hline
Multiple Linear Regression - Ordinary Least Squares \tabularnewline
Variable & Parameter & S.D. & T-STATH0: parameter = 0 & 2-tail p-value & 1-tail p-value \tabularnewline
(Intercept) & -6.49131317463051 & 8.0729 & -0.8041 & 0.425395 & 0.212698 \tabularnewline
gezondheid & 0.194126667093335 & 0.166926 & 1.163 & 0.25072 & 0.12536 \tabularnewline
tabak & 0.826140660513675 & 0.137668 & 6.001 & 0 & 0 \tabularnewline
\hline
\end{tabular}
%Source: https://freestatistics.org/blog/index.php?pk=146073&T=2

[TABLE]
[ROW][C]Multiple Linear Regression - Ordinary Least Squares[/C][/ROW]
[ROW][C]Variable[/C][C]Parameter[/C][C]S.D.[/C][C]T-STATH0: parameter = 0[/C][C]2-tail p-value[/C][C]1-tail p-value[/C][/ROW]
[ROW][C](Intercept)[/C][C]-6.49131317463051[/C][C]8.0729[/C][C]-0.8041[/C][C]0.425395[/C][C]0.212698[/C][/ROW]
[ROW][C]gezondheid[/C][C]0.194126667093335[/C][C]0.166926[/C][C]1.163[/C][C]0.25072[/C][C]0.12536[/C][/ROW]
[ROW][C]tabak[/C][C]0.826140660513675[/C][C]0.137668[/C][C]6.001[/C][C]0[/C][C]0[/C][/ROW]
[/TABLE]
Source: https://freestatistics.org/blog/index.php?pk=146073&T=2

Globally Unique Identifier (entire table): ba.freestatistics.org/blog/index.php?pk=146073&T=2

As an alternative you can also use a QR Code:  

The GUIDs for individual cells are displayed in the table below:

Multiple Linear Regression - Ordinary Least Squares
VariableParameterS.D.T-STATH0: parameter = 02-tail p-value1-tail p-value
(Intercept)-6.491313174630518.0729-0.80410.4253950.212698
gezondheid0.1941266670933350.1669261.1630.250720.12536
tabak0.8261406605136750.1376686.00100


Multiple Linear Regression - Regression Statistics
Multiple R0.917991413357293
R-squared0.84270823499772
Adjusted R-squared0.836014968401879
F-TEST (value)125.903880105608
F-TEST (DF numerator)2
F-TEST (DF denominator)47
p-value0
Multiple Linear Regression - Residual Statistics
Residual Standard Deviation1.23009476535401
Sum Squared Residuals71.1172571923129

\begin{tabular}{lllllllll}
\hline
Multiple Linear Regression - Regression Statistics \tabularnewline
Multiple R & 0.917991413357293 \tabularnewline
R-squared & 0.84270823499772 \tabularnewline
Adjusted R-squared & 0.836014968401879 \tabularnewline
F-TEST (value) & 125.903880105608 \tabularnewline
F-TEST (DF numerator) & 2 \tabularnewline
F-TEST (DF denominator) & 47 \tabularnewline
p-value & 0 \tabularnewline
Multiple Linear Regression - Residual Statistics \tabularnewline
Residual Standard Deviation & 1.23009476535401 \tabularnewline
Sum Squared Residuals & 71.1172571923129 \tabularnewline
\hline
\end{tabular}
%Source: https://freestatistics.org/blog/index.php?pk=146073&T=3

[TABLE]
[ROW][C]Multiple Linear Regression - Regression Statistics[/C][/ROW]
[ROW][C]Multiple R[/C][C]0.917991413357293[/C][/ROW]
[ROW][C]R-squared[/C][C]0.84270823499772[/C][/ROW]
[ROW][C]Adjusted R-squared[/C][C]0.836014968401879[/C][/ROW]
[ROW][C]F-TEST (value)[/C][C]125.903880105608[/C][/ROW]
[ROW][C]F-TEST (DF numerator)[/C][C]2[/C][/ROW]
[ROW][C]F-TEST (DF denominator)[/C][C]47[/C][/ROW]
[ROW][C]p-value[/C][C]0[/C][/ROW]
[ROW][C]Multiple Linear Regression - Residual Statistics[/C][/ROW]
[ROW][C]Residual Standard Deviation[/C][C]1.23009476535401[/C][/ROW]
[ROW][C]Sum Squared Residuals[/C][C]71.1172571923129[/C][/ROW]
[/TABLE]
Source: https://freestatistics.org/blog/index.php?pk=146073&T=3

Globally Unique Identifier (entire table): ba.freestatistics.org/blog/index.php?pk=146073&T=3

As an alternative you can also use a QR Code:  

The GUIDs for individual cells are displayed in the table below:

Multiple Linear Regression - Regression Statistics
Multiple R0.917991413357293
R-squared0.84270823499772
Adjusted R-squared0.836014968401879
F-TEST (value)125.903880105608
F-TEST (DF numerator)2
F-TEST (DF denominator)47
p-value0
Multiple Linear Regression - Residual Statistics
Residual Standard Deviation1.23009476535401
Sum Squared Residuals71.1172571923129


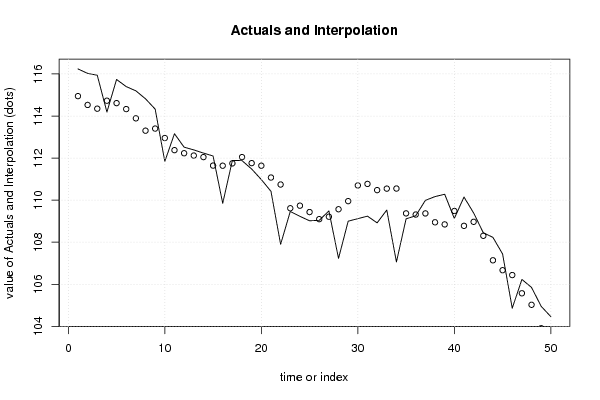
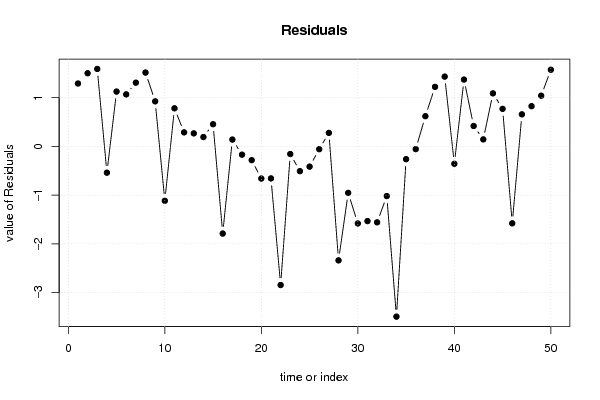
Multiple Linear Regression - Actuals, Interpolation, and Residuals
Time or IndexActualsInterpolationForecastResidualsPrediction Error
1116.24114.9484475847411.2915524152588
2116.03114.5281967137511.50180328624867
3115.94114.3499201478881.59007985211185
4114.19114.728499924975-0.538499924974906
5115.74114.6143292522671.1256707477328
6115.4114.3320405939581.0679594060423
7115.2113.8913402834011.30865971659892
8114.82113.3038318276081.51616817239175
9114.33113.4049540665560.925045933444501
10111.84112.954999669551-1.11499966955092
11113.16112.3776497940190.782350205980518
12112.52112.2314261747340.288573825265968
13112.39112.1220866221960.267913377803681
14112.24112.0472817158430.19271828415663
15112.1111.6444140588630.455585941137394
16109.85111.637641672022-1.78764167202168
17111.89111.748922491230.141077508769689
18111.88112.048770735608-0.16877073560758
19111.48111.761606864113-0.281606864113397
20110.98111.638678444879-0.658678444879157
21110.42111.075998301916-0.655998301916409
22107.9110.743644864055-2.84364486405468
23109.46109.615714692493-0.155714692492833
24109.23109.737242277992-0.507242277992211
25109.02109.434548273131-0.414548273130577
26109.04109.096371035256-0.0563710352560447
27109.49109.2120748207430.277925179257344
28107.23109.5678557377-2.3378557376996
29109109.952755654721-0.952755654720575
30109.12110.700208875539-1.58020887553942
31109.24110.772168021408-1.53216802140801
32108.92110.477735423152-1.5577354231515
33109.53110.548293735285-1.01829373528523
34107.06110.552760794578-3.49276079457785
35109.11109.371423743058-0.261423743057977
36109.26109.315082916586-0.0550829165862294
37109.99109.3695706624160.62042933758358
38110.17108.9478307716621.22216922833762
39110.28108.8468408117591.43315918824082
40109.13109.485450819962-0.355450819961724
41110.15108.7779037984341.3720962015663
42109.39108.9699015100370.420098489962538
43108.45108.3056468812210.144353118779262
44108.23107.1408326429111.08916735708887
45107.44106.6685316326830.771468367316505
46104.86106.437752680676-1.57775268067574
47106.23105.5717940069010.658205993099405
48105.85105.0241476573840.825852342616074
49104.95103.9084055187841.04159448121628
50104.46102.8864727993541.5735272006462

\begin{tabular}{lllllllll}
\hline
Multiple Linear Regression - Actuals, Interpolation, and Residuals \tabularnewline
Time or Index & Actuals & InterpolationForecast & ResidualsPrediction Error \tabularnewline
1 & 116.24 & 114.948447584741 & 1.2915524152588 \tabularnewline
2 & 116.03 & 114.528196713751 & 1.50180328624867 \tabularnewline
3 & 115.94 & 114.349920147888 & 1.59007985211185 \tabularnewline
4 & 114.19 & 114.728499924975 & -0.538499924974906 \tabularnewline
5 & 115.74 & 114.614329252267 & 1.1256707477328 \tabularnewline
6 & 115.4 & 114.332040593958 & 1.0679594060423 \tabularnewline
7 & 115.2 & 113.891340283401 & 1.30865971659892 \tabularnewline
8 & 114.82 & 113.303831827608 & 1.51616817239175 \tabularnewline
9 & 114.33 & 113.404954066556 & 0.925045933444501 \tabularnewline
10 & 111.84 & 112.954999669551 & -1.11499966955092 \tabularnewline
11 & 113.16 & 112.377649794019 & 0.782350205980518 \tabularnewline
12 & 112.52 & 112.231426174734 & 0.288573825265968 \tabularnewline
13 & 112.39 & 112.122086622196 & 0.267913377803681 \tabularnewline
14 & 112.24 & 112.047281715843 & 0.19271828415663 \tabularnewline
15 & 112.1 & 111.644414058863 & 0.455585941137394 \tabularnewline
16 & 109.85 & 111.637641672022 & -1.78764167202168 \tabularnewline
17 & 111.89 & 111.74892249123 & 0.141077508769689 \tabularnewline
18 & 111.88 & 112.048770735608 & -0.16877073560758 \tabularnewline
19 & 111.48 & 111.761606864113 & -0.281606864113397 \tabularnewline
20 & 110.98 & 111.638678444879 & -0.658678444879157 \tabularnewline
21 & 110.42 & 111.075998301916 & -0.655998301916409 \tabularnewline
22 & 107.9 & 110.743644864055 & -2.84364486405468 \tabularnewline
23 & 109.46 & 109.615714692493 & -0.155714692492833 \tabularnewline
24 & 109.23 & 109.737242277992 & -0.507242277992211 \tabularnewline
25 & 109.02 & 109.434548273131 & -0.414548273130577 \tabularnewline
26 & 109.04 & 109.096371035256 & -0.0563710352560447 \tabularnewline
27 & 109.49 & 109.212074820743 & 0.277925179257344 \tabularnewline
28 & 107.23 & 109.5678557377 & -2.3378557376996 \tabularnewline
29 & 109 & 109.952755654721 & -0.952755654720575 \tabularnewline
30 & 109.12 & 110.700208875539 & -1.58020887553942 \tabularnewline
31 & 109.24 & 110.772168021408 & -1.53216802140801 \tabularnewline
32 & 108.92 & 110.477735423152 & -1.5577354231515 \tabularnewline
33 & 109.53 & 110.548293735285 & -1.01829373528523 \tabularnewline
34 & 107.06 & 110.552760794578 & -3.49276079457785 \tabularnewline
35 & 109.11 & 109.371423743058 & -0.261423743057977 \tabularnewline
36 & 109.26 & 109.315082916586 & -0.0550829165862294 \tabularnewline
37 & 109.99 & 109.369570662416 & 0.62042933758358 \tabularnewline
38 & 110.17 & 108.947830771662 & 1.22216922833762 \tabularnewline
39 & 110.28 & 108.846840811759 & 1.43315918824082 \tabularnewline
40 & 109.13 & 109.485450819962 & -0.355450819961724 \tabularnewline
41 & 110.15 & 108.777903798434 & 1.3720962015663 \tabularnewline
42 & 109.39 & 108.969901510037 & 0.420098489962538 \tabularnewline
43 & 108.45 & 108.305646881221 & 0.144353118779262 \tabularnewline
44 & 108.23 & 107.140832642911 & 1.08916735708887 \tabularnewline
45 & 107.44 & 106.668531632683 & 0.771468367316505 \tabularnewline
46 & 104.86 & 106.437752680676 & -1.57775268067574 \tabularnewline
47 & 106.23 & 105.571794006901 & 0.658205993099405 \tabularnewline
48 & 105.85 & 105.024147657384 & 0.825852342616074 \tabularnewline
49 & 104.95 & 103.908405518784 & 1.04159448121628 \tabularnewline
50 & 104.46 & 102.886472799354 & 1.5735272006462 \tabularnewline
\hline
\end{tabular}
%Source: https://freestatistics.org/blog/index.php?pk=146073&T=4

[TABLE]
[ROW][C]Multiple Linear Regression - Actuals, Interpolation, and Residuals[/C][/ROW]
[ROW][C]Time or Index[/C][C]Actuals[/C][C]InterpolationForecast[/C][C]ResidualsPrediction Error[/C][/ROW]
[ROW][C]1[/C][C]116.24[/C][C]114.948447584741[/C][C]1.2915524152588[/C][/ROW]
[ROW][C]2[/C][C]116.03[/C][C]114.528196713751[/C][C]1.50180328624867[/C][/ROW]
[ROW][C]3[/C][C]115.94[/C][C]114.349920147888[/C][C]1.59007985211185[/C][/ROW]
[ROW][C]4[/C][C]114.19[/C][C]114.728499924975[/C][C]-0.538499924974906[/C][/ROW]
[ROW][C]5[/C][C]115.74[/C][C]114.614329252267[/C][C]1.1256707477328[/C][/ROW]
[ROW][C]6[/C][C]115.4[/C][C]114.332040593958[/C][C]1.0679594060423[/C][/ROW]
[ROW][C]7[/C][C]115.2[/C][C]113.891340283401[/C][C]1.30865971659892[/C][/ROW]
[ROW][C]8[/C][C]114.82[/C][C]113.303831827608[/C][C]1.51616817239175[/C][/ROW]
[ROW][C]9[/C][C]114.33[/C][C]113.404954066556[/C][C]0.925045933444501[/C][/ROW]
[ROW][C]10[/C][C]111.84[/C][C]112.954999669551[/C][C]-1.11499966955092[/C][/ROW]
[ROW][C]11[/C][C]113.16[/C][C]112.377649794019[/C][C]0.782350205980518[/C][/ROW]
[ROW][C]12[/C][C]112.52[/C][C]112.231426174734[/C][C]0.288573825265968[/C][/ROW]
[ROW][C]13[/C][C]112.39[/C][C]112.122086622196[/C][C]0.267913377803681[/C][/ROW]
[ROW][C]14[/C][C]112.24[/C][C]112.047281715843[/C][C]0.19271828415663[/C][/ROW]
[ROW][C]15[/C][C]112.1[/C][C]111.644414058863[/C][C]0.455585941137394[/C][/ROW]
[ROW][C]16[/C][C]109.85[/C][C]111.637641672022[/C][C]-1.78764167202168[/C][/ROW]
[ROW][C]17[/C][C]111.89[/C][C]111.74892249123[/C][C]0.141077508769689[/C][/ROW]
[ROW][C]18[/C][C]111.88[/C][C]112.048770735608[/C][C]-0.16877073560758[/C][/ROW]
[ROW][C]19[/C][C]111.48[/C][C]111.761606864113[/C][C]-0.281606864113397[/C][/ROW]
[ROW][C]20[/C][C]110.98[/C][C]111.638678444879[/C][C]-0.658678444879157[/C][/ROW]
[ROW][C]21[/C][C]110.42[/C][C]111.075998301916[/C][C]-0.655998301916409[/C][/ROW]
[ROW][C]22[/C][C]107.9[/C][C]110.743644864055[/C][C]-2.84364486405468[/C][/ROW]
[ROW][C]23[/C][C]109.46[/C][C]109.615714692493[/C][C]-0.155714692492833[/C][/ROW]
[ROW][C]24[/C][C]109.23[/C][C]109.737242277992[/C][C]-0.507242277992211[/C][/ROW]
[ROW][C]25[/C][C]109.02[/C][C]109.434548273131[/C][C]-0.414548273130577[/C][/ROW]
[ROW][C]26[/C][C]109.04[/C][C]109.096371035256[/C][C]-0.0563710352560447[/C][/ROW]
[ROW][C]27[/C][C]109.49[/C][C]109.212074820743[/C][C]0.277925179257344[/C][/ROW]
[ROW][C]28[/C][C]107.23[/C][C]109.5678557377[/C][C]-2.3378557376996[/C][/ROW]
[ROW][C]29[/C][C]109[/C][C]109.952755654721[/C][C]-0.952755654720575[/C][/ROW]
[ROW][C]30[/C][C]109.12[/C][C]110.700208875539[/C][C]-1.58020887553942[/C][/ROW]
[ROW][C]31[/C][C]109.24[/C][C]110.772168021408[/C][C]-1.53216802140801[/C][/ROW]
[ROW][C]32[/C][C]108.92[/C][C]110.477735423152[/C][C]-1.5577354231515[/C][/ROW]
[ROW][C]33[/C][C]109.53[/C][C]110.548293735285[/C][C]-1.01829373528523[/C][/ROW]
[ROW][C]34[/C][C]107.06[/C][C]110.552760794578[/C][C]-3.49276079457785[/C][/ROW]
[ROW][C]35[/C][C]109.11[/C][C]109.371423743058[/C][C]-0.261423743057977[/C][/ROW]
[ROW][C]36[/C][C]109.26[/C][C]109.315082916586[/C][C]-0.0550829165862294[/C][/ROW]
[ROW][C]37[/C][C]109.99[/C][C]109.369570662416[/C][C]0.62042933758358[/C][/ROW]
[ROW][C]38[/C][C]110.17[/C][C]108.947830771662[/C][C]1.22216922833762[/C][/ROW]
[ROW][C]39[/C][C]110.28[/C][C]108.846840811759[/C][C]1.43315918824082[/C][/ROW]
[ROW][C]40[/C][C]109.13[/C][C]109.485450819962[/C][C]-0.355450819961724[/C][/ROW]
[ROW][C]41[/C][C]110.15[/C][C]108.777903798434[/C][C]1.3720962015663[/C][/ROW]
[ROW][C]42[/C][C]109.39[/C][C]108.969901510037[/C][C]0.420098489962538[/C][/ROW]
[ROW][C]43[/C][C]108.45[/C][C]108.305646881221[/C][C]0.144353118779262[/C][/ROW]
[ROW][C]44[/C][C]108.23[/C][C]107.140832642911[/C][C]1.08916735708887[/C][/ROW]
[ROW][C]45[/C][C]107.44[/C][C]106.668531632683[/C][C]0.771468367316505[/C][/ROW]
[ROW][C]46[/C][C]104.86[/C][C]106.437752680676[/C][C]-1.57775268067574[/C][/ROW]
[ROW][C]47[/C][C]106.23[/C][C]105.571794006901[/C][C]0.658205993099405[/C][/ROW]
[ROW][C]48[/C][C]105.85[/C][C]105.024147657384[/C][C]0.825852342616074[/C][/ROW]
[ROW][C]49[/C][C]104.95[/C][C]103.908405518784[/C][C]1.04159448121628[/C][/ROW]
[ROW][C]50[/C][C]104.46[/C][C]102.886472799354[/C][C]1.5735272006462[/C][/ROW]
[/TABLE]
Source: https://freestatistics.org/blog/index.php?pk=146073&T=4

Globally Unique Identifier (entire table): ba.freestatistics.org/blog/index.php?pk=146073&T=4

As an alternative you can also use a QR Code:  

The GUIDs for individual cells are displayed in the table below:

Multiple Linear Regression - Actuals, Interpolation, and Residuals
Time or IndexActualsInterpolationForecastResidualsPrediction Error
1116.24114.9484475847411.2915524152588
2116.03114.5281967137511.50180328624867
3115.94114.3499201478881.59007985211185
4114.19114.728499924975-0.538499924974906
5115.74114.6143292522671.1256707477328
6115.4114.3320405939581.0679594060423
7115.2113.8913402834011.30865971659892
8114.82113.3038318276081.51616817239175
9114.33113.4049540665560.925045933444501
10111.84112.954999669551-1.11499966955092
11113.16112.3776497940190.782350205980518
12112.52112.2314261747340.288573825265968
13112.39112.1220866221960.267913377803681
14112.24112.0472817158430.19271828415663
15112.1111.6444140588630.455585941137394
16109.85111.637641672022-1.78764167202168
17111.89111.748922491230.141077508769689
18111.88112.048770735608-0.16877073560758
19111.48111.761606864113-0.281606864113397
20110.98111.638678444879-0.658678444879157
21110.42111.075998301916-0.655998301916409
22107.9110.743644864055-2.84364486405468
23109.46109.615714692493-0.155714692492833
24109.23109.737242277992-0.507242277992211
25109.02109.434548273131-0.414548273130577
26109.04109.096371035256-0.0563710352560447
27109.49109.2120748207430.277925179257344
28107.23109.5678557377-2.3378557376996
29109109.952755654721-0.952755654720575
30109.12110.700208875539-1.58020887553942
31109.24110.772168021408-1.53216802140801
32108.92110.477735423152-1.5577354231515
33109.53110.548293735285-1.01829373528523
34107.06110.552760794578-3.49276079457785
35109.11109.371423743058-0.261423743057977
36109.26109.315082916586-0.0550829165862294
37109.99109.3695706624160.62042933758358
38110.17108.9478307716621.22216922833762
39110.28108.8468408117591.43315918824082
40109.13109.485450819962-0.355450819961724
41110.15108.7779037984341.3720962015663
42109.39108.9699015100370.420098489962538
43108.45108.3056468812210.144353118779262
44108.23107.1408326429111.08916735708887
45107.44106.6685316326830.771468367316505
46104.86106.437752680676-1.57775268067574
47106.23105.5717940069010.658205993099405
48105.85105.0241476573840.825852342616074
49104.95103.9084055187841.04159448121628
50104.46102.8864727993541.5735272006462


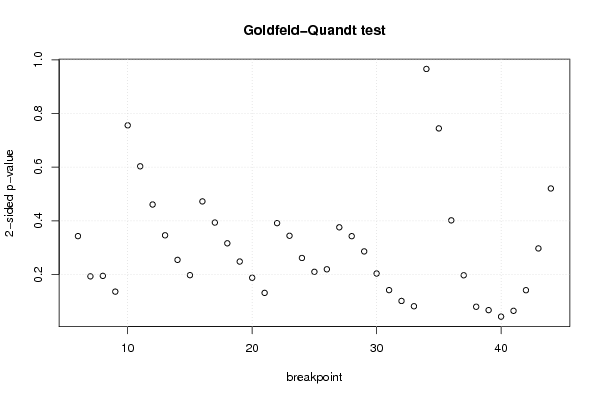
Goldfeld-Quandt test for Heteroskedasticity
p-valuesAlternative Hypothesis
breakpoint indexgreater2-sidedless
60.171411000258560.3428220005171210.82858899974144
70.09637324681115280.1927464936223060.903626753188847
80.09727715293132910.1945543058626580.902722847068671
90.06792441876956860.1358488375391370.932075581230431
100.3778410946047630.7556821892095250.622158905395237
110.3014888486488610.6029776972977220.698511151351139
120.2302765013723390.4605530027446780.769723498627661
130.172922131955210.3458442639104190.82707786804479
140.1271151618215240.2542303236430490.872884838178476
150.09862499184210740.1972499836842150.901375008157893
160.2360725499139410.4721450998278830.763927450086059
170.1966472353641390.3932944707282790.803352764635861
180.1580047860321520.3160095720643050.841995213967848
190.1240201122095680.2480402244191360.875979887790432
200.09378592392390840.1875718478478170.906214076076092
210.06558900451156010.131178009023120.93441099548844
220.1955859432104780.3911718864209560.804414056789522
230.1720297408902670.3440594817805340.827970259109733
240.1306354535971710.2612709071943420.869364546402829
250.1048482898361620.2096965796723250.895151710163838
260.1095974990704270.2191949981408530.890402500929573
270.1878085355873270.3756170711746540.812191464412673
280.1712773259221030.3425546518442050.828722674077897
290.1428741523102660.2857483046205320.857125847689734
300.1016935205021860.2033870410043710.898306479497814
310.07075815280959430.1415163056191890.929241847190406
320.0505304450284280.1010608900568560.949469554971572
330.04066953096170410.08133906192340820.959330469038296
340.4829069369442030.9658138738884060.517093063055797
350.627891117446640.7442177651067210.372108882553361
360.7992493670381220.4015012659237550.200750632961878
370.9015974898143520.1968050203712950.0984025101856477
380.9602755002249740.07944899955005210.0397244997750261
390.966566338611130.0668673227777410.0334336613888705
400.9787074560232670.04258508795346690.0212925439767334
410.9678424851211630.06431502975767460.0321575148788373
420.9294117288794380.1411765422411240.0705882711205621
430.8515288494817880.2969423010364250.148471150518212
440.7398451609756510.5203096780486990.260154839024349

\begin{tabular}{lllllllll}
\hline
Goldfeld-Quandt test for Heteroskedasticity \tabularnewline
p-values & Alternative Hypothesis \tabularnewline
breakpoint index & greater & 2-sided & less \tabularnewline
6 & 0.17141100025856 & 0.342822000517121 & 0.82858899974144 \tabularnewline
7 & 0.0963732468111528 & 0.192746493622306 & 0.903626753188847 \tabularnewline
8 & 0.0972771529313291 & 0.194554305862658 & 0.902722847068671 \tabularnewline
9 & 0.0679244187695686 & 0.135848837539137 & 0.932075581230431 \tabularnewline
10 & 0.377841094604763 & 0.755682189209525 & 0.622158905395237 \tabularnewline
11 & 0.301488848648861 & 0.602977697297722 & 0.698511151351139 \tabularnewline
12 & 0.230276501372339 & 0.460553002744678 & 0.769723498627661 \tabularnewline
13 & 0.17292213195521 & 0.345844263910419 & 0.82707786804479 \tabularnewline
14 & 0.127115161821524 & 0.254230323643049 & 0.872884838178476 \tabularnewline
15 & 0.0986249918421074 & 0.197249983684215 & 0.901375008157893 \tabularnewline
16 & 0.236072549913941 & 0.472145099827883 & 0.763927450086059 \tabularnewline
17 & 0.196647235364139 & 0.393294470728279 & 0.803352764635861 \tabularnewline
18 & 0.158004786032152 & 0.316009572064305 & 0.841995213967848 \tabularnewline
19 & 0.124020112209568 & 0.248040224419136 & 0.875979887790432 \tabularnewline
20 & 0.0937859239239084 & 0.187571847847817 & 0.906214076076092 \tabularnewline
21 & 0.0655890045115601 & 0.13117800902312 & 0.93441099548844 \tabularnewline
22 & 0.195585943210478 & 0.391171886420956 & 0.804414056789522 \tabularnewline
23 & 0.172029740890267 & 0.344059481780534 & 0.827970259109733 \tabularnewline
24 & 0.130635453597171 & 0.261270907194342 & 0.869364546402829 \tabularnewline
25 & 0.104848289836162 & 0.209696579672325 & 0.895151710163838 \tabularnewline
26 & 0.109597499070427 & 0.219194998140853 & 0.890402500929573 \tabularnewline
27 & 0.187808535587327 & 0.375617071174654 & 0.812191464412673 \tabularnewline
28 & 0.171277325922103 & 0.342554651844205 & 0.828722674077897 \tabularnewline
29 & 0.142874152310266 & 0.285748304620532 & 0.857125847689734 \tabularnewline
30 & 0.101693520502186 & 0.203387041004371 & 0.898306479497814 \tabularnewline
31 & 0.0707581528095943 & 0.141516305619189 & 0.929241847190406 \tabularnewline
32 & 0.050530445028428 & 0.101060890056856 & 0.949469554971572 \tabularnewline
33 & 0.0406695309617041 & 0.0813390619234082 & 0.959330469038296 \tabularnewline
34 & 0.482906936944203 & 0.965813873888406 & 0.517093063055797 \tabularnewline
35 & 0.62789111744664 & 0.744217765106721 & 0.372108882553361 \tabularnewline
36 & 0.799249367038122 & 0.401501265923755 & 0.200750632961878 \tabularnewline
37 & 0.901597489814352 & 0.196805020371295 & 0.0984025101856477 \tabularnewline
38 & 0.960275500224974 & 0.0794489995500521 & 0.0397244997750261 \tabularnewline
39 & 0.96656633861113 & 0.066867322777741 & 0.0334336613888705 \tabularnewline
40 & 0.978707456023267 & 0.0425850879534669 & 0.0212925439767334 \tabularnewline
41 & 0.967842485121163 & 0.0643150297576746 & 0.0321575148788373 \tabularnewline
42 & 0.929411728879438 & 0.141176542241124 & 0.0705882711205621 \tabularnewline
43 & 0.851528849481788 & 0.296942301036425 & 0.148471150518212 \tabularnewline
44 & 0.739845160975651 & 0.520309678048699 & 0.260154839024349 \tabularnewline
\hline
\end{tabular}
%Source: https://freestatistics.org/blog/index.php?pk=146073&T=5

[TABLE]
[ROW][C]Goldfeld-Quandt test for Heteroskedasticity[/C][/ROW]
[ROW][C]p-values[/C][C]Alternative Hypothesis[/C][/ROW]
[ROW][C]breakpoint index[/C][C]greater[/C][C]2-sided[/C][C]less[/C][/ROW]
[ROW][C]6[/C][C]0.17141100025856[/C][C]0.342822000517121[/C][C]0.82858899974144[/C][/ROW]
[ROW][C]7[/C][C]0.0963732468111528[/C][C]0.192746493622306[/C][C]0.903626753188847[/C][/ROW]
[ROW][C]8[/C][C]0.0972771529313291[/C][C]0.194554305862658[/C][C]0.902722847068671[/C][/ROW]
[ROW][C]9[/C][C]0.0679244187695686[/C][C]0.135848837539137[/C][C]0.932075581230431[/C][/ROW]
[ROW][C]10[/C][C]0.377841094604763[/C][C]0.755682189209525[/C][C]0.622158905395237[/C][/ROW]
[ROW][C]11[/C][C]0.301488848648861[/C][C]0.602977697297722[/C][C]0.698511151351139[/C][/ROW]
[ROW][C]12[/C][C]0.230276501372339[/C][C]0.460553002744678[/C][C]0.769723498627661[/C][/ROW]
[ROW][C]13[/C][C]0.17292213195521[/C][C]0.345844263910419[/C][C]0.82707786804479[/C][/ROW]
[ROW][C]14[/C][C]0.127115161821524[/C][C]0.254230323643049[/C][C]0.872884838178476[/C][/ROW]
[ROW][C]15[/C][C]0.0986249918421074[/C][C]0.197249983684215[/C][C]0.901375008157893[/C][/ROW]
[ROW][C]16[/C][C]0.236072549913941[/C][C]0.472145099827883[/C][C]0.763927450086059[/C][/ROW]
[ROW][C]17[/C][C]0.196647235364139[/C][C]0.393294470728279[/C][C]0.803352764635861[/C][/ROW]
[ROW][C]18[/C][C]0.158004786032152[/C][C]0.316009572064305[/C][C]0.841995213967848[/C][/ROW]
[ROW][C]19[/C][C]0.124020112209568[/C][C]0.248040224419136[/C][C]0.875979887790432[/C][/ROW]
[ROW][C]20[/C][C]0.0937859239239084[/C][C]0.187571847847817[/C][C]0.906214076076092[/C][/ROW]
[ROW][C]21[/C][C]0.0655890045115601[/C][C]0.13117800902312[/C][C]0.93441099548844[/C][/ROW]
[ROW][C]22[/C][C]0.195585943210478[/C][C]0.391171886420956[/C][C]0.804414056789522[/C][/ROW]
[ROW][C]23[/C][C]0.172029740890267[/C][C]0.344059481780534[/C][C]0.827970259109733[/C][/ROW]
[ROW][C]24[/C][C]0.130635453597171[/C][C]0.261270907194342[/C][C]0.869364546402829[/C][/ROW]
[ROW][C]25[/C][C]0.104848289836162[/C][C]0.209696579672325[/C][C]0.895151710163838[/C][/ROW]
[ROW][C]26[/C][C]0.109597499070427[/C][C]0.219194998140853[/C][C]0.890402500929573[/C][/ROW]
[ROW][C]27[/C][C]0.187808535587327[/C][C]0.375617071174654[/C][C]0.812191464412673[/C][/ROW]
[ROW][C]28[/C][C]0.171277325922103[/C][C]0.342554651844205[/C][C]0.828722674077897[/C][/ROW]
[ROW][C]29[/C][C]0.142874152310266[/C][C]0.285748304620532[/C][C]0.857125847689734[/C][/ROW]
[ROW][C]30[/C][C]0.101693520502186[/C][C]0.203387041004371[/C][C]0.898306479497814[/C][/ROW]
[ROW][C]31[/C][C]0.0707581528095943[/C][C]0.141516305619189[/C][C]0.929241847190406[/C][/ROW]
[ROW][C]32[/C][C]0.050530445028428[/C][C]0.101060890056856[/C][C]0.949469554971572[/C][/ROW]
[ROW][C]33[/C][C]0.0406695309617041[/C][C]0.0813390619234082[/C][C]0.959330469038296[/C][/ROW]
[ROW][C]34[/C][C]0.482906936944203[/C][C]0.965813873888406[/C][C]0.517093063055797[/C][/ROW]
[ROW][C]35[/C][C]0.62789111744664[/C][C]0.744217765106721[/C][C]0.372108882553361[/C][/ROW]
[ROW][C]36[/C][C]0.799249367038122[/C][C]0.401501265923755[/C][C]0.200750632961878[/C][/ROW]
[ROW][C]37[/C][C]0.901597489814352[/C][C]0.196805020371295[/C][C]0.0984025101856477[/C][/ROW]
[ROW][C]38[/C][C]0.960275500224974[/C][C]0.0794489995500521[/C][C]0.0397244997750261[/C][/ROW]
[ROW][C]39[/C][C]0.96656633861113[/C][C]0.066867322777741[/C][C]0.0334336613888705[/C][/ROW]
[ROW][C]40[/C][C]0.978707456023267[/C][C]0.0425850879534669[/C][C]0.0212925439767334[/C][/ROW]
[ROW][C]41[/C][C]0.967842485121163[/C][C]0.0643150297576746[/C][C]0.0321575148788373[/C][/ROW]
[ROW][C]42[/C][C]0.929411728879438[/C][C]0.141176542241124[/C][C]0.0705882711205621[/C][/ROW]
[ROW][C]43[/C][C]0.851528849481788[/C][C]0.296942301036425[/C][C]0.148471150518212[/C][/ROW]
[ROW][C]44[/C][C]0.739845160975651[/C][C]0.520309678048699[/C][C]0.260154839024349[/C][/ROW]
[/TABLE]
Source: https://freestatistics.org/blog/index.php?pk=146073&T=5

Globally Unique Identifier (entire table): ba.freestatistics.org/blog/index.php?pk=146073&T=5

As an alternative you can also use a QR Code:  

The GUIDs for individual cells are displayed in the table below:

Goldfeld-Quandt test for Heteroskedasticity
p-valuesAlternative Hypothesis
breakpoint indexgreater2-sidedless
60.171411000258560.3428220005171210.82858899974144
70.09637324681115280.1927464936223060.903626753188847
80.09727715293132910.1945543058626580.902722847068671
90.06792441876956860.1358488375391370.932075581230431
100.3778410946047630.7556821892095250.622158905395237
110.3014888486488610.6029776972977220.698511151351139
120.2302765013723390.4605530027446780.769723498627661
130.172922131955210.3458442639104190.82707786804479
140.1271151618215240.2542303236430490.872884838178476
150.09862499184210740.1972499836842150.901375008157893
160.2360725499139410.4721450998278830.763927450086059
170.1966472353641390.3932944707282790.803352764635861
180.1580047860321520.3160095720643050.841995213967848
190.1240201122095680.2480402244191360.875979887790432
200.09378592392390840.1875718478478170.906214076076092
210.06558900451156010.131178009023120.93441099548844
220.1955859432104780.3911718864209560.804414056789522
230.1720297408902670.3440594817805340.827970259109733
240.1306354535971710.2612709071943420.869364546402829
250.1048482898361620.2096965796723250.895151710163838
260.1095974990704270.2191949981408530.890402500929573
270.1878085355873270.3756170711746540.812191464412673
280.1712773259221030.3425546518442050.828722674077897
290.1428741523102660.2857483046205320.857125847689734
300.1016935205021860.2033870410043710.898306479497814
310.07075815280959430.1415163056191890.929241847190406
320.0505304450284280.1010608900568560.949469554971572
330.04066953096170410.08133906192340820.959330469038296
340.4829069369442030.9658138738884060.517093063055797
350.627891117446640.7442177651067210.372108882553361
360.7992493670381220.4015012659237550.200750632961878
370.9015974898143520.1968050203712950.0984025101856477
380.9602755002249740.07944899955005210.0397244997750261
390.966566338611130.0668673227777410.0334336613888705
400.9787074560232670.04258508795346690.0212925439767334
410.9678424851211630.06431502975767460.0321575148788373
420.9294117288794380.1411765422411240.0705882711205621
430.8515288494817880.2969423010364250.148471150518212
440.7398451609756510.5203096780486990.260154839024349


Meta Analysis of Goldfeld-Quandt test for Heteroskedasticity
Description# significant tests% significant testsOK/NOK
1% type I error level00OK
5% type I error level10.0256410256410256OK
10% type I error level50.128205128205128NOK

\begin{tabular}{lllllllll}
\hline
Meta Analysis of Goldfeld-Quandt test for Heteroskedasticity \tabularnewline
Description & # significant tests & % significant tests & OK/NOK \tabularnewline
1% type I error level & 0 & 0 & OK \tabularnewline
5% type I error level & 1 & 0.0256410256410256 & OK \tabularnewline
10% type I error level & 5 & 0.128205128205128 & NOK \tabularnewline
\hline
\end{tabular}
%Source: https://freestatistics.org/blog/index.php?pk=146073&T=6

[TABLE]
[ROW][C]Meta Analysis of Goldfeld-Quandt test for Heteroskedasticity[/C][/ROW]
[ROW][C]Description[/C][C]# significant tests[/C][C]% significant tests[/C][C]OK/NOK[/C][/ROW]
[ROW][C]1% type I error level[/C][C]0[/C][C]0[/C][C]OK[/C][/ROW]
[ROW][C]5% type I error level[/C][C]1[/C][C]0.0256410256410256[/C][C]OK[/C][/ROW]
[ROW][C]10% type I error level[/C][C]5[/C][C]0.128205128205128[/C][C]NOK[/C][/ROW]
[/TABLE]
Source: https://freestatistics.org/blog/index.php?pk=146073&T=6

Globally Unique Identifier (entire table): ba.freestatistics.org/blog/index.php?pk=146073&T=6

As an alternative you can also use a QR Code:  

The GUIDs for individual cells are displayed in the table below:

Meta Analysis of Goldfeld-Quandt test for Heteroskedasticity
Description# significant tests% significant testsOK/NOK
1% type I error level00OK
5% type I error level10.0256410256410256OK
10% type I error level50.128205128205128NOK


Parameters (Session):
par1 = 1 ; par2 = Do not include Seasonal Dummies ; par3 = No Linear Trend ;
Parameters (R input):
par1 = 1 ; par2 = Do not include Seasonal Dummies ; par3 = No Linear Trend ;
R code (references can be found in the software module):
library(lattice)
library(lmtest)
n25 <- 25 #minimum number of obs. for Goldfeld-Quandt test
par1 <- as.numeric(par1)
x <- t(y)
k <- length(x[1,])
n <- length(x[,1])
x1 <- cbind(x[,par1], x[,1:k!=par1])
mycolnames <- c(colnames(x)[par1], colnames(x)[1:k!=par1])
colnames(x1) <- mycolnames #colnames(x)[par1]
x <- x1
if (par3 == 'First Differences'){
x2 <- array(0, dim=c(n-1,k), dimnames=list(1:(n-1), paste('(1-B)',colnames(x),sep='')))
for (i in 1:n-1) {
for (j in 1:k) {
x2[i,j] <- x[i+1,j] - x[i,j]
}
}
x <- x2
}
if (par2 == 'Include Monthly Dummies'){
x2 <- array(0, dim=c(n,11), dimnames=list(1:n, paste('M', seq(1:11), sep ='')))
for (i in 1:11){
x2[seq(i,n,12),i] <- 1
}
x <- cbind(x, x2)
}
if (par2 == 'Include Quarterly Dummies'){
x2 <- array(0, dim=c(n,3), dimnames=list(1:n, paste('Q', seq(1:3), sep ='')))
for (i in 1:3){
x2[seq(i,n,4),i] <- 1
}
x <- cbind(x, x2)
}
k <- length(x[1,])
if (par3 == 'Linear Trend'){
x <- cbind(x, c(1:n))
colnames(x)[k+1] <- 't'
}
x
k <- length(x[1,])
df <- as.data.frame(x)
(mylm <- lm(df))
(mysum <- summary(mylm))
if (n > n25) {
kp3 <- k + 3
nmkm3 <- n - k - 3
gqarr <- array(NA, dim=c(nmkm3-kp3+1,3))
numgqtests <- 0
numsignificant1 <- 0
numsignificant5 <- 0
numsignificant10 <- 0
for (mypoint in kp3:nmkm3) {
j <- 0
numgqtests <- numgqtests + 1
for (myalt in c('greater', 'two.sided', 'less')) {
j <- j + 1
gqarr[mypoint-kp3+1,j] <- gqtest(mylm, point=mypoint, alternative=myalt)$p.value
}
if (gqarr[mypoint-kp3+1,2] < 0.01) numsignificant1 <- numsignificant1 + 1
if (gqarr[mypoint-kp3+1,2] < 0.05) numsignificant5 <- numsignificant5 + 1
if (gqarr[mypoint-kp3+1,2] < 0.10) numsignificant10 <- numsignificant10 + 1
}
gqarr
}
bitmap(file='test0.png')
plot(x[,1], type='l', main='Actuals and Interpolation', ylab='value of Actuals and Interpolation (dots)', xlab='time or index')
points(x[,1]-mysum$resid)
grid()
dev.off()
bitmap(file='test1.png')
plot(mysum$resid, type='b', pch=19, main='Residuals', ylab='value of Residuals', xlab='time or index')
grid()
dev.off()
bitmap(file='test2.png')
hist(mysum$resid, main='Residual Histogram', xlab='values of Residuals')
grid()
dev.off()
bitmap(file='test3.png')
densityplot(~mysum$resid,col='black',main='Residual Density Plot', xlab='values of Residuals')
dev.off()
bitmap(file='test4.png')
qqnorm(mysum$resid, main='Residual Normal Q-Q Plot')
qqline(mysum$resid)
grid()
dev.off()
(myerror <- as.ts(mysum$resid))
bitmap(file='test5.png')
dum <- cbind(lag(myerror,k=1),myerror)
dum
dum1 <- dum[2:length(myerror),]
dum1
z <- as.data.frame(dum1)
z
plot(z,main=paste('Residual Lag plot, lowess, and regression line'), ylab='values of Residuals', xlab='lagged values of Residuals')
lines(lowess(z))
abline(lm(z))
grid()
dev.off()
bitmap(file='test6.png')
acf(mysum$resid, lag.max=length(mysum$resid)/2, main='Residual Autocorrelation Function')
grid()
dev.off()
bitmap(file='test7.png')
pacf(mysum$resid, lag.max=length(mysum$resid)/2, main='Residual Partial Autocorrelation Function')
grid()
dev.off()
bitmap(file='test8.png')
opar <- par(mfrow = c(2,2), oma = c(0, 0, 1.1, 0))
plot(mylm, las = 1, sub='Residual Diagnostics')
par(opar)
dev.off()
if (n > n25) {
bitmap(file='test9.png')
plot(kp3:nmkm3,gqarr[,2], main='Goldfeld-Quandt test',ylab='2-sided p-value',xlab='breakpoint')
grid()
dev.off()
}
load(file='createtable')
a<-table.start()
a<-table.row.start(a)
a<-table.element(a, 'Multiple Linear Regression - Estimated Regression Equation', 1, TRUE)
a<-table.row.end(a)
myeq <- colnames(x)[1]
myeq <- paste(myeq, '[t] = ', sep='')
for (i in 1:k){
if (mysum$coefficients[i,1] > 0) myeq <- paste(myeq, '+', '')
myeq <- paste(myeq, mysum$coefficients[i,1], sep=' ')
if (rownames(mysum$coefficients)[i] != '(Intercept)') {
myeq <- paste(myeq, rownames(mysum$coefficients)[i], sep='')
if (rownames(mysum$coefficients)[i] != 't') myeq <- paste(myeq, '[t]', sep='')
}
}
myeq <- paste(myeq, ' + e[t]')
a<-table.row.start(a)
a<-table.element(a, myeq)
a<-table.row.end(a)
a<-table.end(a)
table.save(a,file='mytable1.tab')
a<-table.start()
a<-table.row.start(a)
a<-table.element(a,hyperlink('ols1.htm','Multiple Linear Regression - Ordinary Least Squares',''), 6, TRUE)
a<-table.row.end(a)
a<-table.row.start(a)
a<-table.element(a,'Variable',header=TRUE)
a<-table.element(a,'Parameter',header=TRUE)
a<-table.element(a,'S.D.',header=TRUE)
a<-table.element(a,'T-STAT
H0: parameter = 0',header=TRUE)
a<-table.element(a,'2-tail p-value',header=TRUE)
a<-table.element(a,'1-tail p-value',header=TRUE)
a<-table.row.end(a)
for (i in 1:k){
a<-table.row.start(a)
a<-table.element(a,rownames(mysum$coefficients)[i],header=TRUE)
a<-table.element(a,mysum$coefficients[i,1])
a<-table.element(a, round(mysum$coefficients[i,2],6))
a<-table.element(a, round(mysum$coefficients[i,3],4))
a<-table.element(a, round(mysum$coefficients[i,4],6))
a<-table.element(a, round(mysum$coefficients[i,4]/2,6))
a<-table.row.end(a)
}
a<-table.end(a)
table.save(a,file='mytable2.tab')
a<-table.start()
a<-table.row.start(a)
a<-table.element(a, 'Multiple Linear Regression - Regression Statistics', 2, TRUE)
a<-table.row.end(a)
a<-table.row.start(a)
a<-table.element(a, 'Multiple R',1,TRUE)
a<-table.element(a, sqrt(mysum$r.squared))
a<-table.row.end(a)
a<-table.row.start(a)
a<-table.element(a, 'R-squared',1,TRUE)
a<-table.element(a, mysum$r.squared)
a<-table.row.end(a)
a<-table.row.start(a)
a<-table.element(a, 'Adjusted R-squared',1,TRUE)
a<-table.element(a, mysum$adj.r.squared)
a<-table.row.end(a)
a<-table.row.start(a)
a<-table.element(a, 'F-TEST (value)',1,TRUE)
a<-table.element(a, mysum$fstatistic[1])
a<-table.row.end(a)
a<-table.row.start(a)
a<-table.element(a, 'F-TEST (DF numerator)',1,TRUE)
a<-table.element(a, mysum$fstatistic[2])
a<-table.row.end(a)
a<-table.row.start(a)
a<-table.element(a, 'F-TEST (DF denominator)',1,TRUE)
a<-table.element(a, mysum$fstatistic[3])
a<-table.row.end(a)
a<-table.row.start(a)
a<-table.element(a, 'p-value',1,TRUE)
a<-table.element(a, 1-pf(mysum$fstatistic[1],mysum$fstatistic[2],mysum$fstatistic[3]))
a<-table.row.end(a)
a<-table.row.start(a)
a<-table.element(a, 'Multiple Linear Regression - Residual Statistics', 2, TRUE)
a<-table.row.end(a)
a<-table.row.start(a)
a<-table.element(a, 'Residual Standard Deviation',1,TRUE)
a<-table.element(a, mysum$sigma)
a<-table.row.end(a)
a<-table.row.start(a)
a<-table.element(a, 'Sum Squared Residuals',1,TRUE)
a<-table.element(a, sum(myerror*myerror))
a<-table.row.end(a)
a<-table.end(a)
table.save(a,file='mytable3.tab')
a<-table.start()
a<-table.row.start(a)
a<-table.element(a, 'Multiple Linear Regression - Actuals, Interpolation, and Residuals', 4, TRUE)
a<-table.row.end(a)
a<-table.row.start(a)
a<-table.element(a, 'Time or Index', 1, TRUE)
a<-table.element(a, 'Actuals', 1, TRUE)
a<-table.element(a, 'Interpolation
Forecast', 1, TRUE)
a<-table.element(a, 'Residuals
Prediction Error', 1, TRUE)
a<-table.row.end(a)
for (i in 1:n) {
a<-table.row.start(a)
a<-table.element(a,i, 1, TRUE)
a<-table.element(a,x[i])
a<-table.element(a,x[i]-mysum$resid[i])
a<-table.element(a,mysum$resid[i])
a<-table.row.end(a)
}
a<-table.end(a)
table.save(a,file='mytable4.tab')
if (n > n25) {
a<-table.start()
a<-table.row.start(a)
a<-table.element(a,'Goldfeld-Quandt test for Heteroskedasticity',4,TRUE)
a<-table.row.end(a)
a<-table.row.start(a)
a<-table.element(a,'p-values',header=TRUE)
a<-table.element(a,'Alternative Hypothesis',3,header=TRUE)
a<-table.row.end(a)
a<-table.row.start(a)
a<-table.element(a,'breakpoint index',header=TRUE)
a<-table.element(a,'greater',header=TRUE)
a<-table.element(a,'2-sided',header=TRUE)
a<-table.element(a,'less',header=TRUE)
a<-table.row.end(a)
for (mypoint in kp3:nmkm3) {
a<-table.row.start(a)
a<-table.element(a,mypoint,header=TRUE)
a<-table.element(a,gqarr[mypoint-kp3+1,1])
a<-table.element(a,gqarr[mypoint-kp3+1,2])
a<-table.element(a,gqarr[mypoint-kp3+1,3])
a<-table.row.end(a)
}
a<-table.end(a)
table.save(a,file='mytable5.tab')
a<-table.start()
a<-table.row.start(a)
a<-table.element(a,'Meta Analysis of Goldfeld-Quandt test for Heteroskedasticity',4,TRUE)
a<-table.row.end(a)
a<-table.row.start(a)
a<-table.element(a,'Description',header=TRUE)
a<-table.element(a,'# significant tests',header=TRUE)
a<-table.element(a,'% significant tests',header=TRUE)
a<-table.element(a,'OK/NOK',header=TRUE)
a<-table.row.end(a)
a<-table.row.start(a)
a<-table.element(a,'1% type I error level',header=TRUE)
a<-table.element(a,numsignificant1)
a<-table.element(a,numsignificant1/numgqtests)
if (numsignificant1/numgqtests < 0.01) dum <- 'OK' else dum <- 'NOK'
a<-table.element(a,dum)
a<-table.row.end(a)
a<-table.row.start(a)
a<-table.element(a,'5% type I error level',header=TRUE)
a<-table.element(a,numsignificant5)
a<-table.element(a,numsignificant5/numgqtests)
if (numsignificant5/numgqtests < 0.05) dum <- 'OK' else dum <- 'NOK'
a<-table.element(a,dum)
a<-table.row.end(a)
a<-table.row.start(a)
a<-table.element(a,'10% type I error level',header=TRUE)
a<-table.element(a,numsignificant10)
a<-table.element(a,numsignificant10/numgqtests)
if (numsignificant10/numgqtests < 0.1) dum <- 'OK' else dum <- 'NOK'
a<-table.element(a,dum)
a<-table.row.end(a)
a<-table.end(a)
table.save(a,file='mytable6.tab')
}