| Multiple Linear Regression - Estimated Regression Equation |
| prijsindex[t] = + 228.733517073554 -1.64854689736647gezondheid[t] + 0.59891940633533tabak[t] -0.34359909436074t + e[t] |
| Multiple Linear Regression - Ordinary Least Squares | |||||
| Variable | Parameter | S.D. | T-STAT H0: parameter = 0 | 2-tail p-value | 1-tail p-value |
| (Intercept) | 228.733517073554 | 43.507568 | 5.2573 | 4e-06 | 2e-06 |
| gezondheid | -1.64854689736647 | 0.361864 | -4.5557 | 3.8e-05 | 1.9e-05 |
| tabak | 0.59891940633533 | 0.116059 | 5.1605 | 5e-06 | 3e-06 |
| t | -0.34359909436074 | 0.062871 | -5.4651 | 2e-06 | 1e-06 |
| Multiple Linear Regression - Regression Statistics | |
| Multiple R | 0.951120874863822 |
| R-squared | 0.904630918601722 |
| Adjusted R-squared | 0.898411195901834 |
| F-TEST (value) | 145.445538692272 |
| F-TEST (DF numerator) | 3 |
| F-TEST (DF denominator) | 46 |
| p-value | 0 |
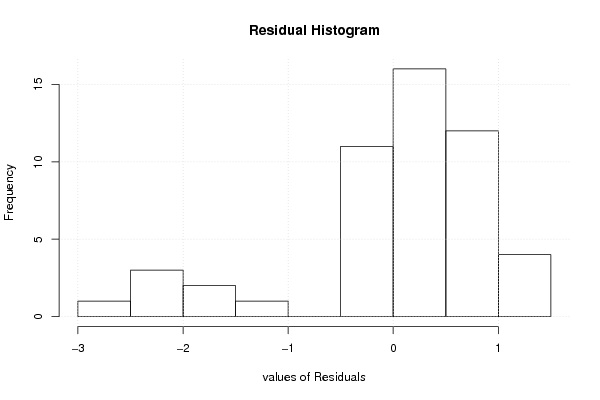
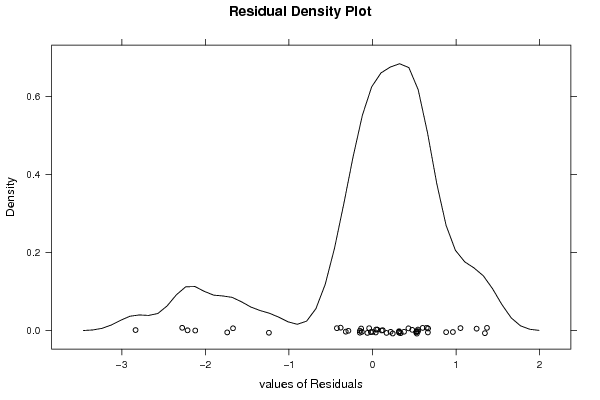
| Multiple Linear Regression - Residual Statistics | |
| Residual Standard Deviation | 0.968187319599203 |
| Sum Squared Residuals | 43.1197875483037 |
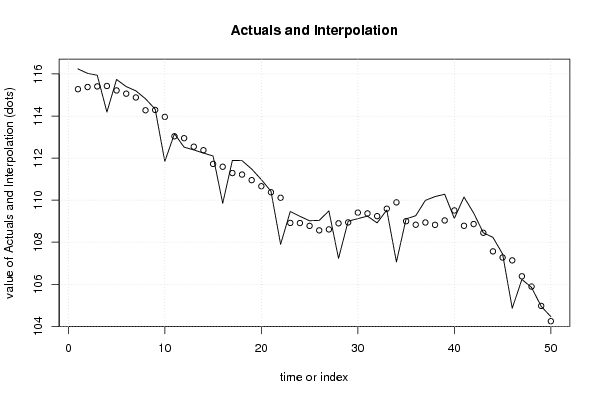
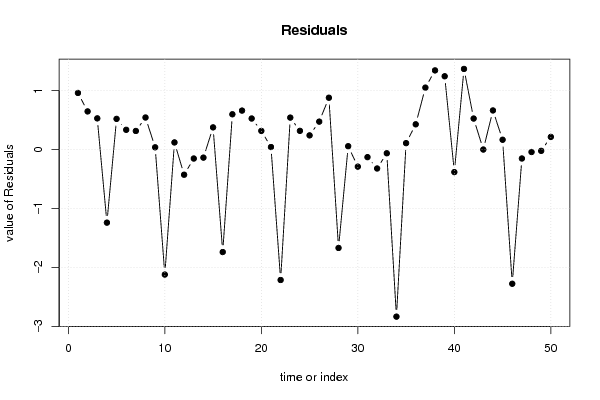
| Multiple Linear Regression - Actuals, Interpolation, and Residuals | |||
| Time or Index | Actuals | Interpolation Forecast | Residuals Prediction Error |
| 1 | 116.24 | 115.277977793169 | 0.962022206831092 |
| 2 | 116.03 | 115.381211439105 | 0.6487885608954 |
| 3 | 115.94 | 115.409367565056 | 0.530632434943825 |
| 4 | 114.19 | 115.429687936541 | -1.23968793654136 |
| 5 | 115.74 | 115.218033335168 | 0.521966664832281 |
| 6 | 115.4 | 115.06342793039 | 0.336572069609652 |
| 7 | 115.2 | 114.883444377341 | 0.316555622659053 |
| 8 | 114.82 | 114.274960113372 | 0.545039886628172 |
| 9 | 114.33 | 114.290955627603 | 0.0390443723966369 |
| 10 | 111.84 | 113.961120740575 | -2.12112074057458 |
| 11 | 113.16 | 113.037930452889 | 0.122069547110556 |
| 12 | 112.52 | 112.946181215178 | -0.426181215178381 |
| 13 | 112.39 | 112.541208066968 | -0.151208066967719 |
| 14 | 112.24 | 112.375984904884 | -0.135984904884497 |
| 15 | 112.1 | 111.722429832446 | 0.3775701675542 |
| 16 | 109.85 | 111.588634753896 | -1.73863475389572 |
| 17 | 111.89 | 111.289924244411 | 0.600075755588755 |
| 18 | 111.88 | 111.217381737316 | 0.662618262684419 |
| 19 | 111.48 | 110.95188513057 | 0.528114869430492 |
| 20 | 110.98 | 110.662310265174 | 0.317689734825508 |
| 21 | 110.42 | 110.376003332201 | 0.0439966677988616 |
| 22 | 107.9 | 110.113531693086 | -2.21353169308565 |
| 23 | 109.46 | 108.916442074098 | 0.543557925901819 |
| 24 | 109.23 | 108.911445038509 | 0.318554961490908 |
| 25 | 109.02 | 108.777832183552 | 0.242167816447625 |
| 26 | 109.04 | 108.564816951358 | 0.475183048642145 |
| 27 | 109.49 | 108.60927632269 | 0.880723677310208 |
| 28 | 107.23 | 108.899353391817 | -1.66935339181694 |
| 29 | 109 | 108.942148426339 | 0.0578515736608395 |
| 30 | 109.12 | 109.408815608539 | -0.288815608538604 |
| 31 | 109.24 | 109.367883408569 | -0.127883408569423 |
| 32 | 108.92 | 109.240259747676 | -0.320259747676023 |
| 33 | 109.53 | 109.591953835444 | -0.0619538354442193 |
| 34 | 107.06 | 109.895734370706 | -2.83573437070558 |
| 35 | 109.11 | 108.999890274091 | 0.110109725908963 |
| 36 | 109.26 | 108.830160031161 | 0.429839968839133 |
| 37 | 109.99 | 108.937597051955 | 1.05240294804535 |
| 38 | 110.17 | 108.825037488016 | 1.34496251198369 |
| 39 | 110.28 | 109.03447303148 | 1.24552696851958 |
| 40 | 109.13 | 109.511697229788 | -0.38169722978795 |
| 41 | 110.15 | 108.780404116921 | 1.36959588307883 |
| 42 | 109.39 | 108.86228076585 | 0.527719234150375 |
| 43 | 108.45 | 108.448657903132 | 0.00134209686834286 |
| 44 | 108.23 | 107.564792194644 | 0.665207805356186 |
| 45 | 107.44 | 107.272435326409 | 0.167564673590667 |
| 46 | 104.86 | 107.137279617038 | -2.27727961703844 |
| 47 | 106.23 | 106.3806083559 | -0.150608355899617 |
| 48 | 105.85 | 105.890486601179 | -0.0404866011789387 |
| 49 | 104.95 | 104.970624987113 | -0.0206249871132063 |
| 50 | 104.46 | 104.244021178687 | 0.21597882131329 |
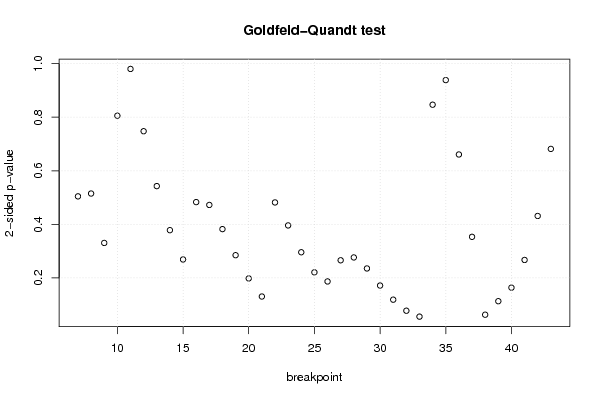
| Goldfeld-Quandt test for Heteroskedasticity | |||
| p-values | Alternative Hypothesis | ||
| breakpoint index | greater | 2-sided | less |
| 7 | 0.252279365343596 | 0.504558730687193 | 0.747720634656404 |
| 8 | 0.257535916525211 | 0.515071833050422 | 0.742464083474789 |
| 9 | 0.165250079839447 | 0.330500159678895 | 0.834749920160553 |
| 10 | 0.597137091364419 | 0.805725817271162 | 0.402862908635581 |
| 11 | 0.490177372049311 | 0.980354744098622 | 0.509822627950689 |
| 12 | 0.373876706738414 | 0.747753413476828 | 0.626123293261586 |
| 13 | 0.27141314936732 | 0.54282629873464 | 0.72858685063268 |
| 14 | 0.189133325666527 | 0.378266651333054 | 0.810866674333473 |
| 15 | 0.134404478912709 | 0.268808957825418 | 0.865595521087291 |
| 16 | 0.241572400301101 | 0.483144800602202 | 0.758427599698899 |
| 17 | 0.236234266486315 | 0.47246853297263 | 0.763765733513685 |
| 18 | 0.191100682015632 | 0.382201364031264 | 0.808899317984368 |
| 19 | 0.142398923655597 | 0.284797847311193 | 0.857601076344403 |
| 20 | 0.0990170818358778 | 0.198034163671756 | 0.900982918164122 |
| 21 | 0.0652672400286423 | 0.130534480057285 | 0.934732759971358 |
| 22 | 0.240917549854989 | 0.481835099709977 | 0.759082450145012 |
| 23 | 0.198026463225538 | 0.396052926451076 | 0.801973536774462 |
| 24 | 0.147900330269864 | 0.295800660539727 | 0.852099669730136 |
| 25 | 0.110389234707855 | 0.22077846941571 | 0.889610765292145 |
| 26 | 0.0933847232889185 | 0.186769446577837 | 0.906615276711082 |
| 27 | 0.132901376672446 | 0.265802753344892 | 0.867098623327554 |
| 28 | 0.138210351471773 | 0.276420702943545 | 0.861789648528227 |
| 29 | 0.117638521133407 | 0.235277042266814 | 0.882361478866593 |
| 30 | 0.0857386113276426 | 0.171477222655285 | 0.914261388672357 |
| 31 | 0.0593485461881727 | 0.118697092376345 | 0.940651453811827 |
| 32 | 0.0387096404468252 | 0.0774192808936504 | 0.961290359553175 |
| 33 | 0.027648968466228 | 0.0552979369324559 | 0.972351031533772 |
| 34 | 0.423401529239863 | 0.846803058479725 | 0.576598470760137 |
| 35 | 0.53061630790316 | 0.938767384193681 | 0.469383692096841 |
| 36 | 0.669543044501492 | 0.660913910997016 | 0.330456955498508 |
| 37 | 0.823323170956819 | 0.353353658086362 | 0.176676829043181 |
| 38 | 0.968744321670148 | 0.0625113566597047 | 0.0312556783298523 |
| 39 | 0.943492475170835 | 0.11301504965833 | 0.0565075248291652 |
| 40 | 0.918207450596129 | 0.163585098807743 | 0.0817925494038714 |
| 41 | 0.86648670987582 | 0.267026580248361 | 0.13351329012418 |
| 42 | 0.784372700053894 | 0.431254599892213 | 0.215627299946106 |
| 43 | 0.659125323219397 | 0.681749353561207 | 0.340874676780603 |
| Meta Analysis of Goldfeld-Quandt test for Heteroskedasticity | |||
| Description | # significant tests | % significant tests | OK/NOK |
| 1% type I error level | 0 | 0 | OK |
| 5% type I error level | 0 | 0 | OK |
| 10% type I error level | 3 | 0.0810810810810811 | OK |