| Multiple Linear Regression - Estimated Regression Equation |
| Rate[t] = + 3.10886257200391 + 0.370918572255257Heart_disease[t] + 1.28807495597693Cancer[t] + 7.87100858055455`Diabetes `[t] + e[t] |
| Multiple Linear Regression - Ordinary Least Squares | |||||
| Variable | Parameter | S.D. | T-STAT H0: parameter = 0 | 2-tail p-value | 1-tail p-value |
| (Intercept) | 3.10886257200391 | 0.921971 | 3.372 | 0.001795 | 0.000898 |
| Heart_disease | 0.370918572255257 | 0.022403 | 16.5569 | 0 | 0 |
| Cancer | 1.28807495597693 | 0.370402 | 3.4775 | 0.00134 | 0.00067 |
| `Diabetes ` | 7.87100858055455 | 0.668362 | 11.7766 | 0 | 0 |
| Multiple Linear Regression - Regression Statistics | |
| Multiple R | 0.973057227616687 |
| R-squared | 0.946840368217073 |
| Adjusted R-squared | 0.94241039890183 |
| F-TEST (value) | 213.735197884762 |
| F-TEST (DF numerator) | 3 |
| F-TEST (DF denominator) | 36 |
| p-value | 0 |
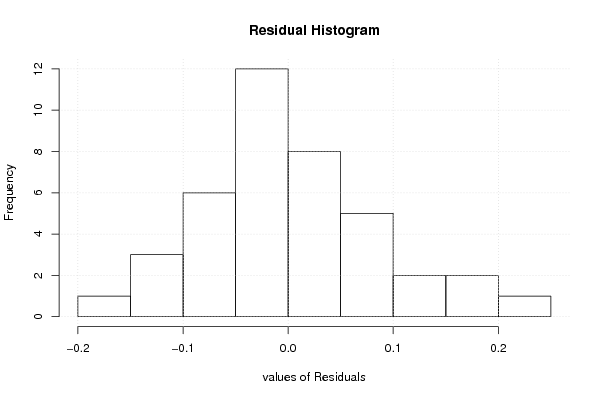
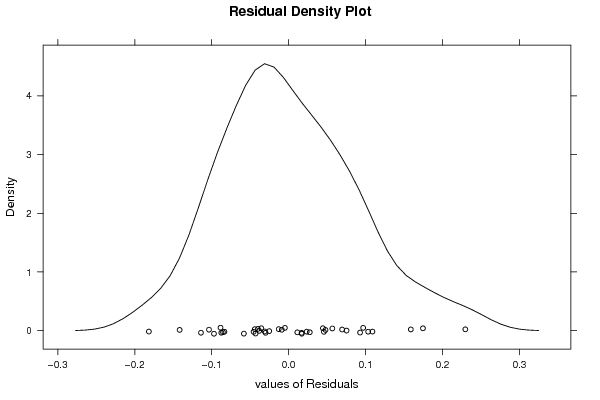
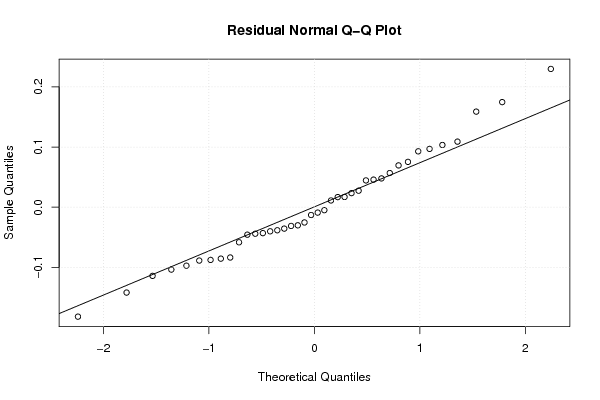
| Multiple Linear Regression - Residual Statistics | |
| Residual Standard Deviation | 0.0918323740289117 |
| Sum Squared Residuals | 0.303594657112294 |
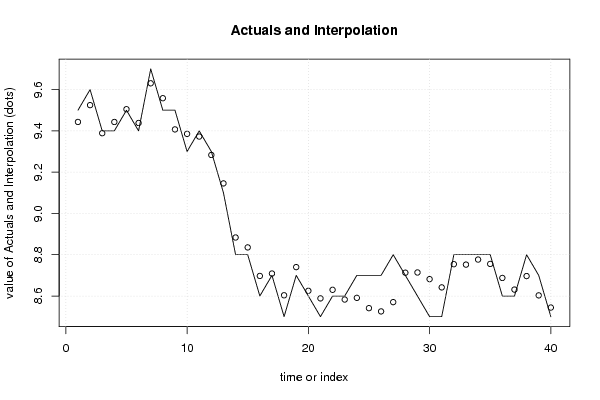
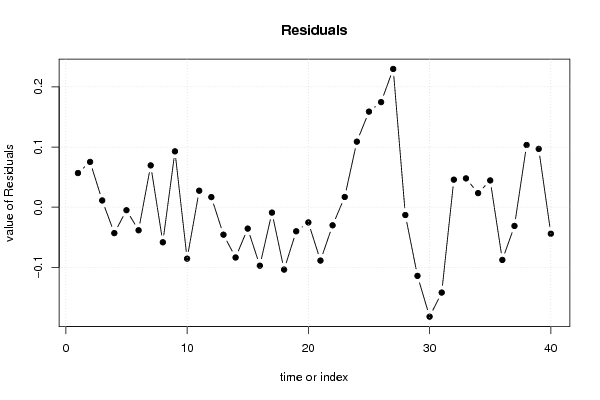
| Multiple Linear Regression - Actuals, Interpolation, and Residuals | |||
| Time or Index | Actuals | Interpolation Forecast | Residuals Prediction Error |
| 1 | 9.5 | 9.44320493000217 | 0.0567950699978308 |
| 2 | 9.6 | 9.52470272948521 | 0.0752972705147905 |
| 3 | 9.4 | 9.38875322046283 | 0.0112467795371718 |
| 4 | 9.4 | 9.44303140532654 | -0.0430314053265431 |
| 5 | 9.5 | 9.5048991985549 | -0.0048991985548993 |
| 6 | 9.4 | 9.4382602166195 | -0.0382602166194881 |
| 7 | 9.7 | 9.63049837404176 | 0.0695016259582396 |
| 8 | 9.5 | 9.55822169475247 | -0.0582216947524737 |
| 9 | 9.5 | 9.4071503251505 | 0.092849674849503 |
| 10 | 9.3 | 9.38542465266463 | -0.0854246526646274 |
| 11 | 9.4 | 9.3725485836124 | 0.0274514163876041 |
| 12 | 9.3 | 9.28317197575565 | 0.016828024244348 |
| 13 | 9.1 | 9.1456009141071 | -0.0456009141070965 |
| 14 | 8.8 | 8.88351618433099 | -0.0835161843309856 |
| 15 | 8.8 | 8.83551241602302 | -0.0355124160230194 |
| 16 | 8.6 | 8.69710880249789 | -0.0971088024978867 |
| 17 | 8.7 | 8.70891795471642 | -0.00891795471641874 |
| 18 | 8.5 | 8.603570969971 | -0.103570969971003 |
| 19 | 8.7 | 8.73997839482423 | -0.0399783948242335 |
| 20 | 8.6 | 8.62529352317126 | -0.0252935231712625 |
| 21 | 8.5 | 8.58860942723219 | -0.088609427232185 |
| 22 | 8.6 | 8.63002714262996 | -0.0300271426299637 |
| 23 | 8.6 | 8.58297760676157 | 0.0170223932384278 |
| 24 | 8.7 | 8.59106509295687 | 0.108934907043134 |
| 25 | 8.7 | 8.54117828705444 | 0.158821712945559 |
| 26 | 8.7 | 8.52537194548002 | 0.17462805451998 |
| 27 | 8.8 | 8.57029136515448 | 0.229708634845517 |
| 28 | 8.7 | 8.71292554660763 | -0.0129255466076278 |
| 29 | 8.6 | 8.71401921860629 | -0.114019218606285 |
| 30 | 8.5 | 8.68176958291391 | -0.18176958291391 |
| 31 | 8.5 | 8.64175873709116 | -0.141758737091156 |
| 32 | 8.8 | 8.75416997067144 | 0.0458300293285592 |
| 33 | 8.8 | 8.75211221202563 | 0.0478877879743677 |
| 34 | 8.8 | 8.77656499124916 | 0.0234350087508412 |
| 35 | 8.8 | 8.75547530827276 | 0.0445246917272422 |
| 36 | 8.6 | 8.68753049238529 | -0.0875304923852854 |
| 37 | 8.6 | 8.63109255021874 | -0.0310925502187356 |
| 38 | 8.8 | 8.69660460656847 | 0.103395393431531 |
| 39 | 8.7 | 8.60309857140204 | 0.0969014285979596 |
| 40 | 8.5 | 8.54399087864752 | -0.0439908786475188 |
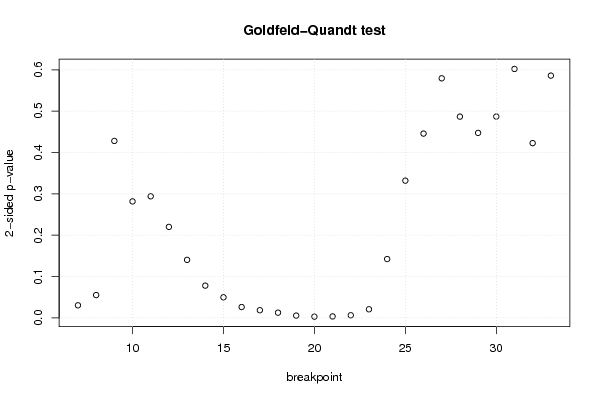
| Goldfeld-Quandt test for Heteroskedasticity | |||
| p-values | Alternative Hypothesis | ||
| breakpoint index | greater | 2-sided | less |
| 7 | 0.0152771495955996 | 0.0305542991911992 | 0.9847228504044 |
| 8 | 0.027657851054203 | 0.055315702108406 | 0.972342148945797 |
| 9 | 0.21397460887905 | 0.4279492177581 | 0.78602539112095 |
| 10 | 0.14089468745021 | 0.281789374900419 | 0.85910531254979 |
| 11 | 0.147055990797345 | 0.29411198159469 | 0.852944009202655 |
| 12 | 0.110048235547303 | 0.220096471094605 | 0.889951764452697 |
| 13 | 0.0702075171855498 | 0.1404150343711 | 0.92979248281445 |
| 14 | 0.0390727019905126 | 0.0781454039810252 | 0.960927298009487 |
| 15 | 0.0249828466624856 | 0.0499656933249711 | 0.975017153337514 |
| 16 | 0.0131686592163296 | 0.0263373184326592 | 0.98683134078367 |
| 17 | 0.00935816234831602 | 0.018716324696632 | 0.990641837651684 |
| 18 | 0.00637217359923702 | 0.012744347198474 | 0.993627826400763 |
| 19 | 0.00285911138915131 | 0.00571822277830261 | 0.997140888610849 |
| 20 | 0.0015730413030124 | 0.0031460826060248 | 0.998426958696988 |
| 21 | 0.00185622948370835 | 0.00371245896741671 | 0.998143770516292 |
| 22 | 0.00325326781324269 | 0.00650653562648537 | 0.996746732186757 |
| 23 | 0.0104831162823458 | 0.0209662325646917 | 0.989516883717654 |
| 24 | 0.0712311970770607 | 0.142462394154121 | 0.92876880292294 |
| 25 | 0.165957815585137 | 0.331915631170273 | 0.834042184414863 |
| 26 | 0.22285928992574 | 0.445718579851479 | 0.77714071007426 |
| 27 | 0.710312857677545 | 0.579374284644909 | 0.289687142322455 |
| 28 | 0.756633919181698 | 0.486732161636603 | 0.243366080818302 |
| 29 | 0.776315111580478 | 0.447369776839044 | 0.223684888419522 |
| 30 | 0.75652730651117 | 0.48694538697766 | 0.24347269348883 |
| 31 | 0.699006030056852 | 0.601987939886296 | 0.300993969943148 |
| 32 | 0.78866268748368 | 0.422674625032639 | 0.211337312516319 |
| 33 | 0.707068950939803 | 0.585862098120394 | 0.292931049060197 |
| Meta Analysis of Goldfeld-Quandt test for Heteroskedasticity | |||
| Description | # significant tests | % significant tests | OK/NOK |
| 1% type I error level | 4 | 0.148148148148148 | NOK |
| 5% type I error level | 10 | 0.37037037037037 | NOK |
| 10% type I error level | 12 | 0.444444444444444 | NOK |