| Multiple Linear Regression - Estimated Regression Equation |
| Cancer[t] = + 9.85008549642589 -0.00433295121643938Year[t] + 0.220653055238072Rate[t] -0.165991233759688Heart_disease[t] -2.42906802854214`Diabetes `[t] + e[t] |
| Multiple Linear Regression - Ordinary Least Squares | |||||
| Variable | Parameter | S.D. | T-STAT H0: parameter = 0 | 2-tail p-value | 1-tail p-value |
| (Intercept) | 9.85008549642589 | 14.35166 | 0.6863 | 0.497022 | 0.248511 |
| Year | -0.00433295121643938 | 0.00722 | -0.6001 | 0.552284 | 0.276142 |
| Rate | 0.220653055238072 | 0.070746 | 3.1189 | 0.003622 | 0.001811 |
| Heart_disease | -0.165991233759688 | 0.102635 | -1.6173 | 0.114794 | 0.057397 |
| `Diabetes ` | -2.42906802854214 | 0.421367 | -5.7647 | 2e-06 | 1e-06 |
| Multiple Linear Regression - Regression Statistics | |
| Multiple R | 0.867336184417206 |
| R-squared | 0.752272056799398 |
| Adjusted R-squared | 0.723960291862186 |
| F-TEST (value) | 26.5710053212065 |
| F-TEST (DF numerator) | 4 |
| F-TEST (DF denominator) | 35 |
| p-value | 3.51375706308943e-10 |
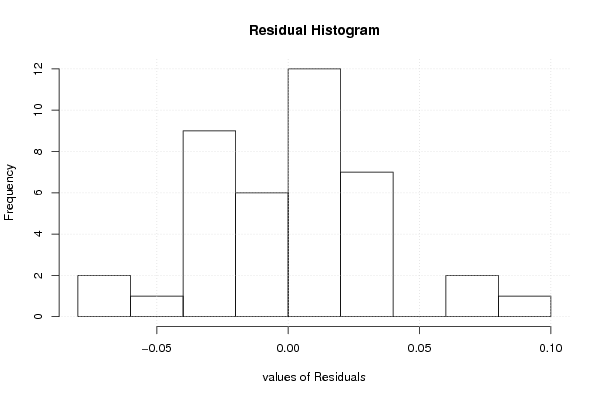
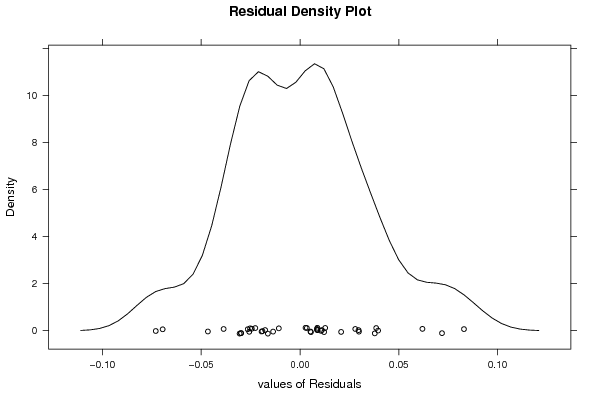
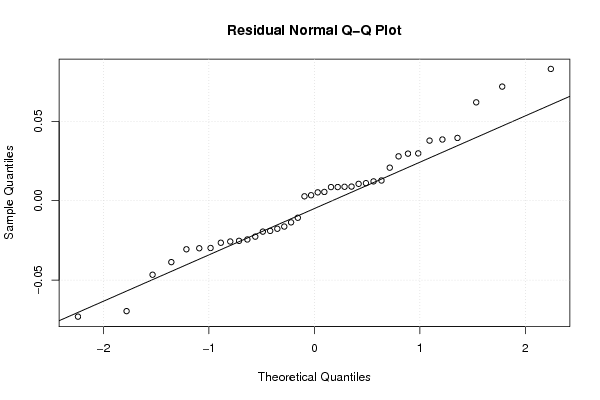
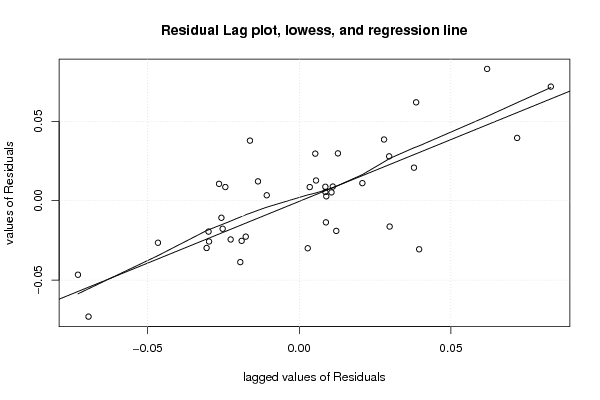
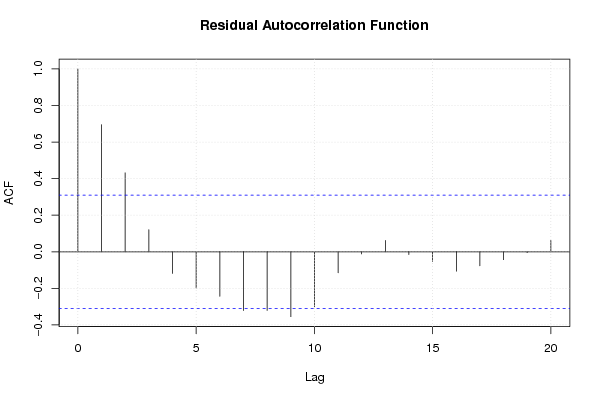
| Multiple Linear Regression - Residual Statistics | |
| Residual Standard Deviation | 0.036072444883317 |
| Sum Squared Residuals | 0.0455427447950979 |
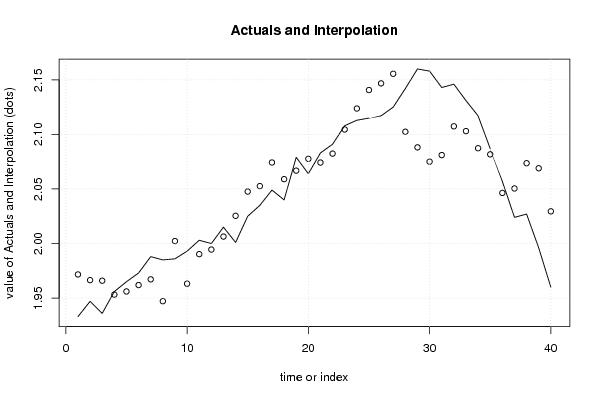
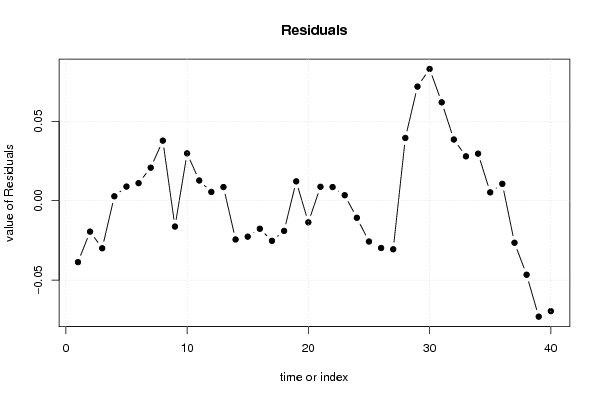
| Multiple Linear Regression - Actuals, Interpolation, and Residuals | |||
| Time or Index | Actuals | Interpolation Forecast | Residuals Prediction Error |
| 1 | 1.933 | 1.97166467927529 | -0.0386646792752893 |
| 2 | 1.947 | 1.96646226324557 | -0.0194622632455667 |
| 3 | 1.936 | 1.96593734713846 | -0.0299373471384635 |
| 4 | 1.956 | 1.95321605367793 | 0.00278394632206691 |
| 5 | 1.965 | 1.95610281782438 | 0.00889718217561827 |
| 6 | 1.973 | 1.96195125071157 | 0.011048749288432 |
| 7 | 1.988 | 1.96720447579739 | 0.0207955242026108 |
| 8 | 1.985 | 1.9471698047843 | 0.0378301952157046 |
| 9 | 1.986 | 2.00227328513228 | -0.0162732851322782 |
| 10 | 1.993 | 1.96319401251487 | 0.0298059874851265 |
| 11 | 2.003 | 1.99026626619084 | 0.0127337338091629 |
| 12 | 2 | 1.99448276681868 | 0.00551723318131994 |
| 13 | 2.015 | 2.00639078304375 | 0.00860921695624715 |
| 14 | 2.001 | 2.02539872028732 | -0.0243987202873247 |
| 15 | 2.025 | 2.04763593635089 | -0.022635936350889 |
| 16 | 2.035 | 2.05266110131416 | -0.0176611013141615 |
| 17 | 2.049 | 2.07427205447586 | -0.0252720544758554 |
| 18 | 2.04 | 2.05901830884219 | -0.0190183088421929 |
| 19 | 2.079 | 2.06681248095735 | 0.0121875190426526 |
| 20 | 2.064 | 2.07762424065752 | -0.0136242406575247 |
| 21 | 2.083 | 2.07422155473222 | 0.00877844526777828 |
| 22 | 2.091 | 2.08240362815918 | 0.00859637184081935 |
| 23 | 2.108 | 2.10455206366664 | 0.00344793633336154 |
| 24 | 2.113 | 2.12373394879979 | -0.0107339487997902 |
| 25 | 2.115 | 2.14069226578264 | -0.025692265782644 |
| 26 | 2.117 | 2.14677237201501 | -0.0297723720150118 |
| 27 | 2.125 | 2.15557402009896 | -0.0305740200989566 |
| 28 | 2.142 | 2.10247726556589 | 0.0395227344341075 |
| 29 | 2.16 | 2.08815197861205 | 0.0718480213879503 |
| 30 | 2.158 | 2.07503302057258 | 0.0829669794274215 |
| 31 | 2.143 | 2.08105232632709 | 0.0619476736729069 |
| 32 | 2.146 | 2.1074588084567 | 0.0385411915432985 |
| 33 | 2.131 | 2.10305348688396 | 0.0279465131160444 |
| 34 | 2.117 | 2.08736076141555 | 0.0296392385844496 |
| 35 | 2.087 | 2.08173270072863 | 0.00526729927136689 |
| 36 | 2.057 | 2.04638244593159 | 0.0106175540684053 |
| 37 | 2.024 | 2.05047065735885 | -0.026470657358846 |
| 38 | 2.027 | 2.07361323365755 | -0.0466132336575455 |
| 39 | 1.996 | 2.06900421881787 | -0.0730042188178712 |
| 40 | 1.96 | 2.02952059337664 | -0.0695205933766406 |
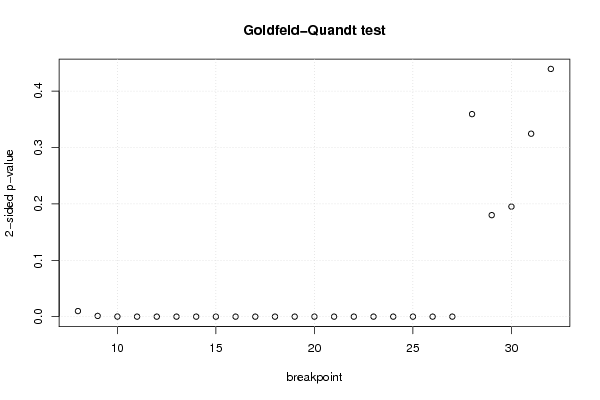
| Goldfeld-Quandt test for Heteroskedasticity | |||
| p-values | Alternative Hypothesis | ||
| breakpoint index | greater | 2-sided | less |
| 8 | 0.00496726734122971 | 0.00993453468245942 | 0.99503273265877 |
| 9 | 0.00066053559529042 | 0.00132107119058084 | 0.99933946440471 |
| 10 | 7.74934960952028e-05 | 0.000154986992190406 | 0.999922506503905 |
| 11 | 8.64199139028549e-06 | 1.7283982780571e-05 | 0.99999135800861 |
| 12 | 1.89556011672931e-06 | 3.79112023345861e-06 | 0.999998104439883 |
| 13 | 4.63894129019207e-06 | 9.27788258038414e-06 | 0.99999536105871 |
| 14 | 6.41816373439772e-07 | 1.28363274687954e-06 | 0.999999358183627 |
| 15 | 5.85674965702096e-07 | 1.17134993140419e-06 | 0.999999414325034 |
| 16 | 4.87535089475572e-07 | 9.75070178951145e-07 | 0.99999951246491 |
| 17 | 4.72563893074171e-07 | 9.45127786148342e-07 | 0.999999527436107 |
| 18 | 2.62230615389973e-06 | 5.24461230779945e-06 | 0.999997377693846 |
| 19 | 1.43242571917353e-06 | 2.86485143834705e-06 | 0.999998567574281 |
| 20 | 7.73120970047312e-06 | 1.54624194009462e-05 | 0.9999922687903 |
| 21 | 1.11922374919484e-05 | 2.23844749838967e-05 | 0.999988807762508 |
| 22 | 4.01678828638499e-06 | 8.03357657276999e-06 | 0.999995983211714 |
| 23 | 2.06745942926022e-06 | 4.13491885852044e-06 | 0.999997932540571 |
| 24 | 9.45188711829552e-07 | 1.8903774236591e-06 | 0.999999054811288 |
| 25 | 7.81883800976076e-07 | 1.56376760195215e-06 | 0.999999218116199 |
| 26 | 7.5239529748978e-07 | 1.50479059497956e-06 | 0.999999247604702 |
| 27 | 1.47963762821483e-05 | 2.95927525642966e-05 | 0.999985203623718 |
| 28 | 0.179546021707549 | 0.359092043415098 | 0.820453978292451 |
| 29 | 0.91001678124518 | 0.17996643750964 | 0.0899832187548201 |
| 30 | 0.902462082116753 | 0.195075835766494 | 0.097537917883247 |
| 31 | 0.83783888526249 | 0.32432222947502 | 0.16216111473751 |
| 32 | 0.780429270436688 | 0.439141459126624 | 0.219570729563312 |
| Meta Analysis of Goldfeld-Quandt test for Heteroskedasticity | |||
| Description | # significant tests | % significant tests | OK/NOK |
| 1% type I error level | 20 | 0.8 | NOK |
| 5% type I error level | 20 | 0.8 | NOK |
| 10% type I error level | 20 | 0.8 | NOK |