Free Statistics

of Irreproducible Research!

Author's title

Author*The author of this computation has been verified*
R Software Modulerwasp_multipleregression.wasp
Title produced by softwareMultiple Regression
Date of computationMon, 21 Nov 2011 17:18:29 -0500
Cite this page as followsStatistical Computations at FreeStatistics.org, Office for Research Development and Education, URL https://freestatistics.org/blog/index.php?v=date/2011/Nov/21/t1321914002iizi0c4jyq8utg5.htm/, Retrieved Thu, 25 Apr 2024 03:58:08 +0000
Statistical Computations at FreeStatistics.org, Office for Research Development and Education, URL https://freestatistics.org/blog/index.php?pk=146010, Retrieved Thu, 25 Apr 2024 03:58:08 +0000
QR Codes:

Original text written by user:
IsPrivate?No (this computation is public)
User-defined keywords
Estimated Impact81
Family? (F = Feedback message, R = changed R code, M = changed R Module, P = changed Parameters, D = changed Data)
-     [Multiple Regression] [Decreasing Compet...] [2010-11-17 09:04:39] [b98453cac15ba1066b407e146608df68]
- R  D    [Multiple Regression] [] [2011-11-21 22:18:29] [2be7aedefc35278abdba659ba29c8de8] [Current]
Feedback Forum

Post a new message
Dataseries X:
1962	9,5	5,569	1,933	0,226
1963	9,6	5,634	1,947	0,231
1964	9,4	5,433	1,936	0,225
1965	9,4	5,425	1,956	0,229
1966	9,5	5,412	1,965	0,236
1967	9,4	5,247	1,973	0,234
1968	9,7	5,31	1,988	0,253
1969	9,5	5,168	1,985	0,251
1970	9,5	4,927	1,986	0,243
1971	9,3	4,929	1,993	0,239
1972	9,4	4,902	2,003	0,237
1973	9,3	4,82	2	0,23
1974	9,1	4,588	2,015	0,221
1975	8,8	4,312	2,001	0,203
1976	8,8	4,269	2,025	0,195
1977	8,6	4,137	2,035	0,182
1978	8,7	4,099	2,049	0,183
1979	8,5	4,016	2,04	0,175
1980	8,7	4,121	2,079	0,181
1981	8,6	3,97	2,064	0,176
1982	8,5	3,89	2,083	0,172
1983	8,6	3,889	2,091	0,176
1984	8,6	3,788	2,108	0,172
1985	8,7	3,75	2,113	0,174
1986	8,7	3,651	2,115	0,172
1987	8,7	3,559	2,117	0,174
1988	8,8	3,525	2,125	0,18
1989	8,7	3,32	2,142	0,205
1990	8,6	3,218	2,16	0,207
1991	8,5	3,138	2,158	0,207
1992	8,5	3,061	2,143	0,208
1993	8,8	3,099	2,146	0,22
1994	8,8	2,997	2,131	0,227
1995	8,8	2,963	2,117	0,234
1996	8,8	2,883	2,087	0,24
1997	8,6	2,804	2,057	0,24
1998	8,6	2,724	2,024	0,242
1999	8,8	2,678	2,027	0,252
2000	8,7	2,576	1,996	0,25
2001	8,5	2,478	1,96	0,253


Summary of computational transaction
Raw Inputview raw input (R code)
Raw Outputview raw output of R engine
Computing time3 seconds
R Server'Gwilym Jenkins' @ jenkins.wessa.net
R Framework error message
The field 'Names of X columns' contains a hard return which cannot be interpreted.
Please, resubmit your request without hard returns in the 'Names of X columns'.

\begin{tabular}{lllllllll}
\hline
Summary of computational transaction \tabularnewline
Raw Input & view raw input (R code)  \tabularnewline
Raw Output & view raw output of R engine  \tabularnewline
Computing time & 3 seconds \tabularnewline
R Server & 'Gwilym Jenkins' @ jenkins.wessa.net \tabularnewline
R Framework error message & 
The field 'Names of X columns' contains a hard return which cannot be interpreted.
Please, resubmit your request without hard returns in the 'Names of X columns'.
\tabularnewline \hline \end{tabular} %Source: https://freestatistics.org/blog/index.php?pk=146010&T=0

[TABLE]
[ROW][C]Summary of computational transaction[/C][/ROW]
[ROW][C]Raw Input[/C][C]view raw input (R code) [/C][/ROW]
[ROW][C]Raw Output[/C][C]view raw output of R engine [/C][/ROW]
[ROW][C]Computing time[/C][C]3 seconds[/C][/ROW]
[ROW][C]R Server[/C][C]'Gwilym Jenkins' @ jenkins.wessa.net[/C][/ROW]
[ROW][C]R Framework error message[/C][C]
The field 'Names of X columns' contains a hard return which cannot be interpreted.
Please, resubmit your request without hard returns in the 'Names of X columns'.
[/C][/ROW] [/TABLE] Source: https://freestatistics.org/blog/index.php?pk=146010&T=0

Globally Unique Identifier (entire table): ba.freestatistics.org/blog/index.php?pk=146010&T=0

As an alternative you can also use a QR Code:  

The GUIDs for individual cells are displayed in the table below:

Summary of computational transaction
Raw Inputview raw input (R code)
Raw Outputview raw output of R engine
Computing time3 seconds
R Server'Gwilym Jenkins' @ jenkins.wessa.net
R Framework error message
The field 'Names of X columns' contains a hard return which cannot be interpreted.
Please, resubmit your request without hard returns in the 'Names of X columns'.


Multiple Linear Regression - Estimated Regression Equation
Cancer[t] = + 9.85008549642589 -0.00433295121643938Year[t] + 0.220653055238072Rate[t] -0.165991233759688Heart_disease[t] -2.42906802854214`Diabetes `[t] + e[t]

\begin{tabular}{lllllllll}
\hline
Multiple Linear Regression - Estimated Regression Equation \tabularnewline
Cancer[t] =  +  9.85008549642589 -0.00433295121643938Year[t] +  0.220653055238072Rate[t] -0.165991233759688Heart_disease[t] -2.42906802854214`Diabetes
`[t]  + e[t] \tabularnewline
\hline
\end{tabular}
%Source: https://freestatistics.org/blog/index.php?pk=146010&T=1

[TABLE]
[ROW][C]Multiple Linear Regression - Estimated Regression Equation[/C][/ROW]
[ROW][C]Cancer[t] =  +  9.85008549642589 -0.00433295121643938Year[t] +  0.220653055238072Rate[t] -0.165991233759688Heart_disease[t] -2.42906802854214`Diabetes
`[t]  + e[t][/C][/ROW]
[/TABLE]
Source: https://freestatistics.org/blog/index.php?pk=146010&T=1

Globally Unique Identifier (entire table): ba.freestatistics.org/blog/index.php?pk=146010&T=1

As an alternative you can also use a QR Code:  

The GUIDs for individual cells are displayed in the table below:

Multiple Linear Regression - Estimated Regression Equation
Cancer[t] = + 9.85008549642589 -0.00433295121643938Year[t] + 0.220653055238072Rate[t] -0.165991233759688Heart_disease[t] -2.42906802854214`Diabetes `[t] + e[t]


Multiple Linear Regression - Ordinary Least Squares
VariableParameterS.D.T-STATH0: parameter = 02-tail p-value1-tail p-value
(Intercept)9.8500854964258914.351660.68630.4970220.248511
Year-0.004332951216439380.00722-0.60010.5522840.276142
Rate0.2206530552380720.0707463.11890.0036220.001811
Heart_disease-0.1659912337596880.102635-1.61730.1147940.057397
`Diabetes `-2.429068028542140.421367-5.76472e-061e-06

\begin{tabular}{lllllllll}
\hline
Multiple Linear Regression - Ordinary Least Squares \tabularnewline
Variable & Parameter & S.D. & T-STATH0: parameter = 0 & 2-tail p-value & 1-tail p-value \tabularnewline
(Intercept) & 9.85008549642589 & 14.35166 & 0.6863 & 0.497022 & 0.248511 \tabularnewline
Year & -0.00433295121643938 & 0.00722 & -0.6001 & 0.552284 & 0.276142 \tabularnewline
Rate & 0.220653055238072 & 0.070746 & 3.1189 & 0.003622 & 0.001811 \tabularnewline
Heart_disease & -0.165991233759688 & 0.102635 & -1.6173 & 0.114794 & 0.057397 \tabularnewline
`Diabetes
` & -2.42906802854214 & 0.421367 & -5.7647 & 2e-06 & 1e-06 \tabularnewline
\hline
\end{tabular}
%Source: https://freestatistics.org/blog/index.php?pk=146010&T=2

[TABLE]
[ROW][C]Multiple Linear Regression - Ordinary Least Squares[/C][/ROW]
[ROW][C]Variable[/C][C]Parameter[/C][C]S.D.[/C][C]T-STATH0: parameter = 0[/C][C]2-tail p-value[/C][C]1-tail p-value[/C][/ROW]
[ROW][C](Intercept)[/C][C]9.85008549642589[/C][C]14.35166[/C][C]0.6863[/C][C]0.497022[/C][C]0.248511[/C][/ROW]
[ROW][C]Year[/C][C]-0.00433295121643938[/C][C]0.00722[/C][C]-0.6001[/C][C]0.552284[/C][C]0.276142[/C][/ROW]
[ROW][C]Rate[/C][C]0.220653055238072[/C][C]0.070746[/C][C]3.1189[/C][C]0.003622[/C][C]0.001811[/C][/ROW]
[ROW][C]Heart_disease[/C][C]-0.165991233759688[/C][C]0.102635[/C][C]-1.6173[/C][C]0.114794[/C][C]0.057397[/C][/ROW]
[ROW][C]`Diabetes
`[/C][C]-2.42906802854214[/C][C]0.421367[/C][C]-5.7647[/C][C]2e-06[/C][C]1e-06[/C][/ROW]
[/TABLE]
Source: https://freestatistics.org/blog/index.php?pk=146010&T=2

Globally Unique Identifier (entire table): ba.freestatistics.org/blog/index.php?pk=146010&T=2

As an alternative you can also use a QR Code:  

The GUIDs for individual cells are displayed in the table below:

Multiple Linear Regression - Ordinary Least Squares
VariableParameterS.D.T-STATH0: parameter = 02-tail p-value1-tail p-value
(Intercept)9.8500854964258914.351660.68630.4970220.248511
Year-0.004332951216439380.00722-0.60010.5522840.276142
Rate0.2206530552380720.0707463.11890.0036220.001811
Heart_disease-0.1659912337596880.102635-1.61730.1147940.057397
`Diabetes `-2.429068028542140.421367-5.76472e-061e-06


Multiple Linear Regression - Regression Statistics
Multiple R0.867336184417206
R-squared0.752272056799398
Adjusted R-squared0.723960291862186
F-TEST (value)26.5710053212065
F-TEST (DF numerator)4
F-TEST (DF denominator)35
p-value3.51375706308943e-10
Multiple Linear Regression - Residual Statistics
Residual Standard Deviation0.036072444883317
Sum Squared Residuals0.0455427447950979

\begin{tabular}{lllllllll}
\hline
Multiple Linear Regression - Regression Statistics \tabularnewline
Multiple R & 0.867336184417206 \tabularnewline
R-squared & 0.752272056799398 \tabularnewline
Adjusted R-squared & 0.723960291862186 \tabularnewline
F-TEST (value) & 26.5710053212065 \tabularnewline
F-TEST (DF numerator) & 4 \tabularnewline
F-TEST (DF denominator) & 35 \tabularnewline
p-value & 3.51375706308943e-10 \tabularnewline
Multiple Linear Regression - Residual Statistics \tabularnewline
Residual Standard Deviation & 0.036072444883317 \tabularnewline
Sum Squared Residuals & 0.0455427447950979 \tabularnewline
\hline
\end{tabular}
%Source: https://freestatistics.org/blog/index.php?pk=146010&T=3

[TABLE]
[ROW][C]Multiple Linear Regression - Regression Statistics[/C][/ROW]
[ROW][C]Multiple R[/C][C]0.867336184417206[/C][/ROW]
[ROW][C]R-squared[/C][C]0.752272056799398[/C][/ROW]
[ROW][C]Adjusted R-squared[/C][C]0.723960291862186[/C][/ROW]
[ROW][C]F-TEST (value)[/C][C]26.5710053212065[/C][/ROW]
[ROW][C]F-TEST (DF numerator)[/C][C]4[/C][/ROW]
[ROW][C]F-TEST (DF denominator)[/C][C]35[/C][/ROW]
[ROW][C]p-value[/C][C]3.51375706308943e-10[/C][/ROW]
[ROW][C]Multiple Linear Regression - Residual Statistics[/C][/ROW]
[ROW][C]Residual Standard Deviation[/C][C]0.036072444883317[/C][/ROW]
[ROW][C]Sum Squared Residuals[/C][C]0.0455427447950979[/C][/ROW]
[/TABLE]
Source: https://freestatistics.org/blog/index.php?pk=146010&T=3

Globally Unique Identifier (entire table): ba.freestatistics.org/blog/index.php?pk=146010&T=3

As an alternative you can also use a QR Code:  

The GUIDs for individual cells are displayed in the table below:

Multiple Linear Regression - Regression Statistics
Multiple R0.867336184417206
R-squared0.752272056799398
Adjusted R-squared0.723960291862186
F-TEST (value)26.5710053212065
F-TEST (DF numerator)4
F-TEST (DF denominator)35
p-value3.51375706308943e-10
Multiple Linear Regression - Residual Statistics
Residual Standard Deviation0.036072444883317
Sum Squared Residuals0.0455427447950979


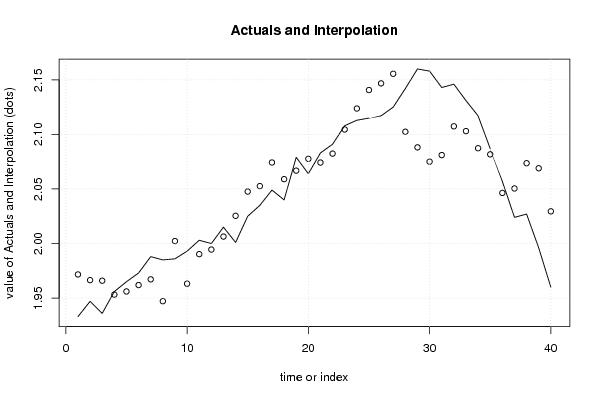
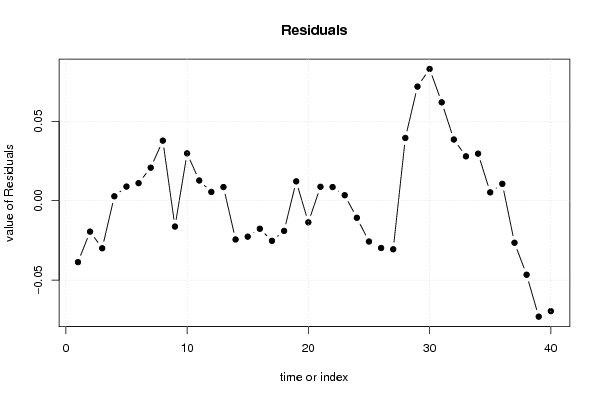
Multiple Linear Regression - Actuals, Interpolation, and Residuals
Time or IndexActualsInterpolationForecastResidualsPrediction Error
11.9331.97166467927529-0.0386646792752893
21.9471.96646226324557-0.0194622632455667
31.9361.96593734713846-0.0299373471384635
41.9561.953216053677930.00278394632206691
51.9651.956102817824380.00889718217561827
61.9731.961951250711570.011048749288432
71.9881.967204475797390.0207955242026108
81.9851.94716980478430.0378301952157046
91.9862.00227328513228-0.0162732851322782
101.9931.963194012514870.0298059874851265
112.0031.990266266190840.0127337338091629
1221.994482766818680.00551723318131994
132.0152.006390783043750.00860921695624715
142.0012.02539872028732-0.0243987202873247
152.0252.04763593635089-0.022635936350889
162.0352.05266110131416-0.0176611013141615
172.0492.07427205447586-0.0252720544758554
182.042.05901830884219-0.0190183088421929
192.0792.066812480957350.0121875190426526
202.0642.07762424065752-0.0136242406575247
212.0832.074221554732220.00877844526777828
222.0912.082403628159180.00859637184081935
232.1082.104552063666640.00344793633336154
242.1132.12373394879979-0.0107339487997902
252.1152.14069226578264-0.025692265782644
262.1172.14677237201501-0.0297723720150118
272.1252.15557402009896-0.0305740200989566
282.1422.102477265565890.0395227344341075
292.162.088151978612050.0718480213879503
302.1582.075033020572580.0829669794274215
312.1432.081052326327090.0619476736729069
322.1462.10745880845670.0385411915432985
332.1312.103053486883960.0279465131160444
342.1172.087360761415550.0296392385844496
352.0872.081732700728630.00526729927136689
362.0572.046382445931590.0106175540684053
372.0242.05047065735885-0.026470657358846
382.0272.07361323365755-0.0466132336575455
391.9962.06900421881787-0.0730042188178712
401.962.02952059337664-0.0695205933766406

\begin{tabular}{lllllllll}
\hline
Multiple Linear Regression - Actuals, Interpolation, and Residuals \tabularnewline
Time or Index & Actuals & InterpolationForecast & ResidualsPrediction Error \tabularnewline
1 & 1.933 & 1.97166467927529 & -0.0386646792752893 \tabularnewline
2 & 1.947 & 1.96646226324557 & -0.0194622632455667 \tabularnewline
3 & 1.936 & 1.96593734713846 & -0.0299373471384635 \tabularnewline
4 & 1.956 & 1.95321605367793 & 0.00278394632206691 \tabularnewline
5 & 1.965 & 1.95610281782438 & 0.00889718217561827 \tabularnewline
6 & 1.973 & 1.96195125071157 & 0.011048749288432 \tabularnewline
7 & 1.988 & 1.96720447579739 & 0.0207955242026108 \tabularnewline
8 & 1.985 & 1.9471698047843 & 0.0378301952157046 \tabularnewline
9 & 1.986 & 2.00227328513228 & -0.0162732851322782 \tabularnewline
10 & 1.993 & 1.96319401251487 & 0.0298059874851265 \tabularnewline
11 & 2.003 & 1.99026626619084 & 0.0127337338091629 \tabularnewline
12 & 2 & 1.99448276681868 & 0.00551723318131994 \tabularnewline
13 & 2.015 & 2.00639078304375 & 0.00860921695624715 \tabularnewline
14 & 2.001 & 2.02539872028732 & -0.0243987202873247 \tabularnewline
15 & 2.025 & 2.04763593635089 & -0.022635936350889 \tabularnewline
16 & 2.035 & 2.05266110131416 & -0.0176611013141615 \tabularnewline
17 & 2.049 & 2.07427205447586 & -0.0252720544758554 \tabularnewline
18 & 2.04 & 2.05901830884219 & -0.0190183088421929 \tabularnewline
19 & 2.079 & 2.06681248095735 & 0.0121875190426526 \tabularnewline
20 & 2.064 & 2.07762424065752 & -0.0136242406575247 \tabularnewline
21 & 2.083 & 2.07422155473222 & 0.00877844526777828 \tabularnewline
22 & 2.091 & 2.08240362815918 & 0.00859637184081935 \tabularnewline
23 & 2.108 & 2.10455206366664 & 0.00344793633336154 \tabularnewline
24 & 2.113 & 2.12373394879979 & -0.0107339487997902 \tabularnewline
25 & 2.115 & 2.14069226578264 & -0.025692265782644 \tabularnewline
26 & 2.117 & 2.14677237201501 & -0.0297723720150118 \tabularnewline
27 & 2.125 & 2.15557402009896 & -0.0305740200989566 \tabularnewline
28 & 2.142 & 2.10247726556589 & 0.0395227344341075 \tabularnewline
29 & 2.16 & 2.08815197861205 & 0.0718480213879503 \tabularnewline
30 & 2.158 & 2.07503302057258 & 0.0829669794274215 \tabularnewline
31 & 2.143 & 2.08105232632709 & 0.0619476736729069 \tabularnewline
32 & 2.146 & 2.1074588084567 & 0.0385411915432985 \tabularnewline
33 & 2.131 & 2.10305348688396 & 0.0279465131160444 \tabularnewline
34 & 2.117 & 2.08736076141555 & 0.0296392385844496 \tabularnewline
35 & 2.087 & 2.08173270072863 & 0.00526729927136689 \tabularnewline
36 & 2.057 & 2.04638244593159 & 0.0106175540684053 \tabularnewline
37 & 2.024 & 2.05047065735885 & -0.026470657358846 \tabularnewline
38 & 2.027 & 2.07361323365755 & -0.0466132336575455 \tabularnewline
39 & 1.996 & 2.06900421881787 & -0.0730042188178712 \tabularnewline
40 & 1.96 & 2.02952059337664 & -0.0695205933766406 \tabularnewline
\hline
\end{tabular}
%Source: https://freestatistics.org/blog/index.php?pk=146010&T=4

[TABLE]
[ROW][C]Multiple Linear Regression - Actuals, Interpolation, and Residuals[/C][/ROW]
[ROW][C]Time or Index[/C][C]Actuals[/C][C]InterpolationForecast[/C][C]ResidualsPrediction Error[/C][/ROW]
[ROW][C]1[/C][C]1.933[/C][C]1.97166467927529[/C][C]-0.0386646792752893[/C][/ROW]
[ROW][C]2[/C][C]1.947[/C][C]1.96646226324557[/C][C]-0.0194622632455667[/C][/ROW]
[ROW][C]3[/C][C]1.936[/C][C]1.96593734713846[/C][C]-0.0299373471384635[/C][/ROW]
[ROW][C]4[/C][C]1.956[/C][C]1.95321605367793[/C][C]0.00278394632206691[/C][/ROW]
[ROW][C]5[/C][C]1.965[/C][C]1.95610281782438[/C][C]0.00889718217561827[/C][/ROW]
[ROW][C]6[/C][C]1.973[/C][C]1.96195125071157[/C][C]0.011048749288432[/C][/ROW]
[ROW][C]7[/C][C]1.988[/C][C]1.96720447579739[/C][C]0.0207955242026108[/C][/ROW]
[ROW][C]8[/C][C]1.985[/C][C]1.9471698047843[/C][C]0.0378301952157046[/C][/ROW]
[ROW][C]9[/C][C]1.986[/C][C]2.00227328513228[/C][C]-0.0162732851322782[/C][/ROW]
[ROW][C]10[/C][C]1.993[/C][C]1.96319401251487[/C][C]0.0298059874851265[/C][/ROW]
[ROW][C]11[/C][C]2.003[/C][C]1.99026626619084[/C][C]0.0127337338091629[/C][/ROW]
[ROW][C]12[/C][C]2[/C][C]1.99448276681868[/C][C]0.00551723318131994[/C][/ROW]
[ROW][C]13[/C][C]2.015[/C][C]2.00639078304375[/C][C]0.00860921695624715[/C][/ROW]
[ROW][C]14[/C][C]2.001[/C][C]2.02539872028732[/C][C]-0.0243987202873247[/C][/ROW]
[ROW][C]15[/C][C]2.025[/C][C]2.04763593635089[/C][C]-0.022635936350889[/C][/ROW]
[ROW][C]16[/C][C]2.035[/C][C]2.05266110131416[/C][C]-0.0176611013141615[/C][/ROW]
[ROW][C]17[/C][C]2.049[/C][C]2.07427205447586[/C][C]-0.0252720544758554[/C][/ROW]
[ROW][C]18[/C][C]2.04[/C][C]2.05901830884219[/C][C]-0.0190183088421929[/C][/ROW]
[ROW][C]19[/C][C]2.079[/C][C]2.06681248095735[/C][C]0.0121875190426526[/C][/ROW]
[ROW][C]20[/C][C]2.064[/C][C]2.07762424065752[/C][C]-0.0136242406575247[/C][/ROW]
[ROW][C]21[/C][C]2.083[/C][C]2.07422155473222[/C][C]0.00877844526777828[/C][/ROW]
[ROW][C]22[/C][C]2.091[/C][C]2.08240362815918[/C][C]0.00859637184081935[/C][/ROW]
[ROW][C]23[/C][C]2.108[/C][C]2.10455206366664[/C][C]0.00344793633336154[/C][/ROW]
[ROW][C]24[/C][C]2.113[/C][C]2.12373394879979[/C][C]-0.0107339487997902[/C][/ROW]
[ROW][C]25[/C][C]2.115[/C][C]2.14069226578264[/C][C]-0.025692265782644[/C][/ROW]
[ROW][C]26[/C][C]2.117[/C][C]2.14677237201501[/C][C]-0.0297723720150118[/C][/ROW]
[ROW][C]27[/C][C]2.125[/C][C]2.15557402009896[/C][C]-0.0305740200989566[/C][/ROW]
[ROW][C]28[/C][C]2.142[/C][C]2.10247726556589[/C][C]0.0395227344341075[/C][/ROW]
[ROW][C]29[/C][C]2.16[/C][C]2.08815197861205[/C][C]0.0718480213879503[/C][/ROW]
[ROW][C]30[/C][C]2.158[/C][C]2.07503302057258[/C][C]0.0829669794274215[/C][/ROW]
[ROW][C]31[/C][C]2.143[/C][C]2.08105232632709[/C][C]0.0619476736729069[/C][/ROW]
[ROW][C]32[/C][C]2.146[/C][C]2.1074588084567[/C][C]0.0385411915432985[/C][/ROW]
[ROW][C]33[/C][C]2.131[/C][C]2.10305348688396[/C][C]0.0279465131160444[/C][/ROW]
[ROW][C]34[/C][C]2.117[/C][C]2.08736076141555[/C][C]0.0296392385844496[/C][/ROW]
[ROW][C]35[/C][C]2.087[/C][C]2.08173270072863[/C][C]0.00526729927136689[/C][/ROW]
[ROW][C]36[/C][C]2.057[/C][C]2.04638244593159[/C][C]0.0106175540684053[/C][/ROW]
[ROW][C]37[/C][C]2.024[/C][C]2.05047065735885[/C][C]-0.026470657358846[/C][/ROW]
[ROW][C]38[/C][C]2.027[/C][C]2.07361323365755[/C][C]-0.0466132336575455[/C][/ROW]
[ROW][C]39[/C][C]1.996[/C][C]2.06900421881787[/C][C]-0.0730042188178712[/C][/ROW]
[ROW][C]40[/C][C]1.96[/C][C]2.02952059337664[/C][C]-0.0695205933766406[/C][/ROW]
[/TABLE]
Source: https://freestatistics.org/blog/index.php?pk=146010&T=4

Globally Unique Identifier (entire table): ba.freestatistics.org/blog/index.php?pk=146010&T=4

As an alternative you can also use a QR Code:  

The GUIDs for individual cells are displayed in the table below:

Multiple Linear Regression - Actuals, Interpolation, and Residuals
Time or IndexActualsInterpolationForecastResidualsPrediction Error
11.9331.97166467927529-0.0386646792752893
21.9471.96646226324557-0.0194622632455667
31.9361.96593734713846-0.0299373471384635
41.9561.953216053677930.00278394632206691
51.9651.956102817824380.00889718217561827
61.9731.961951250711570.011048749288432
71.9881.967204475797390.0207955242026108
81.9851.94716980478430.0378301952157046
91.9862.00227328513228-0.0162732851322782
101.9931.963194012514870.0298059874851265
112.0031.990266266190840.0127337338091629
1221.994482766818680.00551723318131994
132.0152.006390783043750.00860921695624715
142.0012.02539872028732-0.0243987202873247
152.0252.04763593635089-0.022635936350889
162.0352.05266110131416-0.0176611013141615
172.0492.07427205447586-0.0252720544758554
182.042.05901830884219-0.0190183088421929
192.0792.066812480957350.0121875190426526
202.0642.07762424065752-0.0136242406575247
212.0832.074221554732220.00877844526777828
222.0912.082403628159180.00859637184081935
232.1082.104552063666640.00344793633336154
242.1132.12373394879979-0.0107339487997902
252.1152.14069226578264-0.025692265782644
262.1172.14677237201501-0.0297723720150118
272.1252.15557402009896-0.0305740200989566
282.1422.102477265565890.0395227344341075
292.162.088151978612050.0718480213879503
302.1582.075033020572580.0829669794274215
312.1432.081052326327090.0619476736729069
322.1462.10745880845670.0385411915432985
332.1312.103053486883960.0279465131160444
342.1172.087360761415550.0296392385844496
352.0872.081732700728630.00526729927136689
362.0572.046382445931590.0106175540684053
372.0242.05047065735885-0.026470657358846
382.0272.07361323365755-0.0466132336575455
391.9962.06900421881787-0.0730042188178712
401.962.02952059337664-0.0695205933766406


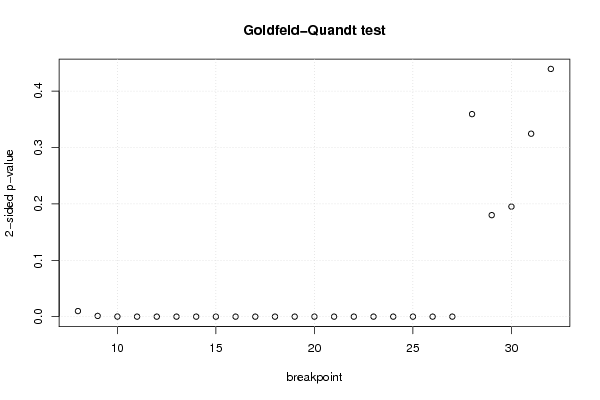
Goldfeld-Quandt test for Heteroskedasticity
p-valuesAlternative Hypothesis
breakpoint indexgreater2-sidedless
80.004967267341229710.009934534682459420.99503273265877
90.000660535595290420.001321071190580840.99933946440471
107.74934960952028e-050.0001549869921904060.999922506503905
118.64199139028549e-061.7283982780571e-050.99999135800861
121.89556011672931e-063.79112023345861e-060.999998104439883
134.63894129019207e-069.27788258038414e-060.99999536105871
146.41816373439772e-071.28363274687954e-060.999999358183627
155.85674965702096e-071.17134993140419e-060.999999414325034
164.87535089475572e-079.75070178951145e-070.99999951246491
174.72563893074171e-079.45127786148342e-070.999999527436107
182.62230615389973e-065.24461230779945e-060.999997377693846
191.43242571917353e-062.86485143834705e-060.999998567574281
207.73120970047312e-061.54624194009462e-050.9999922687903
211.11922374919484e-052.23844749838967e-050.999988807762508
224.01678828638499e-068.03357657276999e-060.999995983211714
232.06745942926022e-064.13491885852044e-060.999997932540571
249.45188711829552e-071.8903774236591e-060.999999054811288
257.81883800976076e-071.56376760195215e-060.999999218116199
267.5239529748978e-071.50479059497956e-060.999999247604702
271.47963762821483e-052.95927525642966e-050.999985203623718
280.1795460217075490.3590920434150980.820453978292451
290.910016781245180.179966437509640.0899832187548201
300.9024620821167530.1950758357664940.097537917883247
310.837838885262490.324322229475020.16216111473751
320.7804292704366880.4391414591266240.219570729563312

\begin{tabular}{lllllllll}
\hline
Goldfeld-Quandt test for Heteroskedasticity \tabularnewline
p-values & Alternative Hypothesis \tabularnewline
breakpoint index & greater & 2-sided & less \tabularnewline
8 & 0.00496726734122971 & 0.00993453468245942 & 0.99503273265877 \tabularnewline
9 & 0.00066053559529042 & 0.00132107119058084 & 0.99933946440471 \tabularnewline
10 & 7.74934960952028e-05 & 0.000154986992190406 & 0.999922506503905 \tabularnewline
11 & 8.64199139028549e-06 & 1.7283982780571e-05 & 0.99999135800861 \tabularnewline
12 & 1.89556011672931e-06 & 3.79112023345861e-06 & 0.999998104439883 \tabularnewline
13 & 4.63894129019207e-06 & 9.27788258038414e-06 & 0.99999536105871 \tabularnewline
14 & 6.41816373439772e-07 & 1.28363274687954e-06 & 0.999999358183627 \tabularnewline
15 & 5.85674965702096e-07 & 1.17134993140419e-06 & 0.999999414325034 \tabularnewline
16 & 4.87535089475572e-07 & 9.75070178951145e-07 & 0.99999951246491 \tabularnewline
17 & 4.72563893074171e-07 & 9.45127786148342e-07 & 0.999999527436107 \tabularnewline
18 & 2.62230615389973e-06 & 5.24461230779945e-06 & 0.999997377693846 \tabularnewline
19 & 1.43242571917353e-06 & 2.86485143834705e-06 & 0.999998567574281 \tabularnewline
20 & 7.73120970047312e-06 & 1.54624194009462e-05 & 0.9999922687903 \tabularnewline
21 & 1.11922374919484e-05 & 2.23844749838967e-05 & 0.999988807762508 \tabularnewline
22 & 4.01678828638499e-06 & 8.03357657276999e-06 & 0.999995983211714 \tabularnewline
23 & 2.06745942926022e-06 & 4.13491885852044e-06 & 0.999997932540571 \tabularnewline
24 & 9.45188711829552e-07 & 1.8903774236591e-06 & 0.999999054811288 \tabularnewline
25 & 7.81883800976076e-07 & 1.56376760195215e-06 & 0.999999218116199 \tabularnewline
26 & 7.5239529748978e-07 & 1.50479059497956e-06 & 0.999999247604702 \tabularnewline
27 & 1.47963762821483e-05 & 2.95927525642966e-05 & 0.999985203623718 \tabularnewline
28 & 0.179546021707549 & 0.359092043415098 & 0.820453978292451 \tabularnewline
29 & 0.91001678124518 & 0.17996643750964 & 0.0899832187548201 \tabularnewline
30 & 0.902462082116753 & 0.195075835766494 & 0.097537917883247 \tabularnewline
31 & 0.83783888526249 & 0.32432222947502 & 0.16216111473751 \tabularnewline
32 & 0.780429270436688 & 0.439141459126624 & 0.219570729563312 \tabularnewline
\hline
\end{tabular}
%Source: https://freestatistics.org/blog/index.php?pk=146010&T=5

[TABLE]
[ROW][C]Goldfeld-Quandt test for Heteroskedasticity[/C][/ROW]
[ROW][C]p-values[/C][C]Alternative Hypothesis[/C][/ROW]
[ROW][C]breakpoint index[/C][C]greater[/C][C]2-sided[/C][C]less[/C][/ROW]
[ROW][C]8[/C][C]0.00496726734122971[/C][C]0.00993453468245942[/C][C]0.99503273265877[/C][/ROW]
[ROW][C]9[/C][C]0.00066053559529042[/C][C]0.00132107119058084[/C][C]0.99933946440471[/C][/ROW]
[ROW][C]10[/C][C]7.74934960952028e-05[/C][C]0.000154986992190406[/C][C]0.999922506503905[/C][/ROW]
[ROW][C]11[/C][C]8.64199139028549e-06[/C][C]1.7283982780571e-05[/C][C]0.99999135800861[/C][/ROW]
[ROW][C]12[/C][C]1.89556011672931e-06[/C][C]3.79112023345861e-06[/C][C]0.999998104439883[/C][/ROW]
[ROW][C]13[/C][C]4.63894129019207e-06[/C][C]9.27788258038414e-06[/C][C]0.99999536105871[/C][/ROW]
[ROW][C]14[/C][C]6.41816373439772e-07[/C][C]1.28363274687954e-06[/C][C]0.999999358183627[/C][/ROW]
[ROW][C]15[/C][C]5.85674965702096e-07[/C][C]1.17134993140419e-06[/C][C]0.999999414325034[/C][/ROW]
[ROW][C]16[/C][C]4.87535089475572e-07[/C][C]9.75070178951145e-07[/C][C]0.99999951246491[/C][/ROW]
[ROW][C]17[/C][C]4.72563893074171e-07[/C][C]9.45127786148342e-07[/C][C]0.999999527436107[/C][/ROW]
[ROW][C]18[/C][C]2.62230615389973e-06[/C][C]5.24461230779945e-06[/C][C]0.999997377693846[/C][/ROW]
[ROW][C]19[/C][C]1.43242571917353e-06[/C][C]2.86485143834705e-06[/C][C]0.999998567574281[/C][/ROW]
[ROW][C]20[/C][C]7.73120970047312e-06[/C][C]1.54624194009462e-05[/C][C]0.9999922687903[/C][/ROW]
[ROW][C]21[/C][C]1.11922374919484e-05[/C][C]2.23844749838967e-05[/C][C]0.999988807762508[/C][/ROW]
[ROW][C]22[/C][C]4.01678828638499e-06[/C][C]8.03357657276999e-06[/C][C]0.999995983211714[/C][/ROW]
[ROW][C]23[/C][C]2.06745942926022e-06[/C][C]4.13491885852044e-06[/C][C]0.999997932540571[/C][/ROW]
[ROW][C]24[/C][C]9.45188711829552e-07[/C][C]1.8903774236591e-06[/C][C]0.999999054811288[/C][/ROW]
[ROW][C]25[/C][C]7.81883800976076e-07[/C][C]1.56376760195215e-06[/C][C]0.999999218116199[/C][/ROW]
[ROW][C]26[/C][C]7.5239529748978e-07[/C][C]1.50479059497956e-06[/C][C]0.999999247604702[/C][/ROW]
[ROW][C]27[/C][C]1.47963762821483e-05[/C][C]2.95927525642966e-05[/C][C]0.999985203623718[/C][/ROW]
[ROW][C]28[/C][C]0.179546021707549[/C][C]0.359092043415098[/C][C]0.820453978292451[/C][/ROW]
[ROW][C]29[/C][C]0.91001678124518[/C][C]0.17996643750964[/C][C]0.0899832187548201[/C][/ROW]
[ROW][C]30[/C][C]0.902462082116753[/C][C]0.195075835766494[/C][C]0.097537917883247[/C][/ROW]
[ROW][C]31[/C][C]0.83783888526249[/C][C]0.32432222947502[/C][C]0.16216111473751[/C][/ROW]
[ROW][C]32[/C][C]0.780429270436688[/C][C]0.439141459126624[/C][C]0.219570729563312[/C][/ROW]
[/TABLE]
Source: https://freestatistics.org/blog/index.php?pk=146010&T=5

Globally Unique Identifier (entire table): ba.freestatistics.org/blog/index.php?pk=146010&T=5

As an alternative you can also use a QR Code:  

The GUIDs for individual cells are displayed in the table below:

Goldfeld-Quandt test for Heteroskedasticity
p-valuesAlternative Hypothesis
breakpoint indexgreater2-sidedless
80.004967267341229710.009934534682459420.99503273265877
90.000660535595290420.001321071190580840.99933946440471
107.74934960952028e-050.0001549869921904060.999922506503905
118.64199139028549e-061.7283982780571e-050.99999135800861
121.89556011672931e-063.79112023345861e-060.999998104439883
134.63894129019207e-069.27788258038414e-060.99999536105871
146.41816373439772e-071.28363274687954e-060.999999358183627
155.85674965702096e-071.17134993140419e-060.999999414325034
164.87535089475572e-079.75070178951145e-070.99999951246491
174.72563893074171e-079.45127786148342e-070.999999527436107
182.62230615389973e-065.24461230779945e-060.999997377693846
191.43242571917353e-062.86485143834705e-060.999998567574281
207.73120970047312e-061.54624194009462e-050.9999922687903
211.11922374919484e-052.23844749838967e-050.999988807762508
224.01678828638499e-068.03357657276999e-060.999995983211714
232.06745942926022e-064.13491885852044e-060.999997932540571
249.45188711829552e-071.8903774236591e-060.999999054811288
257.81883800976076e-071.56376760195215e-060.999999218116199
267.5239529748978e-071.50479059497956e-060.999999247604702
271.47963762821483e-052.95927525642966e-050.999985203623718
280.1795460217075490.3590920434150980.820453978292451
290.910016781245180.179966437509640.0899832187548201
300.9024620821167530.1950758357664940.097537917883247
310.837838885262490.324322229475020.16216111473751
320.7804292704366880.4391414591266240.219570729563312


Meta Analysis of Goldfeld-Quandt test for Heteroskedasticity
Description# significant tests% significant testsOK/NOK
1% type I error level200.8NOK
5% type I error level200.8NOK
10% type I error level200.8NOK

\begin{tabular}{lllllllll}
\hline
Meta Analysis of Goldfeld-Quandt test for Heteroskedasticity \tabularnewline
Description & # significant tests & % significant tests & OK/NOK \tabularnewline
1% type I error level & 20 & 0.8 & NOK \tabularnewline
5% type I error level & 20 & 0.8 & NOK \tabularnewline
10% type I error level & 20 & 0.8 & NOK \tabularnewline
\hline
\end{tabular}
%Source: https://freestatistics.org/blog/index.php?pk=146010&T=6

[TABLE]
[ROW][C]Meta Analysis of Goldfeld-Quandt test for Heteroskedasticity[/C][/ROW]
[ROW][C]Description[/C][C]# significant tests[/C][C]% significant tests[/C][C]OK/NOK[/C][/ROW]
[ROW][C]1% type I error level[/C][C]20[/C][C]0.8[/C][C]NOK[/C][/ROW]
[ROW][C]5% type I error level[/C][C]20[/C][C]0.8[/C][C]NOK[/C][/ROW]
[ROW][C]10% type I error level[/C][C]20[/C][C]0.8[/C][C]NOK[/C][/ROW]
[/TABLE]
Source: https://freestatistics.org/blog/index.php?pk=146010&T=6

Globally Unique Identifier (entire table): ba.freestatistics.org/blog/index.php?pk=146010&T=6

As an alternative you can also use a QR Code:  

The GUIDs for individual cells are displayed in the table below:

Meta Analysis of Goldfeld-Quandt test for Heteroskedasticity
Description# significant tests% significant testsOK/NOK
1% type I error level200.8NOK
5% type I error level200.8NOK
10% type I error level200.8NOK


Parameters (Session):
par1 = 4 ; par2 = Do not include Seasonal Dummies ; par3 = No Linear Trend ;
Parameters (R input):
par1 = 4 ; par2 = Do not include Seasonal Dummies ; par3 = No Linear Trend ;
R code (references can be found in the software module):
library(lattice)
library(lmtest)
n25 <- 25 #minimum number of obs. for Goldfeld-Quandt test
par1 <- as.numeric(par1)
x <- t(y)
k <- length(x[1,])
n <- length(x[,1])
x1 <- cbind(x[,par1], x[,1:k!=par1])
mycolnames <- c(colnames(x)[par1], colnames(x)[1:k!=par1])
colnames(x1) <- mycolnames #colnames(x)[par1]
x <- x1
if (par3 == 'First Differences'){
x2 <- array(0, dim=c(n-1,k), dimnames=list(1:(n-1), paste('(1-B)',colnames(x),sep='')))
for (i in 1:n-1) {
for (j in 1:k) {
x2[i,j] <- x[i+1,j] - x[i,j]
}
}
x <- x2
}
if (par2 == 'Include Monthly Dummies'){
x2 <- array(0, dim=c(n,11), dimnames=list(1:n, paste('M', seq(1:11), sep ='')))
for (i in 1:11){
x2[seq(i,n,12),i] <- 1
}
x <- cbind(x, x2)
}
if (par2 == 'Include Quarterly Dummies'){
x2 <- array(0, dim=c(n,3), dimnames=list(1:n, paste('Q', seq(1:3), sep ='')))
for (i in 1:3){
x2[seq(i,n,4),i] <- 1
}
x <- cbind(x, x2)
}
k <- length(x[1,])
if (par3 == 'Linear Trend'){
x <- cbind(x, c(1:n))
colnames(x)[k+1] <- 't'
}
x
k <- length(x[1,])
df <- as.data.frame(x)
(mylm <- lm(df))
(mysum <- summary(mylm))
if (n > n25) {
kp3 <- k + 3
nmkm3 <- n - k - 3
gqarr <- array(NA, dim=c(nmkm3-kp3+1,3))
numgqtests <- 0
numsignificant1 <- 0
numsignificant5 <- 0
numsignificant10 <- 0
for (mypoint in kp3:nmkm3) {
j <- 0
numgqtests <- numgqtests + 1
for (myalt in c('greater', 'two.sided', 'less')) {
j <- j + 1
gqarr[mypoint-kp3+1,j] <- gqtest(mylm, point=mypoint, alternative=myalt)$p.value
}
if (gqarr[mypoint-kp3+1,2] < 0.01) numsignificant1 <- numsignificant1 + 1
if (gqarr[mypoint-kp3+1,2] < 0.05) numsignificant5 <- numsignificant5 + 1
if (gqarr[mypoint-kp3+1,2] < 0.10) numsignificant10 <- numsignificant10 + 1
}
gqarr
}
bitmap(file='test0.png')
plot(x[,1], type='l', main='Actuals and Interpolation', ylab='value of Actuals and Interpolation (dots)', xlab='time or index')
points(x[,1]-mysum$resid)
grid()
dev.off()
bitmap(file='test1.png')
plot(mysum$resid, type='b', pch=19, main='Residuals', ylab='value of Residuals', xlab='time or index')
grid()
dev.off()
bitmap(file='test2.png')
hist(mysum$resid, main='Residual Histogram', xlab='values of Residuals')
grid()
dev.off()
bitmap(file='test3.png')
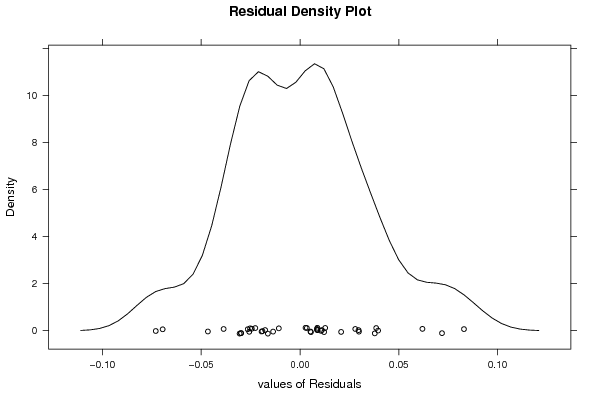
densityplot(~mysum$resid,col='black',main='Residual Density Plot', xlab='values of Residuals')
dev.off()
bitmap(file='test4.png')
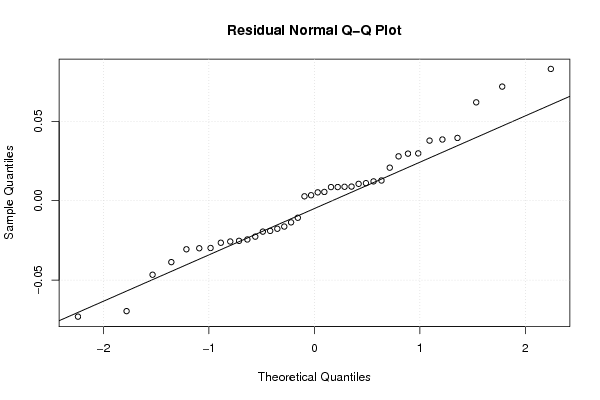
qqnorm(mysum$resid, main='Residual Normal Q-Q Plot')
qqline(mysum$resid)
grid()
dev.off()
(myerror <- as.ts(mysum$resid))
bitmap(file='test5.png')
dum <- cbind(lag(myerror,k=1),myerror)
dum
dum1 <- dum[2:length(myerror),]
dum1
z <- as.data.frame(dum1)
z
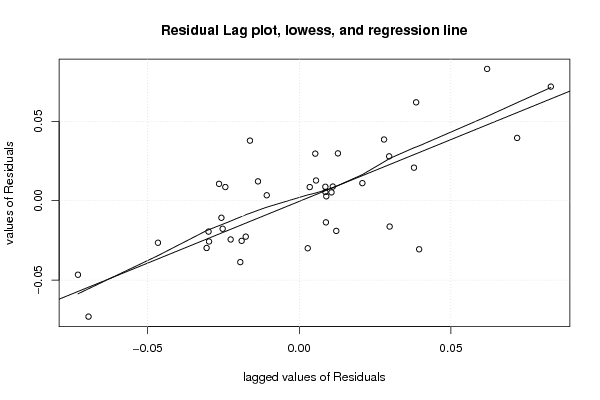
plot(z,main=paste('Residual Lag plot, lowess, and regression line'), ylab='values of Residuals', xlab='lagged values of Residuals')
lines(lowess(z))
abline(lm(z))
grid()
dev.off()
bitmap(file='test6.png')
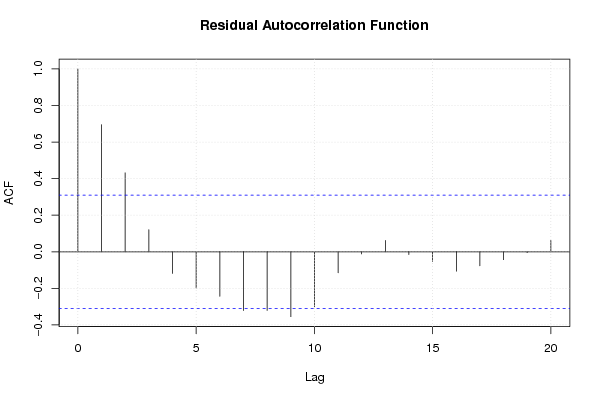
acf(mysum$resid, lag.max=length(mysum$resid)/2, main='Residual Autocorrelation Function')
grid()
dev.off()
bitmap(file='test7.png')
pacf(mysum$resid, lag.max=length(mysum$resid)/2, main='Residual Partial Autocorrelation Function')
grid()
dev.off()
bitmap(file='test8.png')
opar <- par(mfrow = c(2,2), oma = c(0, 0, 1.1, 0))
plot(mylm, las = 1, sub='Residual Diagnostics')
par(opar)
dev.off()
if (n > n25) {
bitmap(file='test9.png')
plot(kp3:nmkm3,gqarr[,2], main='Goldfeld-Quandt test',ylab='2-sided p-value',xlab='breakpoint')
grid()
dev.off()
}
load(file='createtable')
a<-table.start()
a<-table.row.start(a)
a<-table.element(a, 'Multiple Linear Regression - Estimated Regression Equation', 1, TRUE)
a<-table.row.end(a)
myeq <- colnames(x)[1]
myeq <- paste(myeq, '[t] = ', sep='')
for (i in 1:k){
if (mysum$coefficients[i,1] > 0) myeq <- paste(myeq, '+', '')
myeq <- paste(myeq, mysum$coefficients[i,1], sep=' ')
if (rownames(mysum$coefficients)[i] != '(Intercept)') {
myeq <- paste(myeq, rownames(mysum$coefficients)[i], sep='')
if (rownames(mysum$coefficients)[i] != 't') myeq <- paste(myeq, '[t]', sep='')
}
}
myeq <- paste(myeq, ' + e[t]')
a<-table.row.start(a)
a<-table.element(a, myeq)
a<-table.row.end(a)
a<-table.end(a)
table.save(a,file='mytable1.tab')
a<-table.start()
a<-table.row.start(a)
a<-table.element(a,hyperlink('ols1.htm','Multiple Linear Regression - Ordinary Least Squares',''), 6, TRUE)
a<-table.row.end(a)
a<-table.row.start(a)
a<-table.element(a,'Variable',header=TRUE)
a<-table.element(a,'Parameter',header=TRUE)
a<-table.element(a,'S.D.',header=TRUE)
a<-table.element(a,'T-STAT
H0: parameter = 0',header=TRUE)
a<-table.element(a,'2-tail p-value',header=TRUE)
a<-table.element(a,'1-tail p-value',header=TRUE)
a<-table.row.end(a)
for (i in 1:k){
a<-table.row.start(a)
a<-table.element(a,rownames(mysum$coefficients)[i],header=TRUE)
a<-table.element(a,mysum$coefficients[i,1])
a<-table.element(a, round(mysum$coefficients[i,2],6))
a<-table.element(a, round(mysum$coefficients[i,3],4))
a<-table.element(a, round(mysum$coefficients[i,4],6))
a<-table.element(a, round(mysum$coefficients[i,4]/2,6))
a<-table.row.end(a)
}
a<-table.end(a)
table.save(a,file='mytable2.tab')
a<-table.start()
a<-table.row.start(a)
a<-table.element(a, 'Multiple Linear Regression - Regression Statistics', 2, TRUE)
a<-table.row.end(a)
a<-table.row.start(a)
a<-table.element(a, 'Multiple R',1,TRUE)
a<-table.element(a, sqrt(mysum$r.squared))
a<-table.row.end(a)
a<-table.row.start(a)
a<-table.element(a, 'R-squared',1,TRUE)
a<-table.element(a, mysum$r.squared)
a<-table.row.end(a)
a<-table.row.start(a)
a<-table.element(a, 'Adjusted R-squared',1,TRUE)
a<-table.element(a, mysum$adj.r.squared)
a<-table.row.end(a)
a<-table.row.start(a)
a<-table.element(a, 'F-TEST (value)',1,TRUE)
a<-table.element(a, mysum$fstatistic[1])
a<-table.row.end(a)
a<-table.row.start(a)
a<-table.element(a, 'F-TEST (DF numerator)',1,TRUE)
a<-table.element(a, mysum$fstatistic[2])
a<-table.row.end(a)
a<-table.row.start(a)
a<-table.element(a, 'F-TEST (DF denominator)',1,TRUE)
a<-table.element(a, mysum$fstatistic[3])
a<-table.row.end(a)
a<-table.row.start(a)
a<-table.element(a, 'p-value',1,TRUE)
a<-table.element(a, 1-pf(mysum$fstatistic[1],mysum$fstatistic[2],mysum$fstatistic[3]))
a<-table.row.end(a)
a<-table.row.start(a)
a<-table.element(a, 'Multiple Linear Regression - Residual Statistics', 2, TRUE)
a<-table.row.end(a)
a<-table.row.start(a)
a<-table.element(a, 'Residual Standard Deviation',1,TRUE)
a<-table.element(a, mysum$sigma)
a<-table.row.end(a)
a<-table.row.start(a)
a<-table.element(a, 'Sum Squared Residuals',1,TRUE)
a<-table.element(a, sum(myerror*myerror))
a<-table.row.end(a)
a<-table.end(a)
table.save(a,file='mytable3.tab')
a<-table.start()
a<-table.row.start(a)
a<-table.element(a, 'Multiple Linear Regression - Actuals, Interpolation, and Residuals', 4, TRUE)
a<-table.row.end(a)
a<-table.row.start(a)
a<-table.element(a, 'Time or Index', 1, TRUE)
a<-table.element(a, 'Actuals', 1, TRUE)
a<-table.element(a, 'Interpolation
Forecast', 1, TRUE)
a<-table.element(a, 'Residuals
Prediction Error', 1, TRUE)
a<-table.row.end(a)
for (i in 1:n) {
a<-table.row.start(a)
a<-table.element(a,i, 1, TRUE)
a<-table.element(a,x[i])
a<-table.element(a,x[i]-mysum$resid[i])
a<-table.element(a,mysum$resid[i])
a<-table.row.end(a)
}
a<-table.end(a)
table.save(a,file='mytable4.tab')
if (n > n25) {
a<-table.start()
a<-table.row.start(a)
a<-table.element(a,'Goldfeld-Quandt test for Heteroskedasticity',4,TRUE)
a<-table.row.end(a)
a<-table.row.start(a)
a<-table.element(a,'p-values',header=TRUE)
a<-table.element(a,'Alternative Hypothesis',3,header=TRUE)
a<-table.row.end(a)
a<-table.row.start(a)
a<-table.element(a,'breakpoint index',header=TRUE)
a<-table.element(a,'greater',header=TRUE)
a<-table.element(a,'2-sided',header=TRUE)
a<-table.element(a,'less',header=TRUE)
a<-table.row.end(a)
for (mypoint in kp3:nmkm3) {
a<-table.row.start(a)
a<-table.element(a,mypoint,header=TRUE)
a<-table.element(a,gqarr[mypoint-kp3+1,1])
a<-table.element(a,gqarr[mypoint-kp3+1,2])
a<-table.element(a,gqarr[mypoint-kp3+1,3])
a<-table.row.end(a)
}
a<-table.end(a)
table.save(a,file='mytable5.tab')
a<-table.start()
a<-table.row.start(a)
a<-table.element(a,'Meta Analysis of Goldfeld-Quandt test for Heteroskedasticity',4,TRUE)
a<-table.row.end(a)
a<-table.row.start(a)
a<-table.element(a,'Description',header=TRUE)
a<-table.element(a,'# significant tests',header=TRUE)
a<-table.element(a,'% significant tests',header=TRUE)
a<-table.element(a,'OK/NOK',header=TRUE)
a<-table.row.end(a)
a<-table.row.start(a)
a<-table.element(a,'1% type I error level',header=TRUE)
a<-table.element(a,numsignificant1)
a<-table.element(a,numsignificant1/numgqtests)
if (numsignificant1/numgqtests < 0.01) dum <- 'OK' else dum <- 'NOK'
a<-table.element(a,dum)
a<-table.row.end(a)
a<-table.row.start(a)
a<-table.element(a,'5% type I error level',header=TRUE)
a<-table.element(a,numsignificant5)
a<-table.element(a,numsignificant5/numgqtests)
if (numsignificant5/numgqtests < 0.05) dum <- 'OK' else dum <- 'NOK'
a<-table.element(a,dum)
a<-table.row.end(a)
a<-table.row.start(a)
a<-table.element(a,'10% type I error level',header=TRUE)
a<-table.element(a,numsignificant10)
a<-table.element(a,numsignificant10/numgqtests)
if (numsignificant10/numgqtests < 0.1) dum <- 'OK' else dum <- 'NOK'
a<-table.element(a,dum)
a<-table.row.end(a)
a<-table.end(a)
table.save(a,file='mytable6.tab')
}