| Multiple Linear Regression - Estimated Regression Equation |
| Cultuuruitgaven[t] = + 43.1196518887865 + 1.06911178353785JAAR[t] + 0.0955092964682526Bioscoop[t] + 0.293827546929861Schouwburgabonnement[t] + 0.271011310340612Daguitstap[t] -0.140287440271962HuurDVD[t] + e[t] |
| Multiple Linear Regression - Ordinary Least Squares | |||||
| Variable | Parameter | S.D. | T-STAT H0: parameter = 0 | 2-tail p-value | 1-tail p-value |
| (Intercept) | 43.1196518887865 | 11.20716 | 3.8475 | 0.000328 | 0.000164 |
| JAAR | 1.06911178353785 | 0.142107 | 7.5233 | 0 | 0 |
| Bioscoop | 0.0955092964682526 | 0.030258 | 3.1565 | 0.002656 | 0.001328 |
| Schouwburgabonnement | 0.293827546929861 | 0.024122 | 12.1808 | 0 | 0 |
| Daguitstap | 0.271011310340612 | 0.040701 | 6.6585 | 0 | 0 |
| HuurDVD | -0.140287440271962 | 0.134669 | -1.0417 | 0.302359 | 0.15118 |
| Multiple Linear Regression - Regression Statistics | |
| Multiple R | 0.996983707496076 |
| R-squared | 0.993976513012621 |
| Adjusted R-squared | 0.993397331571527 |
| F-TEST (value) | 1716.17466045679 |
| F-TEST (DF numerator) | 5 |
| F-TEST (DF denominator) | 52 |
| p-value | 0 |
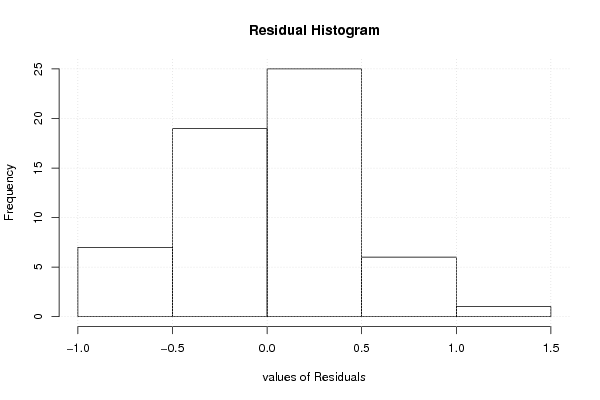
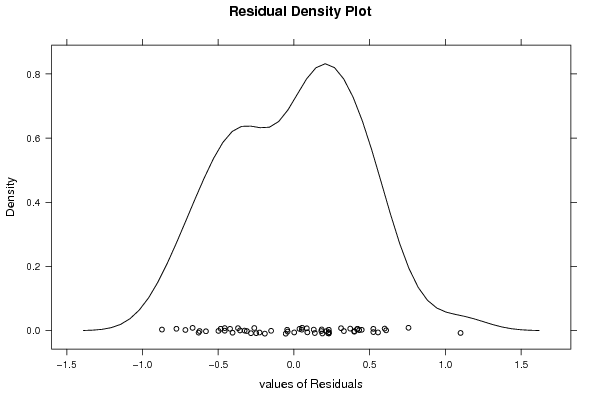
| Multiple Linear Regression - Residual Statistics | |
| Residual Standard Deviation | 0.452997679974217 |
| Sum Squared Residuals | 10.6707586992252 |
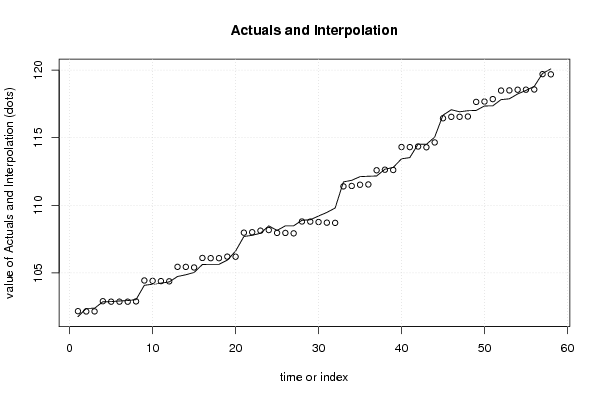
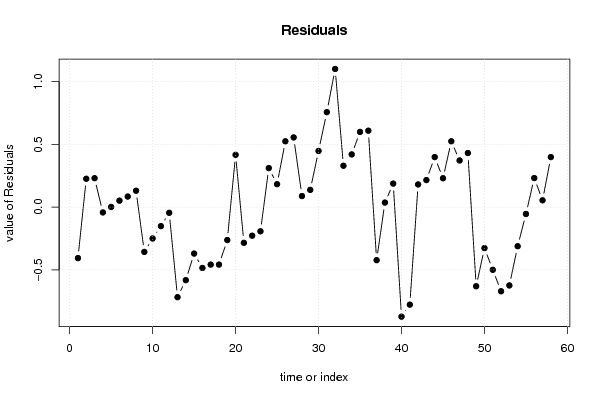
| Multiple Linear Regression - Actuals, Interpolation, and Residuals | |||
| Time or Index | Actuals | Interpolation Forecast | Residuals Prediction Error |
| 1 | 101.76 | 102.165616119899 | -0.405616119898497 |
| 2 | 102.37 | 102.143827571977 | 0.226172428023485 |
| 3 | 102.38 | 102.149439069587 | 0.230560930412596 |
| 4 | 102.86 | 102.901912378122 | -0.0419123781222031 |
| 5 | 102.87 | 102.868243392457 | 0.0017566075430726 |
| 6 | 102.92 | 102.868243392457 | 0.0517566075430694 |
| 7 | 102.95 | 102.865437643651 | 0.0845623563485112 |
| 8 | 103.02 | 102.889286508498 | 0.130713491502271 |
| 9 | 104.08 | 104.436222279752 | -0.356222279751516 |
| 10 | 104.16 | 104.409238944839 | -0.249238944839022 |
| 11 | 104.24 | 104.391001577604 | -0.151001577603669 |
| 12 | 104.33 | 104.374821915746 | -0.0448219157457216 |
| 13 | 104.73 | 105.446871974753 | -0.716871974752862 |
| 14 | 104.86 | 105.441260477142 | -0.581260477141989 |
| 15 | 105.03 | 105.399500354774 | -0.369500354774269 |
| 16 | 105.62 | 106.10412976166 | -0.484129761659859 |
| 17 | 105.63 | 106.087295268827 | -0.457295268827234 |
| 18 | 105.63 | 106.087295268827 | -0.457295268827234 |
| 19 | 105.94 | 106.201906424589 | -0.261906424589135 |
| 20 | 106.61 | 106.193489178173 | 0.416510821827185 |
| 21 | 107.69 | 107.97381905924 | -0.283819059240059 |
| 22 | 107.78 | 108.007247313004 | -0.227247313003943 |
| 23 | 107.93 | 108.122283014027 | -0.192283014026947 |
| 24 | 108.48 | 108.169082569296 | 0.310917430703605 |
| 25 | 108.14 | 107.95710624822 | 0.182893751779952 |
| 26 | 108.48 | 107.955703373817 | 0.524296626182676 |
| 27 | 108.48 | 107.924840136957 | 0.555159863042507 |
| 28 | 108.89 | 108.801662608126 | 0.0883373918735986 |
| 29 | 108.93 | 108.79211167848 | 0.137888321520431 |
| 30 | 109.21 | 108.762651316022 | 0.447348683977529 |
| 31 | 109.47 | 108.713550711927 | 0.756449288072722 |
| 32 | 109.8 | 108.699729017437 | 1.10027098256326 |
| 33 | 111.73 | 111.400283640225 | 0.329716359774719 |
| 34 | 111.85 | 111.430217631844 | 0.419782368155682 |
| 35 | 112.12 | 111.520951463489 | 0.599048536510851 |
| 36 | 112.15 | 111.541218076831 | 0.608781923168915 |
| 37 | 112.17 | 112.592092493134 | -0.42209249313358 |
| 38 | 112.67 | 112.633549741964 | 0.0364502580356428 |
| 39 | 112.8 | 112.612506625924 | 0.187493374076433 |
| 40 | 113.44 | 114.311747541759 | -0.871747541759199 |
| 41 | 113.53 | 114.306136044148 | -0.776136044148316 |
| 42 | 114.53 | 114.349115227559 | 0.18088477244097 |
| 43 | 114.51 | 114.294403125853 | 0.215596874147037 |
| 44 | 115.05 | 114.651398233561 | 0.398601766439368 |
| 45 | 116.67 | 116.440010998665 | 0.229989001334743 |
| 46 | 117.07 | 116.545662722606 | 0.524337277394332 |
| 47 | 116.92 | 116.548468471411 | 0.3715315285889 |
| 48 | 117 | 116.569151795373 | 0.430848204626704 |
| 49 | 117.02 | 117.649724694487 | -0.629724694487336 |
| 50 | 117.35 | 117.67601951606 | -0.326019516060412 |
| 51 | 117.36 | 117.858631308768 | -0.498631308768392 |
| 52 | 117.82 | 118.489531563584 | -0.669531563583711 |
| 53 | 117.88 | 118.503291116439 | -0.623291116438692 |
| 54 | 118.24 | 118.551105294761 | -0.311105294761428 |
| 55 | 118.5 | 118.554418355094 | -0.0544183550935074 |
| 56 | 118.8 | 118.568447099121 | 0.231552900879294 |
| 57 | 119.76 | 119.705559705739 | 0.0544402942607372 |
| 58 | 120.09 | 119.691530961712 | 0.398469038287931 |
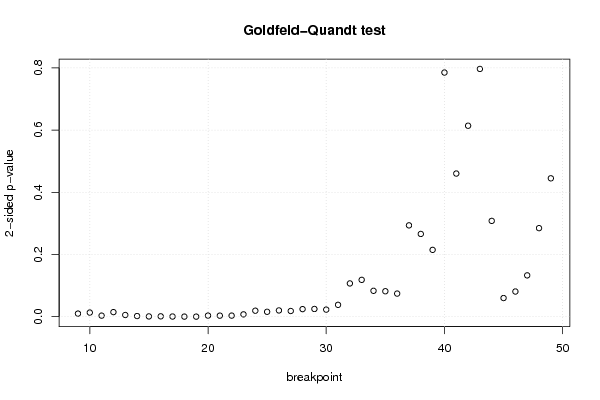
| Goldfeld-Quandt test for Heteroskedasticity | |||
| p-values | Alternative Hypothesis | ||
| breakpoint index | greater | 2-sided | less |
| 9 | 0.00502072491588492 | 0.0100414498317698 | 0.994979275084115 |
| 10 | 0.00669688092432525 | 0.0133937618486505 | 0.993303119075675 |
| 11 | 0.0017401581893518 | 0.0034803163787036 | 0.998259841810648 |
| 12 | 0.00741959649461374 | 0.0148391929892275 | 0.992580403505386 |
| 13 | 0.00279602970144418 | 0.00559205940288835 | 0.997203970298556 |
| 14 | 0.00110194305715108 | 0.00220388611430216 | 0.998898056942849 |
| 15 | 0.000476665719152754 | 0.000953331438305508 | 0.999523334280847 |
| 16 | 0.000649925724005584 | 0.00129985144801117 | 0.999350074275994 |
| 17 | 0.000320809571281456 | 0.000641619142562911 | 0.999679190428719 |
| 18 | 0.000172828219287115 | 0.000345656438574231 | 0.999827171780713 |
| 19 | 0.000119458066809006 | 0.000238916133618012 | 0.999880541933191 |
| 20 | 0.00186151063345141 | 0.00372302126690282 | 0.998138489366549 |
| 21 | 0.00171554117483145 | 0.00343108234966289 | 0.998284458825169 |
| 22 | 0.0017987286403889 | 0.0035974572807778 | 0.998201271359611 |
| 23 | 0.00384167320135226 | 0.00768334640270452 | 0.996158326798648 |
| 24 | 0.00965278179992227 | 0.0193055635998445 | 0.990347218200078 |
| 25 | 0.00793658829058768 | 0.0158731765811754 | 0.992063411709412 |
| 26 | 0.0101081415990047 | 0.0202162831980095 | 0.989891858400995 |
| 27 | 0.00923009430780607 | 0.0184601886156121 | 0.990769905692194 |
| 28 | 0.0122062673198232 | 0.0244125346396465 | 0.987793732680177 |
| 29 | 0.0124905485051236 | 0.0249810970102473 | 0.987509451494876 |
| 30 | 0.0114283557611581 | 0.0228567115223163 | 0.988571644238842 |
| 31 | 0.0190947554300468 | 0.0381895108600936 | 0.980905244569953 |
| 32 | 0.0535432595351598 | 0.10708651907032 | 0.94645674046484 |
| 33 | 0.0592902142808401 | 0.11858042856168 | 0.94070978571916 |
| 34 | 0.0416617970909453 | 0.0833235941818906 | 0.958338202909055 |
| 35 | 0.0409780145515398 | 0.0819560291030796 | 0.95902198544846 |
| 36 | 0.0371994480109748 | 0.0743988960219496 | 0.962800551989025 |
| 37 | 0.146917170391728 | 0.293834340783455 | 0.853082829608272 |
| 38 | 0.133094861081901 | 0.266189722163802 | 0.866905138918099 |
| 39 | 0.107505251252877 | 0.215010502505754 | 0.892494748747123 |
| 40 | 0.392622786231374 | 0.785245572462749 | 0.607377213768626 |
| 41 | 0.769805673908008 | 0.460388652183983 | 0.230194326091992 |
| 42 | 0.692911364555042 | 0.614177270889916 | 0.307088635444958 |
| 43 | 0.6016050555249 | 0.796789888950199 | 0.3983949444751 |
| 44 | 0.845896298593003 | 0.308207402813993 | 0.154103701406997 |
| 45 | 0.969961559340205 | 0.0600768813195902 | 0.0300384406597951 |
| 46 | 0.959485453374453 | 0.0810290932510944 | 0.0405145466255472 |
| 47 | 0.933478182701915 | 0.13304363459617 | 0.0665218172980849 |
| 48 | 0.857549983752711 | 0.284900032494578 | 0.142450016247289 |
| 49 | 0.777445777511202 | 0.445108444977597 | 0.222554222488798 |
| Meta Analysis of Goldfeld-Quandt test for Heteroskedasticity | |||
| Description | # significant tests | % significant tests | OK/NOK |
| 1% type I error level | 12 | 0.292682926829268 | NOK |
| 5% type I error level | 23 | 0.560975609756098 | NOK |
| 10% type I error level | 28 | 0.682926829268293 | NOK |