| Multiple Linear Regression - Estimated Regression Equation |
| Werkloosheid[t] = + 8.03995446577923 -0.183157594865443inflatie[t] -0.00101966180929971nieuwe_res_woningen[t] + 0.000156102987458662private_voertuigen[t] + e[t] |
| Multiple Linear Regression - Ordinary Least Squares | |||||
| Variable | Parameter | S.D. | T-STAT H0: parameter = 0 | 2-tail p-value | 1-tail p-value |
| (Intercept) | 8.03995446577923 | 0.095466 | 84.2179 | 0 | 0 |
| inflatie | -0.183157594865443 | 0.03407 | -5.3759 | 1e-06 | 1e-06 |
| nieuwe_res_woningen | -0.00101966180929971 | 0.003694 | -0.276 | 0.783513 | 0.391756 |
| private_voertuigen | 0.000156102987458662 | 0.001347 | 0.1159 | 0.90817 | 0.454085 |
| Multiple Linear Regression - Regression Statistics | |
| Multiple R | 0.577050206231421 |
| R-squared | 0.332986940511725 |
| Adjusted R-squared | 0.298486265020952 |
| F-TEST (value) | 9.651606404077 |
| F-TEST (DF numerator) | 3 |
| F-TEST (DF denominator) | 58 |
| p-value | 2.91180005048686e-05 |
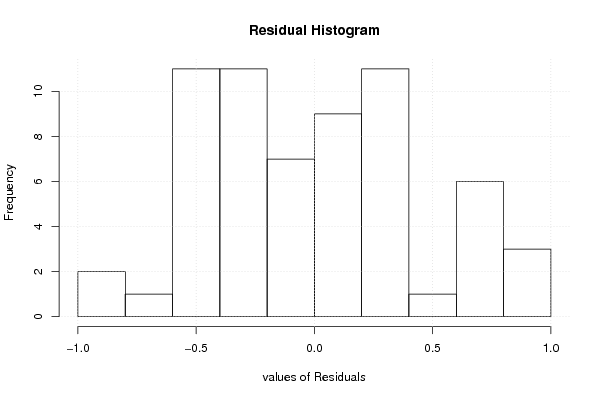
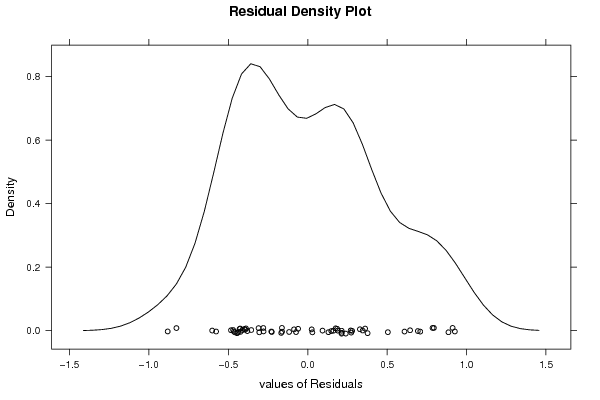
| Multiple Linear Regression - Residual Statistics | |
| Residual Standard Deviation | 0.460062967848792 |
| Sum Squared Residuals | 12.2761601943786 |
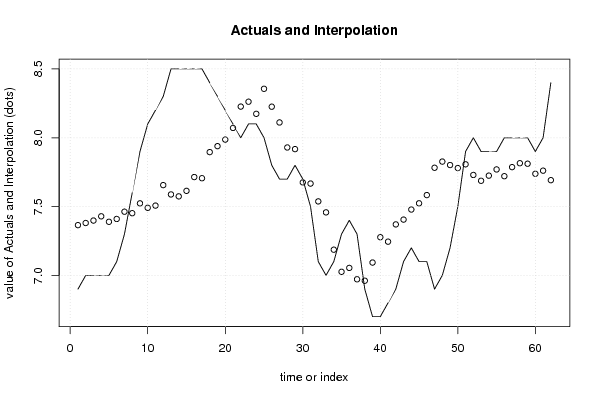
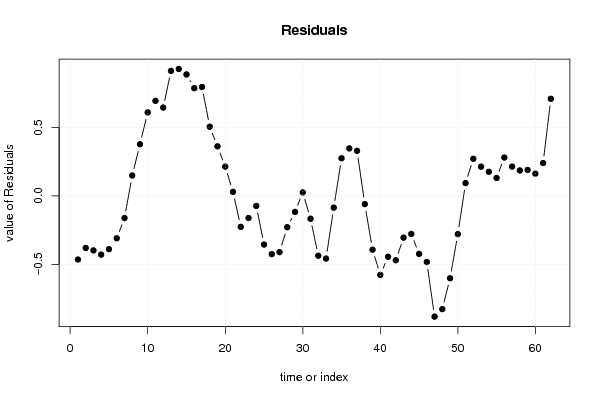
| Multiple Linear Regression - Actuals, Interpolation, and Residuals | |||
| Time or Index | Actuals | Interpolation Forecast | Residuals Prediction Error |
| 1 | 6.9 | 7.36503769572793 | -0.465037695727927 |
| 2 | 7 | 7.38048507935978 | -0.380485079359783 |
| 3 | 7 | 7.39835784080294 | -0.398357840802938 |
| 4 | 7 | 7.42917394947864 | -0.429173949478638 |
| 5 | 7 | 7.3891704231934 | -0.389170423193391 |
| 6 | 7.1 | 7.40985870951485 | -0.30985870951485 |
| 7 | 7.3 | 7.4626053853364 | -0.162605385336404 |
| 8 | 7.6 | 7.45177282926803 | 0.148227170731971 |
| 9 | 7.9 | 7.52339045800628 | 0.376609541993718 |
| 10 | 8.1 | 7.4908255671559 | 0.609174432844101 |
| 11 | 8.2 | 7.5068976250905 | 0.693102374909497 |
| 12 | 8.3 | 7.6557738326563 | 0.644226167343702 |
| 13 | 8.5 | 7.58810572567347 | 0.911894274326528 |
| 14 | 8.5 | 7.57402232488079 | 0.925977675119206 |
| 15 | 8.5 | 7.6141633743958 | 0.8858366256042 |
| 16 | 8.5 | 7.71437011313969 | 0.785629886860307 |
| 17 | 8.5 | 7.70592089786834 | 0.794079102131661 |
| 18 | 8.4 | 7.8956378860904 | 0.5043621139096 |
| 19 | 8.3 | 7.93890195295571 | 0.361098047044288 |
| 20 | 8.2 | 7.98674959954582 | 0.213250400454178 |
| 21 | 8.1 | 8.07109335455184 | 0.0289066454481619 |
| 22 | 8 | 8.22651979131725 | -0.226519791317246 |
| 23 | 8.1 | 8.26184265499474 | -0.161842654994744 |
| 24 | 8.1 | 8.17384953116144 | -0.0738495311614436 |
| 25 | 8 | 8.35565419691497 | -0.355654196914975 |
| 26 | 7.8 | 8.22561623590037 | -0.425616235900368 |
| 27 | 7.7 | 8.11113960737936 | -0.411139607379365 |
| 28 | 7.7 | 7.92929799477703 | -0.22929799477703 |
| 29 | 7.8 | 7.91751391717941 | -0.117513917179412 |
| 30 | 7.7 | 7.67540107081849 | 0.0245989291815109 |
| 31 | 7.5 | 7.66713466701331 | -0.167134667013314 |
| 32 | 7.1 | 7.53747520390398 | -0.437475203903984 |
| 33 | 7 | 7.45779078137627 | -0.457790781376267 |
| 34 | 7.1 | 7.18649470241104 | -0.0864947024110401 |
| 35 | 7.3 | 7.0259853931045 | 0.274014606895493 |
| 36 | 7.4 | 7.05409016904187 | 0.345909830958133 |
| 37 | 7.3 | 6.97164300285658 | 0.328356997143415 |
| 38 | 6.9 | 6.96093692071871 | -0.0609369207187082 |
| 39 | 6.7 | 7.09311769683504 | -0.393117696835038 |
| 40 | 6.7 | 7.27717560163414 | -0.577175601634143 |
| 41 | 6.8 | 7.24485804278803 | -0.444858042788027 |
| 42 | 6.9 | 7.37032851957065 | -0.470328519570647 |
| 43 | 7.1 | 7.40517757171303 | -0.305177571713026 |
| 44 | 7.2 | 7.47847692540255 | -0.278476925402552 |
| 45 | 7.1 | 7.5237237764695 | -0.423723776469495 |
| 46 | 7.1 | 7.58353401695615 | -0.483534016956155 |
| 47 | 6.9 | 7.78196701268213 | -0.881967012682132 |
| 48 | 7 | 7.82689855531999 | -0.826898555319985 |
| 49 | 7.2 | 7.80183265658268 | -0.60183265658268 |
| 50 | 7.5 | 7.77980410555333 | -0.27980410555333 |
| 51 | 7.9 | 7.80709312518693 | 0.0929068748130712 |
| 52 | 8 | 7.72965423404839 | 0.270345765951615 |
| 53 | 7.9 | 7.68733986318477 | 0.212660136815232 |
| 54 | 7.9 | 7.72460707693918 | 0.175392923060824 |
| 55 | 7.9 | 7.7697237108573 | 0.130276289142707 |
| 56 | 8 | 7.72060100755077 | 0.279398992449232 |
| 57 | 8 | 7.78655095798591 | 0.213449042014087 |
| 58 | 8 | 7.81486377938631 | 0.185136220613693 |
| 59 | 8 | 7.81125568324887 | 0.188744316751129 |
| 60 | 7.9 | 7.73822661391736 | 0.161773386082639 |
| 61 | 8 | 7.76078373470934 | 0.239216265290656 |
| 62 | 8.4 | 7.69170526591552 | 0.708294734084484 |
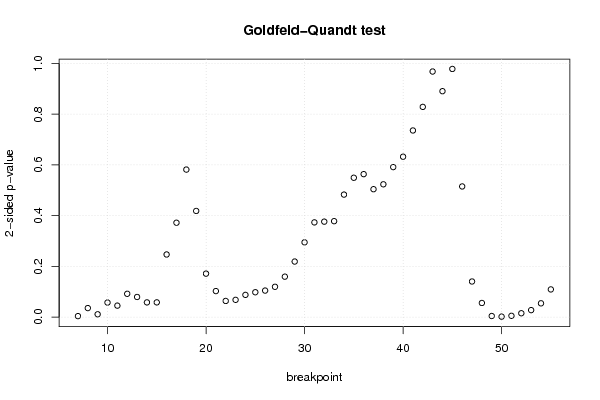
| Goldfeld-Quandt test for Heteroskedasticity | |||
| p-values | Alternative Hypothesis | ||
| breakpoint index | greater | 2-sided | less |
| 7 | 0.00184374187840209 | 0.00368748375680417 | 0.998156258121598 |
| 8 | 0.0176902370276906 | 0.0353804740553812 | 0.98230976297231 |
| 9 | 0.00541859039031122 | 0.0108371807806224 | 0.994581409609689 |
| 10 | 0.0285504955919242 | 0.0571009911838485 | 0.971449504408076 |
| 11 | 0.022484814415666 | 0.0449696288313321 | 0.977515185584334 |
| 12 | 0.0458459117541128 | 0.0916918235082255 | 0.954154088245887 |
| 13 | 0.0395361613740348 | 0.0790723227480696 | 0.960463838625965 |
| 14 | 0.0288826968020393 | 0.0577653936040786 | 0.97111730319796 |
| 15 | 0.0289281759295627 | 0.0578563518591254 | 0.971071824070437 |
| 16 | 0.123375205352784 | 0.246750410705568 | 0.876624794647216 |
| 17 | 0.18601792408566 | 0.37203584817132 | 0.81398207591434 |
| 18 | 0.709121472037455 | 0.581757055925089 | 0.290878527962545 |
| 19 | 0.790770851528962 | 0.418458296942076 | 0.209229148471038 |
| 20 | 0.914420198818188 | 0.171159602363625 | 0.0855798011818124 |
| 21 | 0.948765097173943 | 0.102469805652113 | 0.0512349028260566 |
| 22 | 0.968286799703618 | 0.0634264005927642 | 0.0317132002963821 |
| 23 | 0.966083041102422 | 0.0678339177951556 | 0.0339169588975778 |
| 24 | 0.956256839109184 | 0.0874863217816322 | 0.0437431608908161 |
| 25 | 0.95108726616508 | 0.0978254676698392 | 0.0489127338349196 |
| 26 | 0.947777849666664 | 0.104444300666672 | 0.0522221503333361 |
| 27 | 0.940346024147727 | 0.119307951704547 | 0.0596539758522733 |
| 28 | 0.920365039770322 | 0.159269920459355 | 0.0796349602296776 |
| 29 | 0.890539858950061 | 0.218920282099877 | 0.109460141049939 |
| 30 | 0.852662136138718 | 0.294675727722564 | 0.147337863861282 |
| 31 | 0.81326847179172 | 0.373463056416561 | 0.18673152820828 |
| 32 | 0.811879803800588 | 0.376240392398823 | 0.188120196199412 |
| 33 | 0.810917366816037 | 0.378165266367927 | 0.189082633183963 |
| 34 | 0.758477447083748 | 0.483045105832504 | 0.241522552916252 |
| 35 | 0.7252900167321 | 0.5494199665358 | 0.2747099832679 |
| 36 | 0.718162308063827 | 0.563675383872346 | 0.281837691936173 |
| 37 | 0.747860666680177 | 0.504278666639647 | 0.252139333319823 |
| 38 | 0.738188441672824 | 0.523623116654353 | 0.261811558327176 |
| 39 | 0.704235393521486 | 0.591529212957028 | 0.295764606478514 |
| 40 | 0.683806160678633 | 0.632387678642734 | 0.316193839321367 |
| 41 | 0.632005950532955 | 0.73598809893409 | 0.367994049467045 |
| 42 | 0.585473726802755 | 0.82905254639449 | 0.414526273197245 |
| 43 | 0.515744740112833 | 0.968510519774335 | 0.484255259887167 |
| 44 | 0.44546366403524 | 0.89092732807048 | 0.55453633596476 |
| 45 | 0.510659949010397 | 0.978680101979206 | 0.489340050989603 |
| 46 | 0.742432965281985 | 0.51513406943603 | 0.257567034718015 |
| 47 | 0.929882392978995 | 0.140235214042009 | 0.0701176070210046 |
| 48 | 0.972264289679892 | 0.0554714206402163 | 0.0277357103201082 |
| 49 | 0.997967390963103 | 0.00406521807379413 | 0.00203260903689707 |
| 50 | 0.999240638925942 | 0.00151872214811608 | 0.00075936107405804 |
| 51 | 0.99757842397702 | 0.00484315204595876 | 0.00242157602297938 |
| 52 | 0.992522664729986 | 0.0149546705400285 | 0.00747733527001426 |
| 53 | 0.98636331008929 | 0.0272733798214196 | 0.0136366899107098 |
| 54 | 0.972903524084212 | 0.0541929518315769 | 0.0270964759157885 |
| 55 | 0.945497946325252 | 0.109004107349496 | 0.0545020536747481 |
| Meta Analysis of Goldfeld-Quandt test for Heteroskedasticity | |||
| Description | # significant tests | % significant tests | OK/NOK |
| 1% type I error level | 4 | 0.0816326530612245 | NOK |
| 5% type I error level | 9 | 0.183673469387755 | NOK |
| 10% type I error level | 20 | 0.408163265306122 | NOK |