| Multiple Linear Regression - Estimated Regression Equation |
| TotalNrPV[t] = -60.577399224116 + 249.166762809405Pop[t] + 7.13109558056245t -2.90055463379471pop_t[t] + 2.06254796783972TotalNrCC[t] + 0.941493590867784TotalNrPRV[t] + e[t] |
| Multiple Linear Regression - Ordinary Least Squares | |||||
| Variable | Parameter | S.D. | T-STAT H0: parameter = 0 | 2-tail p-value | 1-tail p-value |
| (Intercept) | -60.577399224116 | 215.741892 | -0.2808 | 0.779947 | 0.389974 |
| Pop | 249.166762809405 | 218.009388 | 1.1429 | 0.258115 | 0.129057 |
| t | 7.13109558056245 | 4.370256 | 1.6317 | 0.108554 | 0.054277 |
| pop_t | -2.90055463379471 | 5.456517 | -0.5316 | 0.5972 | 0.2986 |
| TotalNrCC | 2.06254796783972 | 0.098116 | 21.0216 | 0 | 0 |
| TotalNrPRV | 0.941493590867784 | 0.365341 | 2.577 | 0.01273 | 0.006365 |
| Multiple Linear Regression - Regression Statistics | |
| Multiple R | 0.965497135333629 |
| R-squared | 0.932184718337444 |
| Adjusted R-squared | 0.925905525590911 |
| F-TEST (value) | 148.456140138737 |
| F-TEST (DF numerator) | 5 |
| F-TEST (DF denominator) | 54 |
| p-value | 0 |
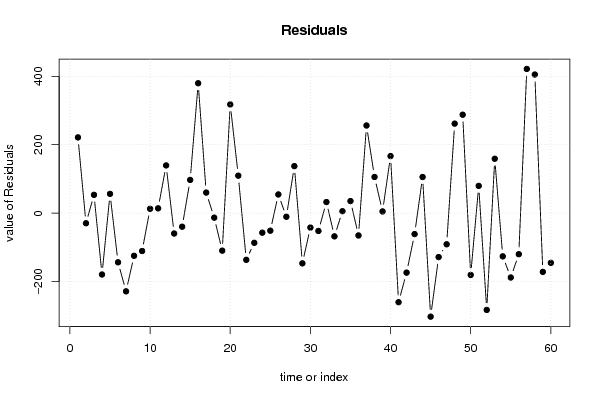
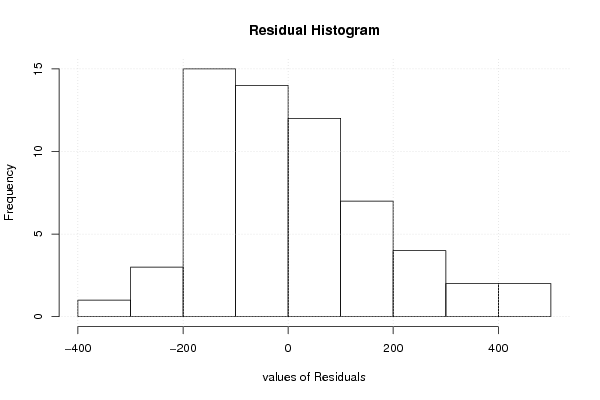
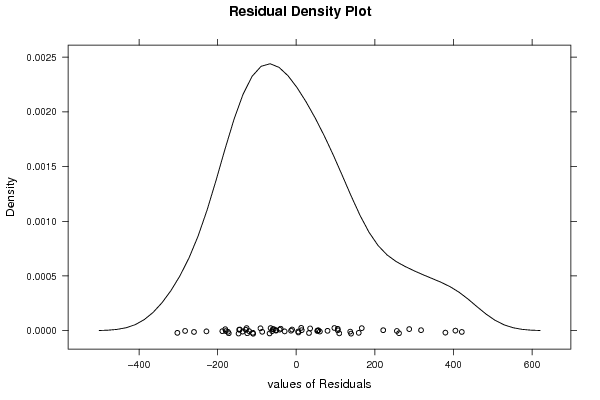
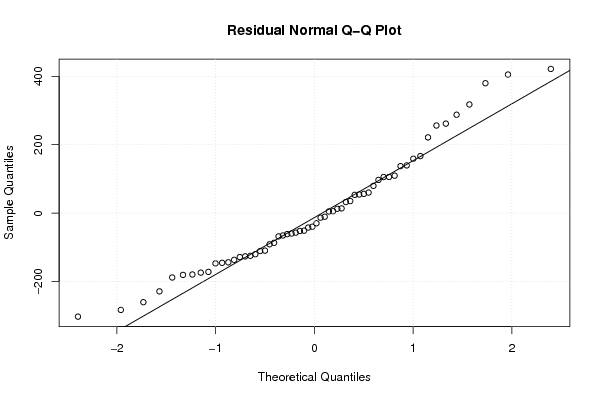
| Multiple Linear Regression - Residual Statistics | |
| Residual Standard Deviation | 176.03906918437 |
| Sum Squared Residuals | 1673446.70948217 |
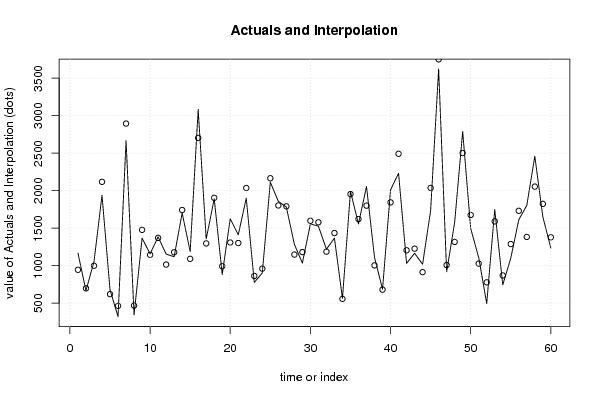
| Multiple Linear Regression - Actuals, Interpolation, and Residuals | |||
| Time or Index | Actuals | Interpolation Forecast | Residuals Prediction Error |
| 1 | 1167 | 945.55292918343 | 221.44707081657 |
| 2 | 669 | 698.424360305266 | -29.4243603052656 |
| 3 | 1053 | 999.438558174502 | 53.5614418254981 |
| 4 | 1939 | 2118.1536406097 | -179.153640609704 |
| 5 | 678 | 621.62079806335 | 56.3792019366498 |
| 6 | 321 | 464.569786286064 | -143.569786286064 |
| 7 | 2667 | 2895.38561032391 | -228.385610323907 |
| 8 | 345 | 469.531833922926 | -124.531833922926 |
| 9 | 1367 | 1477.54868172357 | -110.548681723569 |
| 10 | 1158 | 1145.18109267991 | 12.8189073200929 |
| 11 | 1385 | 1370.90988865064 | 14.0901113493643 |
| 12 | 1155 | 1015.40777106783 | 139.592228932166 |
| 13 | 1120 | 1179.39599912913 | -59.3959991291282 |
| 14 | 1703 | 1742.5285475554 | -39.5285475553975 |
| 15 | 1189 | 1091.81513046472 | 97.1848695352825 |
| 16 | 3083 | 2703.34810823257 | 379.651891767428 |
| 17 | 1357 | 1296.80064132169 | 60.1993586783139 |
| 18 | 1892 | 1905.08599459398 | -13.0859945939781 |
| 19 | 883 | 992.472675248001 | -109.472675248001 |
| 20 | 1627 | 1309.31270337589 | 317.687296624115 |
| 21 | 1412 | 1302.42007987363 | 109.579920126372 |
| 22 | 1900 | 2036.25391907734 | -136.253919077344 |
| 23 | 777 | 863.536305337111 | -86.5363053371106 |
| 24 | 904 | 960.984316069221 | -56.9843160692212 |
| 25 | 2115 | 2166.14685236759 | -51.1468523675871 |
| 26 | 1858 | 1803.34083864901 | 54.6591613509891 |
| 27 | 1781 | 1791.47380708562 | -10.4738070856162 |
| 28 | 1286 | 1148.55927882868 | 137.440721171323 |
| 29 | 1035 | 1181.62180166485 | -146.621801664853 |
| 30 | 1557 | 1599.0268853742 | -42.0268853742029 |
| 31 | 1527 | 1578.96295588923 | -51.9629558892285 |
| 32 | 1220 | 1187.45122711757 | 32.5487728824321 |
| 33 | 1368 | 1435.73698175349 | -67.7369817534924 |
| 34 | 564 | 558.292453573399 | 5.70754642660127 |
| 35 | 1990 | 1954.54720442166 | 35.4527955783443 |
| 36 | 1557 | 1622.11981811343 | -65.1198181134278 |
| 37 | 2057 | 1800.84520625724 | 256.154793742758 |
| 38 | 1111 | 1005.19864145525 | 105.801358544749 |
| 39 | 686 | 680.934067697688 | 5.06593230231228 |
| 40 | 2011 | 1844.25676930581 | 166.743230694187 |
| 41 | 2232 | 2492.07835007977 | -260.078350079766 |
| 42 | 1032 | 1205.72012757331 | -173.720127573308 |
| 43 | 1166 | 1227.10949814264 | -61.1094981426447 |
| 44 | 1020 | 914.322408261599 | 105.677591738401 |
| 45 | 1735 | 2037.3356441038 | -302.335644103798 |
| 46 | 3623 | 3751.21364806784 | -128.213648067842 |
| 47 | 918 | 1008.89005712889 | -90.8900571288913 |
| 48 | 1579 | 1317.33271680016 | 261.667283199843 |
| 49 | 2790 | 2502.35346065859 | 287.646539341411 |
| 50 | 1496 | 1676.39954016272 | -180.399540162724 |
| 51 | 1108 | 1028.27124579398 | 79.7287542060225 |
| 52 | 496 | 778.704899771546 | -282.704899771546 |
| 53 | 1750 | 1590.9431438093 | 159.056856190699 |
| 54 | 744 | 870.222859333609 | -126.222859333609 |
| 55 | 1101 | 1288.91725274653 | -187.917252746532 |
| 56 | 1612 | 1731.92052302535 | -119.920523025345 |
| 57 | 1805 | 1383.57512499306 | 421.424875006941 |
| 58 | 2460 | 2054.88075158893 | 405.119248411073 |
| 59 | 1653 | 1824.56149505056 | -171.561495050555 |
| 60 | 1234 | 1379.05309208335 | -145.053092083351 |
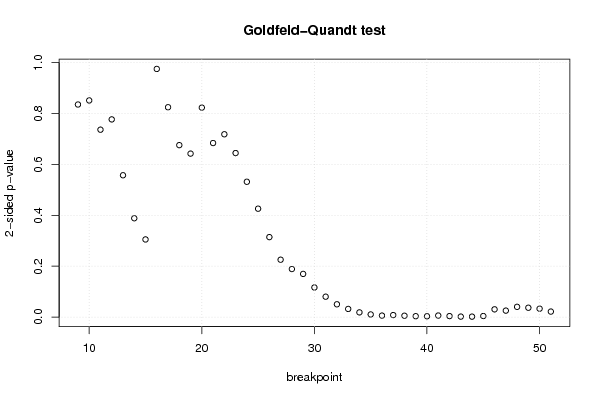
| Goldfeld-Quandt test for Heteroskedasticity | |||
| p-values | Alternative Hypothesis | ||
| breakpoint index | greater | 2-sided | less |
| 9 | 0.417487548245811 | 0.834975096491622 | 0.582512451754189 |
| 10 | 0.425493242427169 | 0.850986484854337 | 0.574506757572831 |
| 11 | 0.368051896271532 | 0.736103792543064 | 0.631948103728468 |
| 12 | 0.388259516968141 | 0.776519033936282 | 0.611740483031859 |
| 13 | 0.278582147712576 | 0.557164295425151 | 0.721417852287424 |
| 14 | 0.194163050384549 | 0.388326100769099 | 0.80583694961545 |
| 15 | 0.1525102703838 | 0.3050205407676 | 0.8474897296162 |
| 16 | 0.512675172583512 | 0.974649654832976 | 0.487324827416488 |
| 17 | 0.412151639927275 | 0.824303279854551 | 0.587848360072724 |
| 18 | 0.337705184810832 | 0.675410369621665 | 0.662294815189168 |
| 19 | 0.321054808832724 | 0.642109617665447 | 0.678945191167276 |
| 20 | 0.411360849824155 | 0.82272169964831 | 0.588639150175845 |
| 21 | 0.341877710417273 | 0.683755420834546 | 0.658122289582727 |
| 22 | 0.35906534845725 | 0.718130696914499 | 0.640934651542751 |
| 23 | 0.322147666454911 | 0.644295332909823 | 0.677852333545089 |
| 24 | 0.26579498680705 | 0.531589973614101 | 0.73420501319295 |
| 25 | 0.212901344518616 | 0.425802689037233 | 0.787098655481383 |
| 26 | 0.157086290976266 | 0.314172581952532 | 0.842913709023734 |
| 27 | 0.112730165829595 | 0.22546033165919 | 0.887269834170405 |
| 28 | 0.0944474524366585 | 0.188894904873317 | 0.905552547563341 |
| 29 | 0.0847940448579074 | 0.169588089715815 | 0.915205955142093 |
| 30 | 0.0582117879045232 | 0.116423575809046 | 0.941788212095477 |
| 31 | 0.0400812920843541 | 0.0801625841687083 | 0.959918707915646 |
| 32 | 0.025212487146676 | 0.050424974293352 | 0.974787512853324 |
| 33 | 0.0160228633922688 | 0.0320457267845376 | 0.983977136607731 |
| 34 | 0.00932515975046283 | 0.0186503195009257 | 0.990674840249537 |
| 35 | 0.00525015386119222 | 0.0105003077223844 | 0.994749846138808 |
| 36 | 0.00300642529415395 | 0.00601285058830791 | 0.996993574705846 |
| 37 | 0.00400360221899495 | 0.0080072044379899 | 0.995996397781005 |
| 38 | 0.00271483685285133 | 0.00542967370570267 | 0.997285163147149 |
| 39 | 0.001785188857005 | 0.00357037771401001 | 0.998214811142995 |
| 40 | 0.00165212974392725 | 0.00330425948785449 | 0.998347870256073 |
| 41 | 0.00309259930885633 | 0.00618519861771266 | 0.996907400691144 |
| 42 | 0.00202596251154047 | 0.00405192502308093 | 0.99797403748846 |
| 43 | 0.000978821969338516 | 0.00195764393867703 | 0.999021178030661 |
| 44 | 0.000905330223447613 | 0.00181066044689523 | 0.999094669776552 |
| 45 | 0.0021396916161114 | 0.0042793832322228 | 0.997860308383889 |
| 46 | 0.0152847857906694 | 0.0305695715813387 | 0.984715214209331 |
| 47 | 0.0127449038424398 | 0.0254898076848796 | 0.98725509615756 |
| 48 | 0.0201786699473924 | 0.0403573398947849 | 0.979821330052608 |
| 49 | 0.018397302041286 | 0.0367946040825719 | 0.981602697958714 |
| 50 | 0.0165706995153087 | 0.0331413990306174 | 0.983429300484691 |
| 51 | 0.0108745868203041 | 0.0217491736406083 | 0.989125413179696 |
| Meta Analysis of Goldfeld-Quandt test for Heteroskedasticity | |||
| Description | # significant tests | % significant tests | OK/NOK |
| 1% type I error level | 10 | 0.232558139534884 | NOK |
| 5% type I error level | 19 | 0.441860465116279 | NOK |
| 10% type I error level | 21 | 0.488372093023256 | NOK |