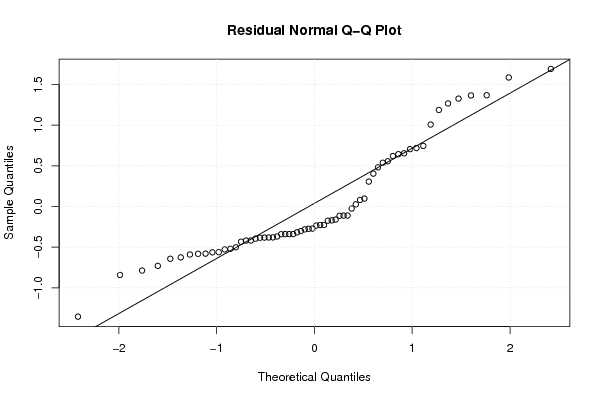
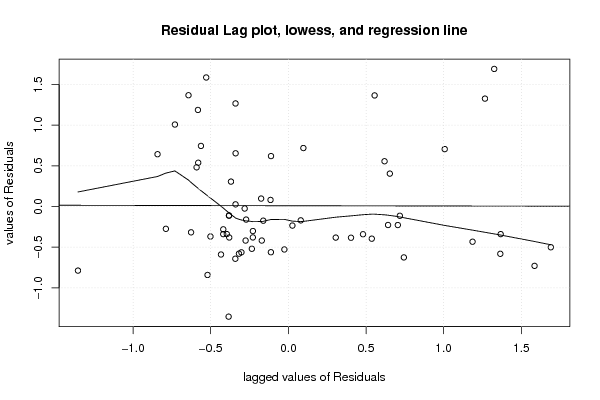
| Multiple Linear Regression - Estimated Regression Equation |
| Size[t] = -3.84773482013996 -0.166870138679476Month[t] + 1.00089326702236Income[t] + 0.139649962487581Change[t] -0.0629646215714582Complex[t] + 0.253597674207865Big4[t] -0.306206241804777Product[t] -0.00263243014859412t + e[t] |
| Multiple Linear Regression - Ordinary Least Squares | |||||
| Variable | Parameter | S.D. | T-STAT H0: parameter = 0 | 2-tail p-value | 1-tail p-value |
| (Intercept) | -3.84773482013996 | 3.028356 | -1.2706 | 0.209135 | 0.104568 |
| Month | -0.166870138679476 | 0.343715 | -0.4855 | 0.629223 | 0.314612 |
| Income | 1.00089326702236 | 0.03999 | 25.0288 | 0 | 0 |
| Change | 0.139649962487581 | 0.195672 | 0.7137 | 0.478381 | 0.239191 |
| Complex | -0.0629646215714582 | 0.059605 | -1.0564 | 0.29534 | 0.14767 |
| Big4 | 0.253597674207865 | 0.26238 | 0.9665 | 0.337935 | 0.168967 |
| Product | -0.306206241804777 | 0.201329 | -1.5209 | 0.133905 | 0.066953 |
| t | -0.00263243014859412 | 0.005902 | -0.446 | 0.657309 | 0.328654 |
| Multiple Linear Regression - Regression Statistics | |
| Multiple R | 0.982073422841079 |
| R-squared | 0.964468207850792 |
| Adjusted R-squared | 0.96002673383214 |
| F-TEST (value) | 217.150478377385 |
| F-TEST (DF numerator) | 7 |
| F-TEST (DF denominator) | 56 |
| p-value | 0 |
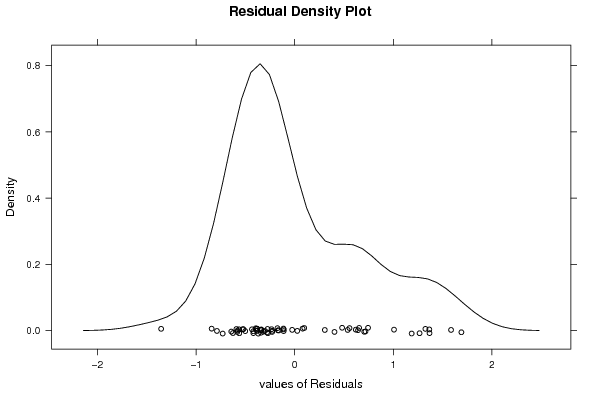
| Multiple Linear Regression - Residual Statistics | |
| Residual Standard Deviation | 0.711093443803142 |
| Sum Squared Residuals | 28.3166176059095 |
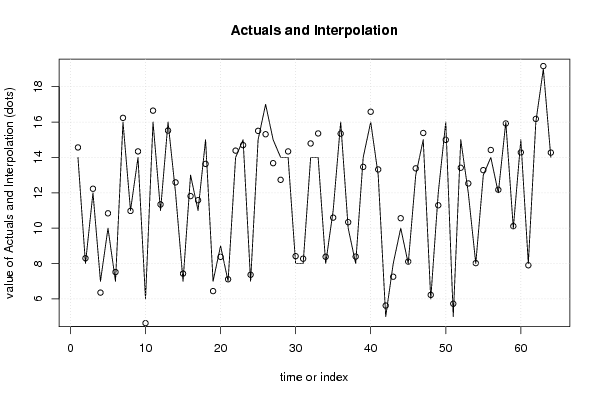
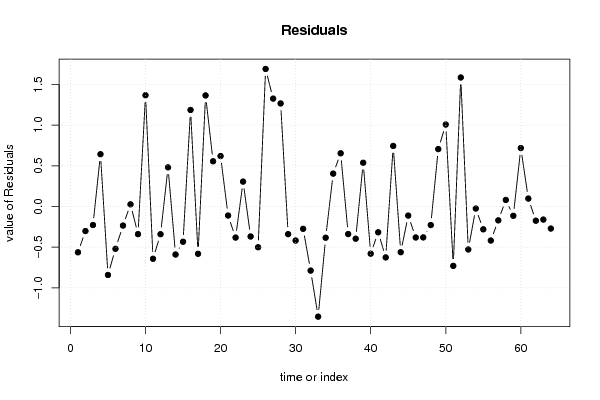
| Multiple Linear Regression - Actuals, Interpolation, and Residuals | |||
| Time or Index | Actuals | Interpolation Forecast | Residuals Prediction Error |
| 1 | 14 | 14.5638143722197 | -0.563814372219716 |
| 2 | 8 | 8.30222466572907 | -0.302224665729074 |
| 3 | 12 | 12.2282191506758 | -0.228219150675849 |
| 4 | 7 | 6.35813789295862 | 0.641862107041381 |
| 5 | 10 | 10.842197105996 | -0.842197105995997 |
| 6 | 7 | 7.52032257900099 | -0.520322579000991 |
| 7 | 16 | 16.2349832175156 | -0.234983217515583 |
| 8 | 11 | 10.9739497780378 | 0.0260502219622051 |
| 9 | 14 | 14.3401403469719 | -0.340140346971921 |
| 10 | 6 | 4.63304230048244 | 1.36695769951756 |
| 11 | 16 | 16.6428682625242 | -0.642868262524237 |
| 12 | 11 | 11.3415447868817 | -0.341544786881682 |
| 13 | 16 | 15.5193977581143 | 0.480602241885717 |
| 14 | 12 | 12.5907708678147 | -0.590770867814721 |
| 15 | 7 | 7.43366608609219 | -0.433666086092185 |
| 16 | 13 | 11.8141336413838 | 1.18586635861618 |
| 17 | 11 | 11.5819803103466 | -0.581980310346576 |
| 18 | 15 | 13.6354821697617 | 1.36451783023835 |
| 19 | 7 | 6.44458068387262 | 0.555419316127377 |
| 20 | 9 | 8.3807701661973 | 0.619229833802703 |
| 21 | 7 | 7.11166526339584 | -0.111665263395843 |
| 22 | 14 | 14.3826040959563 | -0.38260409595632 |
| 23 | 15 | 14.694794773665 | 0.305205226334983 |
| 24 | 7 | 7.36934717858056 | -0.369347178580558 |
| 25 | 15 | 15.5015293156758 | -0.501529315675817 |
| 26 | 17 | 15.3100030208128 | 1.68999697918715 |
| 27 | 15 | 13.6747549199958 | 1.32524508000424 |
| 28 | 14 | 12.7341938443963 | 1.26580615560374 |
| 29 | 14 | 14.340100311597 | -0.340100311596951 |
| 30 | 8 | 8.41914967420485 | -0.419149674204846 |
| 31 | 8 | 8.27512809364664 | -0.275128093646639 |
| 32 | 14 | 14.7884152794181 | -0.788415279418072 |
| 33 | 14 | 15.3545406313441 | -1.35454063134415 |
| 34 | 8 | 8.38454318029126 | -0.38454318029126 |
| 35 | 11 | 10.596667922221 | 0.403332077779024 |
| 36 | 16 | 15.3466433408984 | 0.653356659101634 |
| 37 | 10 | 10.339544575638 | -0.339544575637955 |
| 38 | 8 | 8.39635104509406 | -0.396351045094061 |
| 39 | 14 | 13.4628887595508 | 0.537111240449227 |
| 40 | 16 | 16.5802485075597 | -0.580248507559671 |
| 41 | 13 | 13.317973936766 | -0.317973936766004 |
| 42 | 5 | 5.62638314366591 | -0.626383143665915 |
| 43 | 8 | 7.25636638418581 | 0.743633615814189 |
| 44 | 10 | 10.5626199969091 | -0.562619996909083 |
| 45 | 8 | 8.1123448284234 | -0.112344828423405 |
| 46 | 13 | 13.3814971269392 | -0.381497126939156 |
| 47 | 15 | 15.3806512308353 | -0.380651230835289 |
| 48 | 6 | 6.22859024707581 | -0.228590247075813 |
| 49 | 12 | 11.2951279615325 | 0.704872038467475 |
| 50 | 16 | 14.9932270230387 | 1.00677297696128 |
| 51 | 5 | 5.73035970339352 | -0.730359703393516 |
| 52 | 15 | 13.4149464482744 | 1.58505355172562 |
| 53 | 12 | 12.5287331281938 | -0.528733128193831 |
| 54 | 8 | 8.0256883355146 | -0.0256883355146 |
| 55 | 13 | 13.2811199146857 | -0.281119914685687 |
| 56 | 14 | 14.419030714047 | -0.419030714047036 |
| 57 | 12 | 12.1710562702581 | -0.171056270258117 |
| 58 | 16 | 15.9201384219131 | 0.0798615780868567 |
| 59 | 10 | 10.1147609736894 | -0.114760973689409 |
| 60 | 15 | 14.2822578909475 | 0.717742109052536 |
| 61 | 8 | 7.90335580736642 | 0.0966441926335774 |
| 62 | 16 | 16.1751879069493 | -0.175187906949264 |
| 63 | 19 | 19.1615145585231 | -0.161514558523095 |
| 64 | 14 | 14.2717281703531 | -0.271728170353087 |
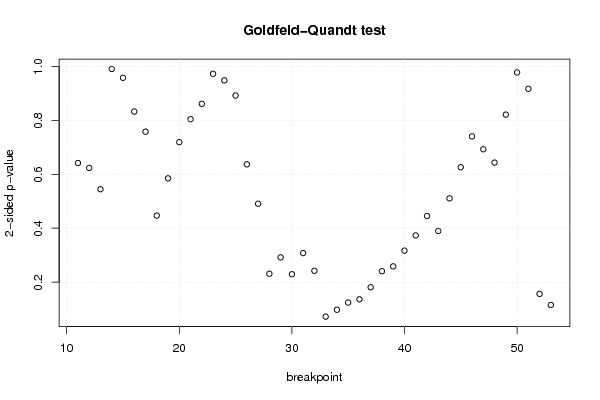
| Goldfeld-Quandt test for Heteroskedasticity | |||
| p-values | Alternative Hypothesis | ||
| breakpoint index | greater | 2-sided | less |
| 11 | 0.320854457732127 | 0.641708915464254 | 0.679145542267873 |
| 12 | 0.311756100741958 | 0.623512201483916 | 0.688243899258042 |
| 13 | 0.27236239058425 | 0.5447247811685 | 0.72763760941575 |
| 14 | 0.495301312729135 | 0.99060262545827 | 0.504698687270865 |
| 15 | 0.47890721409063 | 0.95781442818126 | 0.52109278590937 |
| 16 | 0.583677054431604 | 0.832645891136793 | 0.416322945568396 |
| 17 | 0.62098317261871 | 0.75803365476258 | 0.37901682738129 |
| 18 | 0.776579116888542 | 0.446841766222916 | 0.223420883111458 |
| 19 | 0.707536687913102 | 0.584926624173797 | 0.292463312086898 |
| 20 | 0.640425037997229 | 0.719149924005543 | 0.359574962002771 |
| 21 | 0.5979126497889 | 0.804174700422199 | 0.4020873502111 |
| 22 | 0.569376898757035 | 0.86124620248593 | 0.430623101242965 |
| 23 | 0.486299192329629 | 0.972598384659258 | 0.513700807670371 |
| 24 | 0.474134355110177 | 0.948268710220355 | 0.525865644889823 |
| 25 | 0.446028583536532 | 0.892057167073065 | 0.553971416463468 |
| 26 | 0.681510568772797 | 0.636978862454406 | 0.318489431227203 |
| 27 | 0.754508688121667 | 0.490982623756667 | 0.245491311878333 |
| 28 | 0.884329152301526 | 0.231341695396948 | 0.115670847698474 |
| 29 | 0.854013758819921 | 0.291972482360158 | 0.145986241180079 |
| 30 | 0.885280415452552 | 0.229439169094896 | 0.114719584547448 |
| 31 | 0.846068881660534 | 0.307862236678933 | 0.153931118339466 |
| 32 | 0.878885412175767 | 0.242229175648465 | 0.121114587824233 |
| 33 | 0.963914908548106 | 0.072170182903788 | 0.036085091451894 |
| 34 | 0.951093951638197 | 0.0978120967236055 | 0.0489060483618028 |
| 35 | 0.937801745905823 | 0.124396508188353 | 0.0621982540941766 |
| 36 | 0.931713888187095 | 0.13657222362581 | 0.068286111812905 |
| 37 | 0.90942820617092 | 0.18114358765816 | 0.0905717938290799 |
| 38 | 0.879676890180312 | 0.240646219639376 | 0.120323109819688 |
| 39 | 0.870668754770176 | 0.258662490459648 | 0.129331245229824 |
| 40 | 0.841547990146326 | 0.316904019707349 | 0.158452009853674 |
| 41 | 0.813372825621935 | 0.373254348756129 | 0.186627174378065 |
| 42 | 0.77729031778421 | 0.445419364431579 | 0.22270968221579 |
| 43 | 0.80503878959837 | 0.389922420803261 | 0.19496121040163 |
| 44 | 0.744564537707937 | 0.510870924584126 | 0.255435462292063 |
| 45 | 0.686939214028331 | 0.626121571943339 | 0.313060785971669 |
| 46 | 0.629717881748214 | 0.740564236503573 | 0.370282118251786 |
| 47 | 0.653565874192178 | 0.692868251615643 | 0.346434125807822 |
| 48 | 0.678360755822488 | 0.643278488355024 | 0.321639244177512 |
| 49 | 0.589326242343743 | 0.821347515312515 | 0.410673757656257 |
| 50 | 0.511170075550197 | 0.977659848899606 | 0.488829924449803 |
| 51 | 0.458561715831659 | 0.917123431663318 | 0.541438284168341 |
| 52 | 0.921701281940375 | 0.15659743611925 | 0.078298718059625 |
| 53 | 0.94227999089755 | 0.115440018204901 | 0.0577200091024506 |
| Meta Analysis of Goldfeld-Quandt test for Heteroskedasticity | |||
| Description | # significant tests | % significant tests | OK/NOK |
| 1% type I error level | 0 | 0 | OK |
| 5% type I error level | 0 | 0 | OK |
| 10% type I error level | 2 | 0.0465116279069767 | OK |