| Multiple Linear Regression - Estimated Regression Equation |
| Income[t] = + 5.97386995948922 -0.226789724375297Change[t] + 0.919863609515728Size[t] + 0.11669319227812Complex[t] + 0.107922912000111Big4[t] + 0.38889288282041Product[t] + e[t] |
| Multiple Linear Regression - Ordinary Least Squares | |||||
| Variable | Parameter | S.D. | T-STAT H0: parameter = 0 | 2-tail p-value | 1-tail p-value |
| (Intercept) | 5.97386995948922 | 0.337444 | 17.7033 | 0 | 0 |
| Change | -0.226789724375297 | 0.176982 | -1.2814 | 0.205143 | 0.102571 |
| Size | 0.919863609515728 | 0.036326 | 25.3226 | 0 | 0 |
| Complex | 0.11669319227812 | 0.055002 | 2.1216 | 0.038152 | 0.019076 |
| Big4 | 0.107922912000111 | 0.251028 | 0.4299 | 0.668844 | 0.334422 |
| Product | 0.38889288282041 | 0.187605 | 2.0729 | 0.042631 | 0.021316 |
| Multiple Linear Regression - Regression Statistics | |
| Multiple R | 0.982641681321665 |
| R-squared | 0.965584673870669 |
| Adjusted R-squared | 0.962617835411244 |
| F-TEST (value) | 325.459133375859 |
| F-TEST (DF numerator) | 5 |
| F-TEST (DF denominator) | 58 |
| p-value | 0 |
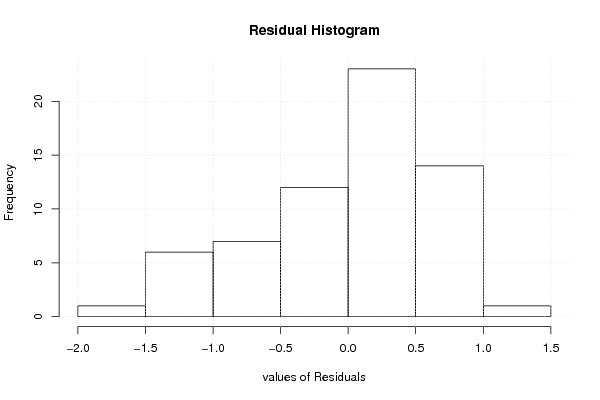
| Multiple Linear Regression - Residual Statistics | |
| Residual Standard Deviation | 0.67670637370448 |
| Sum Squared Residuals | 26.5600279403115 |
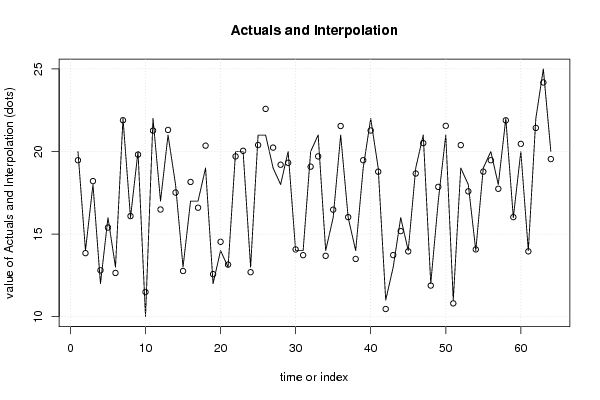
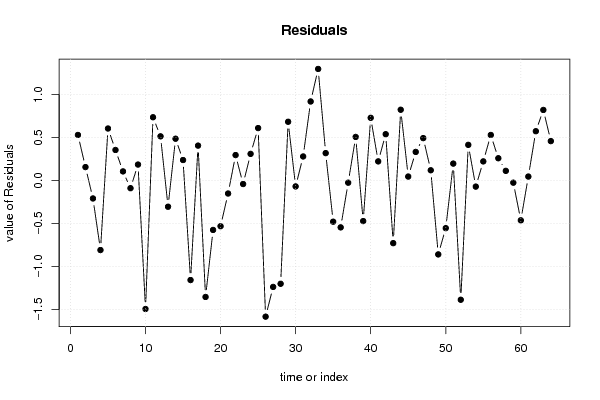
| Multiple Linear Regression - Actuals, Interpolation, and Residuals | |||
| Time or Index | Actuals | Interpolation Forecast | Residuals Prediction Error |
| 1 | 20 | 19.472066139989 | 0.527933860011005 |
| 2 | 14 | 13.8449615708945 | 0.155038429105482 |
| 3 | 18 | 18.2092082221672 | -0.2092082221672 |
| 4 | 12 | 12.8084047691007 | -0.80840476910067 |
| 5 | 16 | 15.3971221589247 | 0.602877841075269 |
| 6 | 13 | 12.6463016106556 | 0.353698389344443 |
| 7 | 22 | 21.8952593204111 | 0.104740679588946 |
| 8 | 16 | 16.0901960440652 | -0.0901960440651619 |
| 9 | 20 | 19.8155490566424 | 0.184450943357586 |
| 10 | 10 | 11.4930516165836 | -1.49305161658359 |
| 11 | 22 | 21.2663833928535 | 0.733616607146541 |
| 12 | 17 | 16.4878592071636 | 0.512140792836418 |
| 13 | 21 | 21.3051966988395 | -0.305196698839508 |
| 14 | 18 | 17.5156457286794 | 0.484354271320579 |
| 15 | 13 | 12.7629948029337 | 0.237005197066323 |
| 16 | 17 | 18.1567129874719 | -1.15671298747191 |
| 17 | 17 | 16.5957821191637 | 0.404217880836307 |
| 18 | 19 | 20.3531164435187 | -1.35311644351868 |
| 19 | 12 | 12.5750183845444 | -0.575018384544429 |
| 20 | 14 | 14.531438795854 | -0.531438795854006 |
| 21 | 13 | 13.1518876857541 | -0.151887685754087 |
| 22 | 20 | 19.7054525245452 | 0.294547475454762 |
| 23 | 20 | 20.0418501726704 | -0.0418501726703632 |
| 24 | 13 | 12.6917115768225 | 0.308288423177451 |
| 25 | 21 | 20.3919297495047 | 0.608070250495275 |
| 26 | 21 | 22.5817365453705 | -1.58173654537054 |
| 27 | 19 | 20.2364232512406 | -1.23642325124056 |
| 28 | 18 | 19.1998664494467 | -1.19986644944671 |
| 29 | 20 | 19.3187332618219 | 0.681266738178107 |
| 30 | 14 | 14.0695776751728 | -0.0695776751727499 |
| 31 | 14 | 13.7216717184355 | 0.278328281564546 |
| 32 | 20 | 19.0831732571686 | 0.916826742831413 |
| 33 | 21 | 19.7054525245452 | 1.29454747545476 |
| 34 | 14 | 13.6828584124494 | 0.317141587550595 |
| 35 | 16 | 16.4790889268856 | -0.479088926885572 |
| 36 | 21 | 21.5451797435767 | -0.545179743576693 |
| 37 | 16 | 16.0259980864823 | -0.0259980864823262 |
| 38 | 14 | 13.4948819940602 | 0.505118005939843 |
| 39 | 19 | 19.472066139989 | -0.472066139988997 |
| 40 | 22 | 21.2729800530344 | 0.727019946965597 |
| 41 | 19 | 18.7789922548486 | 0.221007745151434 |
| 42 | 11 | 10.4630914749707 | 0.536908525029316 |
| 43 | 13 | 13.7282683786164 | -0.728268378616398 |
| 44 | 16 | 15.1791027148274 | 0.820897285172556 |
| 45 | 14 | 13.9550581029917 | 0.0449418970083054 |
| 46 | 19 | 18.6688957227514 | 0.331104277248611 |
| 47 | 21 | 20.5086229417828 | 0.491377058217155 |
| 48 | 12 | 11.881944499404 | 0.118055500596002 |
| 49 | 17 | 17.8591286453328 | -0.859128645332838 |
| 50 | 21 | 21.5539500238547 | -0.553950023854703 |
| 51 | 11 | 10.804400771527 | 0.195599228472965 |
| 52 | 19 | 20.3853330893238 | -1.38533308932378 |
| 53 | 18 | 17.5869289547905 | 0.413071045209452 |
| 54 | 14 | 14.0717512952698 | -0.0717512952698151 |
| 55 | 19 | 18.7789922548486 | 0.221007745151434 |
| 56 | 20 | 19.472066139989 | 0.527933860011003 |
| 57 | 18 | 17.7424354530547 | 0.257564546945283 |
| 58 | 22 | 21.8886626602301 | 0.11133733976989 |
| 59 | 16 | 16.0259980864823 | -0.0259980864823262 |
| 60 | 20 | 20.4632129756159 | -0.463212975615852 |
| 61 | 14 | 13.9550581029917 | 0.0449418970083054 |
| 62 | 22 | 21.4284865512986 | 0.571513448701428 |
| 63 | 25 | 24.1814807196648 | 0.818519280335188 |
| 64 | 20 | 19.5433493661001 | 0.456650633899876 |
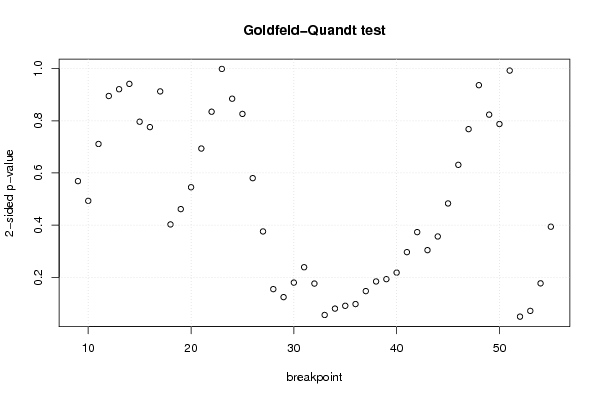
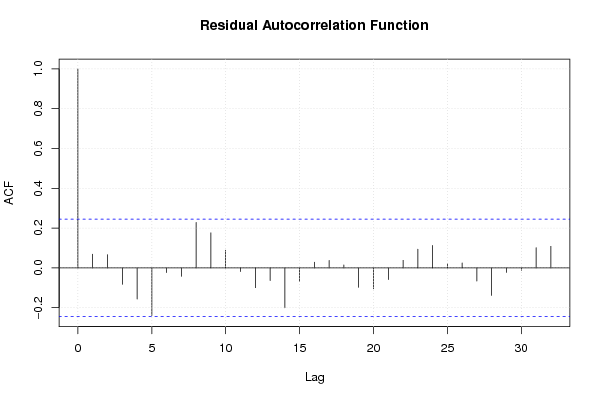
| Goldfeld-Quandt test for Heteroskedasticity | |||
| p-values | Alternative Hypothesis | ||
| breakpoint index | greater | 2-sided | less |
| 9 | 0.28440244054491 | 0.56880488108982 | 0.71559755945509 |
| 10 | 0.753412990412012 | 0.493174019175975 | 0.246587009587987 |
| 11 | 0.644438303852589 | 0.711123392294822 | 0.355561696147411 |
| 12 | 0.552469886883851 | 0.895060226232298 | 0.447530113116149 |
| 13 | 0.53946890411015 | 0.9210621917797 | 0.46053109588985 |
| 14 | 0.470715726932231 | 0.941431453864463 | 0.529284273067769 |
| 15 | 0.39822243549196 | 0.796444870983921 | 0.60177756450804 |
| 16 | 0.612088746838352 | 0.775822506323296 | 0.387911253161648 |
| 17 | 0.543689035154065 | 0.912621929691869 | 0.456310964845935 |
| 18 | 0.798576185496572 | 0.402847629006857 | 0.201423814503428 |
| 19 | 0.769255272079587 | 0.461489455840826 | 0.230744727920413 |
| 20 | 0.72734111672575 | 0.545317766548499 | 0.27265888327425 |
| 21 | 0.653176933562192 | 0.693646132875615 | 0.346823066437808 |
| 22 | 0.58262264369772 | 0.83475471260456 | 0.41737735630228 |
| 23 | 0.4993549411126 | 0.9987098822252 | 0.5006450588874 |
| 24 | 0.442300415720574 | 0.884600831441149 | 0.557699584279426 |
| 25 | 0.413192911708007 | 0.826385823416013 | 0.586807088291993 |
| 26 | 0.709915651411709 | 0.580168697176583 | 0.290084348588291 |
| 27 | 0.812052255883328 | 0.375895488233343 | 0.187947744116672 |
| 28 | 0.922583652235731 | 0.154832695528537 | 0.0774163477642685 |
| 29 | 0.937899138829067 | 0.124201722341866 | 0.0621008611709332 |
| 30 | 0.91007505515505 | 0.179849889689899 | 0.0899249448449495 |
| 31 | 0.880615609080403 | 0.238768781839194 | 0.119384390919597 |
| 32 | 0.911944834321665 | 0.17611033135667 | 0.0880551656783348 |
| 33 | 0.972136971486087 | 0.0557260570278268 | 0.0278630285139134 |
| 34 | 0.959877011292961 | 0.0802459774140783 | 0.0401229887070391 |
| 35 | 0.954521671408337 | 0.0909566571833269 | 0.0454783285916634 |
| 36 | 0.951221315497037 | 0.097557369005925 | 0.0487786845029625 |
| 37 | 0.926368328251513 | 0.147263343496974 | 0.0736316717484872 |
| 38 | 0.907889918252027 | 0.184220163495946 | 0.0921100817479728 |
| 39 | 0.903471932348332 | 0.193056135303336 | 0.0965280676516681 |
| 40 | 0.890931611643224 | 0.218136776713553 | 0.109068388356776 |
| 41 | 0.851696418939327 | 0.296607162121347 | 0.148303581060673 |
| 42 | 0.813318249862994 | 0.373363500274012 | 0.186681750137006 |
| 43 | 0.847873958795691 | 0.304252082408618 | 0.152126041204309 |
| 44 | 0.821681850907665 | 0.35663629818467 | 0.178318149092335 |
| 45 | 0.758390994233259 | 0.483218011533483 | 0.241609005766741 |
| 46 | 0.684405749412014 | 0.631188501175973 | 0.315594250587986 |
| 47 | 0.616016605146296 | 0.767966789707409 | 0.383983394853704 |
| 48 | 0.531754546717999 | 0.936490906564002 | 0.468245453282001 |
| 49 | 0.588217273205814 | 0.823565453588373 | 0.411782726794186 |
| 50 | 0.606201672807957 | 0.787596654384085 | 0.393798327192043 |
| 51 | 0.496211018425592 | 0.992422036851185 | 0.503788981574408 |
| 52 | 0.975333246732689 | 0.0493335065346223 | 0.0246667532673111 |
| 53 | 0.96426431772113 | 0.0714713645577409 | 0.0357356822788705 |
| 54 | 0.911474431678006 | 0.177051136643988 | 0.088525568321994 |
| 55 | 0.803008614250184 | 0.393982771499631 | 0.196991385749816 |
| Meta Analysis of Goldfeld-Quandt test for Heteroskedasticity | |||
| Description | # significant tests | % significant tests | OK/NOK |
| 1% type I error level | 0 | 0 | OK |
| 5% type I error level | 1 | 0.0212765957446809 | OK |
| 10% type I error level | 6 | 0.127659574468085 | NOK |