| Multiple Linear Regression - Estimated Regression Equation |
| CompendiumView_PR[t] = + 34.7563686972627 -8.3254094432073Month[t] + 0.115491633209934Pageviews[t] -0.10762510103407CourseCompView[t] -0.0162168746513392t + e[t] |
| Multiple Linear Regression - Ordinary Least Squares | |||||
| Variable | Parameter | S.D. | T-STAT H0: parameter = 0 | 2-tail p-value | 1-tail p-value |
| (Intercept) | 34.7563686972627 | 105.813555 | 0.3285 | 0.743805 | 0.371903 |
| Month | -8.3254094432073 | 10.770705 | -0.773 | 0.442851 | 0.221425 |
| Pageviews | 0.115491633209934 | 0.04372 | 2.6416 | 0.010722 | 0.005361 |
| CourseCompView | -0.10762510103407 | 0.099897 | -1.0774 | 0.28602 | 0.14301 |
| t | -0.0162168746513392 | 0.468184 | -0.0346 | 0.972494 | 0.486247 |
| Multiple Linear Regression - Regression Statistics | |
| Multiple R | 0.614530244597476 |
| R-squared | 0.377647421525034 |
| Adjusted R-squared | 0.332385415817763 |
| F-TEST (value) | 8.34358565476415 |
| F-TEST (DF numerator) | 4 |
| F-TEST (DF denominator) | 55 |
| p-value | 2.4680172920899e-05 |
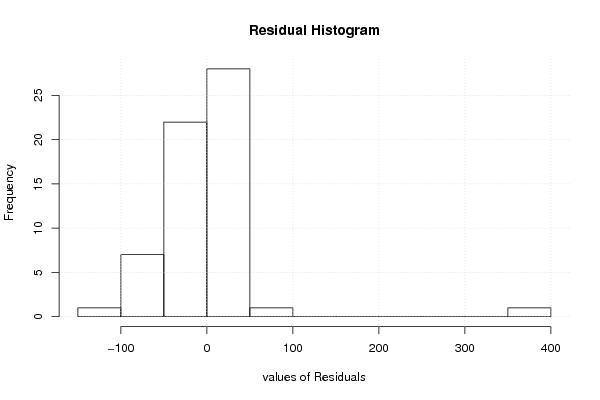
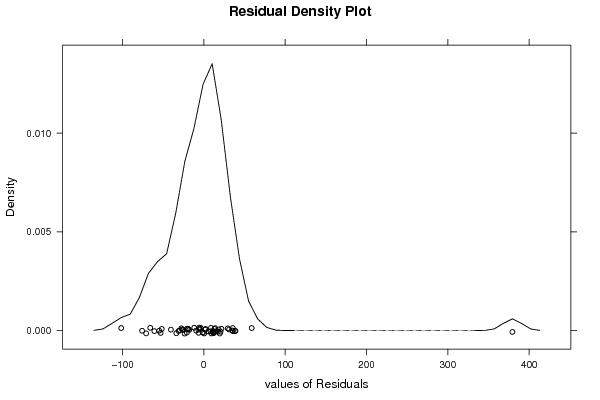
| Multiple Linear Regression - Residual Statistics | |
| Residual Standard Deviation | 61.3193068243675 |
| Sum Squared Residuals | 206803.156418151 |
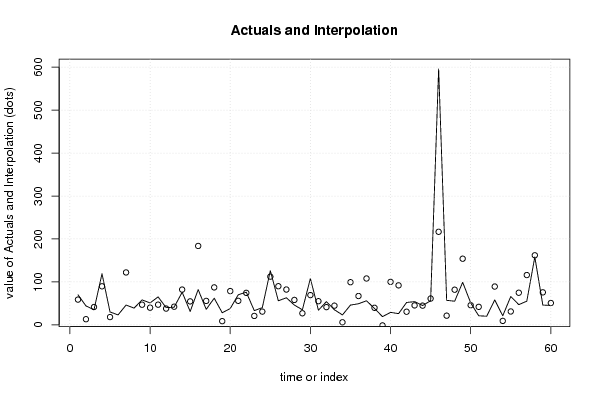
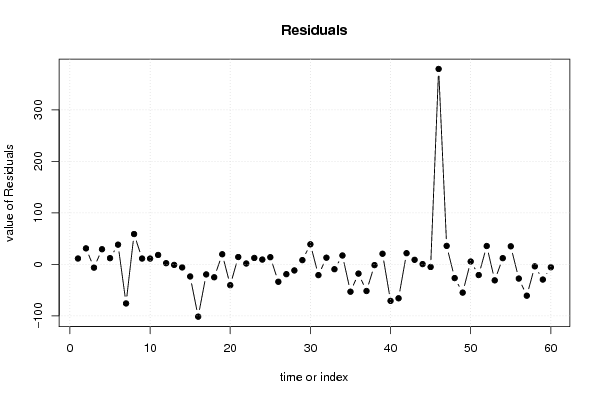
| Multiple Linear Regression - Actuals, Interpolation, and Residuals | |||
| Time or Index | Actuals | Interpolation Forecast | Residuals Prediction Error |
| 1 | 70 | 58.7510441453938 | 11.2489558546062 |
| 2 | 44 | 13.0587550459429 | 30.9412449540571 |
| 3 | 35 | 41.4628103708641 | -6.46281037086409 |
| 4 | 119 | 89.7443798011116 | 29.2556201988884 |
| 5 | 30 | 18.0316578591389 | 11.9683421408611 |
| 6 | 23 | -15.1431894939038 | 38.1431894939038 |
| 7 | 46 | 121.967687893018 | -75.9676878930184 |
| 8 | 39 | -19.7606075800687 | 58.7606075800687 |
| 9 | 58 | 46.8108263915476 | 11.1891736084524 |
| 10 | 51 | 39.8768743414711 | 11.1231256585289 |
| 11 | 65 | 46.8817135578265 | 18.1182864421735 |
| 12 | 40 | 37.8453125134436 | 2.15468748655635 |
| 13 | 41 | 42.1505745832358 | -1.15057458323583 |
| 14 | 76 | 82.0215791062885 | -6.02157910628848 |
| 15 | 31 | 54.6073177688496 | -23.6073177688496 |
| 16 | 82 | 183.64226836885 | -101.64226836885 |
| 17 | 36 | 55.6429345594401 | -19.6429345594401 |
| 18 | 62 | 87.1720880615301 | -25.1720880615301 |
| 19 | 28 | 8.47057217846351 | 19.5294278215365 |
| 20 | 38 | 78.5592405599951 | -40.5592405599951 |
| 21 | 70 | 55.8648245658893 | 14.1351754341107 |
| 22 | 76 | 74.4321142347275 | 1.56788576527252 |
| 23 | 33 | 20.6710428215068 | 12.3289571784932 |
| 24 | 40 | 30.8020091210862 | 9.1979908789138 |
| 25 | 126 | 112.205730202166 | 13.7942697978344 |
| 26 | 56 | 89.896018900328 | -33.896018900328 |
| 27 | 63 | 82.1708223798865 | -19.1708223798865 |
| 28 | 46 | 57.9195279827429 | -11.9195279827429 |
| 29 | 35 | 26.8700342527507 | 8.1299657472493 |
| 30 | 108 | 69.1670580409955 | 38.8329419590045 |
| 31 | 34 | 54.9929305040893 | -20.9929305040893 |
| 32 | 54 | 41.1534275418361 | 12.8465724581639 |
| 33 | 35 | 44.5615845509282 | -9.5615845509282 |
| 34 | 23 | 5.9020737227945 | 17.0979262772055 |
| 35 | 46 | 99.2214838199215 | -53.2214838199215 |
| 36 | 49 | 67.0631565370241 | -18.0631565370241 |
| 37 | 56 | 107.857338741407 | -51.8573387414071 |
| 38 | 38 | 39.5912003441383 | -1.59120034413831 |
| 39 | 19 | -1.47535473076385 | 20.4753547307639 |
| 40 | 29 | 100.020695666012 | -71.0206956660125 |
| 41 | 26 | 91.9490982081269 | -65.9490982081269 |
| 42 | 52 | 30.4407704855321 | 21.5592295144679 |
| 43 | 54 | 45.2546818548075 | 8.74531814519248 |
| 44 | 45 | 44.6280767876503 | 0.371923212349721 |
| 45 | 56 | 61.1759140606334 | -5.1759140606334 |
| 46 | 596 | 216.677716985544 | 379.322283014456 |
| 47 | 57 | 21.2451171020536 | 35.7548828979464 |
| 48 | 55 | 81.7479799271606 | -26.7479799271606 |
| 49 | 99 | 153.96529075676 | -54.9652907567602 |
| 50 | 51 | 45.6156891034683 | 5.38431089653168 |
| 51 | 21 | 41.8321587009269 | -20.8321587009269 |
| 52 | 20 | -15.5194251699797 | 35.5194251699797 |
| 53 | 58 | 89.1467033149188 | -31.1467033149188 |
| 54 | 21 | 9.10793737852084 | 11.8920626214792 |
| 55 | 66 | 31.0573404747176 | 34.9426595252824 |
| 56 | 47 | 74.7052353860547 | -27.7052353860547 |
| 57 | 55 | 115.920921502917 | -60.920921502917 |
| 58 | 158 | 161.954821596404 | -3.95482159640352 |
| 59 | 46 | 75.6248631875156 | -29.6248631875156 |
| 60 | 45 | 50.787549124363 | -5.78754912436297 |
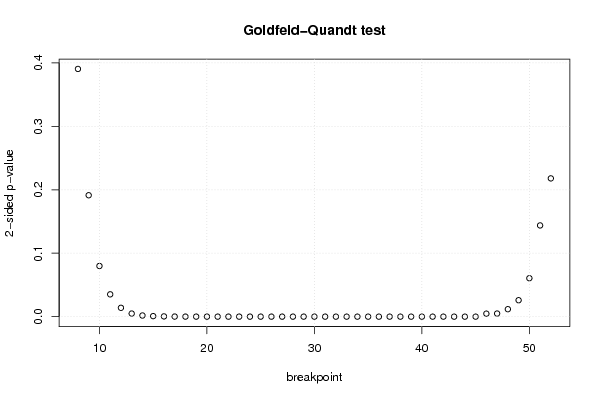
| Goldfeld-Quandt test for Heteroskedasticity | |||
| p-values | Alternative Hypothesis | ||
| breakpoint index | greater | 2-sided | less |
| 8 | 0.195253692978476 | 0.390507385956952 | 0.804746307021524 |
| 9 | 0.0956925446329858 | 0.191385089265972 | 0.904307455367014 |
| 10 | 0.0399358979863081 | 0.0798717959726162 | 0.960064102013692 |
| 11 | 0.0175937051708011 | 0.0351874103416021 | 0.982406294829199 |
| 12 | 0.00696387416323632 | 0.0139277483264726 | 0.993036125836764 |
| 13 | 0.00243644740909563 | 0.00487289481819125 | 0.997563552590904 |
| 14 | 0.000899414560706047 | 0.00179882912141209 | 0.999100585439294 |
| 15 | 0.000404748474194649 | 0.000809496948389299 | 0.999595251525805 |
| 16 | 0.000193011646603765 | 0.00038602329320753 | 0.999806988353396 |
| 17 | 6.07562071830935e-05 | 0.000121512414366187 | 0.999939243792817 |
| 18 | 1.98272134729486e-05 | 3.96544269458972e-05 | 0.999980172786527 |
| 19 | 5.71254771212398e-06 | 1.1425095424248e-05 | 0.999994287452288 |
| 20 | 1.73419806492214e-06 | 3.46839612984429e-06 | 0.999998265801935 |
| 21 | 1.30143205348257e-06 | 2.60286410696515e-06 | 0.999998698567947 |
| 22 | 5.74390784313842e-07 | 1.14878156862768e-06 | 0.999999425609216 |
| 23 | 1.59077635993506e-07 | 3.18155271987013e-07 | 0.999999840922364 |
| 24 | 4.3766006013841e-08 | 8.75320120276819e-08 | 0.999999956233994 |
| 25 | 2.39794312846884e-07 | 4.79588625693767e-07 | 0.999999760205687 |
| 26 | 8.18177187384656e-08 | 1.63635437476931e-07 | 0.999999918182281 |
| 27 | 2.32103771752035e-08 | 4.6420754350407e-08 | 0.999999976789623 |
| 28 | 6.10166948313766e-09 | 1.22033389662753e-08 | 0.99999999389833 |
| 29 | 1.68218467049228e-09 | 3.36436934098455e-09 | 0.999999998317815 |
| 30 | 4.74134585383232e-09 | 9.48269170766463e-09 | 0.999999995258654 |
| 31 | 1.86606459278741e-09 | 3.73212918557481e-09 | 0.999999998133935 |
| 32 | 5.2132105797124e-10 | 1.04264211594248e-09 | 0.999999999478679 |
| 33 | 1.53281119719448e-10 | 3.06562239438897e-10 | 0.999999999846719 |
| 34 | 6.48199408447539e-11 | 1.29639881689508e-10 | 0.99999999993518 |
| 35 | 4.26234811587951e-11 | 8.52469623175903e-11 | 0.999999999957377 |
| 36 | 1.08762992038575e-11 | 2.1752598407715e-11 | 0.999999999989124 |
| 37 | 5.28873298027e-12 | 1.057746596054e-11 | 0.999999999994711 |
| 38 | 1.15713978454559e-12 | 2.31427956909118e-12 | 0.999999999998843 |
| 39 | 3.11659075098695e-13 | 6.2331815019739e-13 | 0.999999999999688 |
| 40 | 7.75923602446012e-13 | 1.55184720489202e-12 | 0.999999999999224 |
| 41 | 2.57372532904296e-11 | 5.14745065808591e-11 | 0.999999999974263 |
| 42 | 9.75255238901565e-12 | 1.95051047780313e-11 | 0.999999999990247 |
| 43 | 3.79578960092086e-12 | 7.59157920184172e-12 | 0.999999999996204 |
| 44 | 1.14336145582363e-12 | 2.28672291164725e-12 | 0.999999999998857 |
| 45 | 4.46162561898203e-10 | 8.92325123796405e-10 | 0.999999999553837 |
| 46 | 0.997642789038554 | 0.00471442192289225 | 0.00235721096144612 |
| 47 | 0.997555194283708 | 0.00488961143258415 | 0.00244480571629207 |
| 48 | 0.994127205225723 | 0.011745589548554 | 0.00587279477427702 |
| 49 | 0.987057691822091 | 0.0258846163558177 | 0.0129423081779089 |
| 50 | 0.969700682625493 | 0.060598634749013 | 0.0302993173745065 |
| 51 | 0.928088275769295 | 0.14382344846141 | 0.071911724230705 |
| 52 | 0.891013378385105 | 0.21797324322979 | 0.108986621614895 |
| Meta Analysis of Goldfeld-Quandt test for Heteroskedasticity | |||
| Description | # significant tests | % significant tests | OK/NOK |
| 1% type I error level | 35 | 0.777777777777778 | NOK |
| 5% type I error level | 39 | 0.866666666666667 | NOK |
| 10% type I error level | 41 | 0.911111111111111 | NOK |