| Multiple Linear Regression - Estimated Regression Equation |
| Income[t] = + 5.85983560324739 -0.193750237489209Change[t] + 0.918765989349365Size[t] + 0.111643647631725Complex[t] + 0.0987641837552761Big4[t] + 0.363757783598691Product[t] + 0.00450198364339269t + e[t] |
| Multiple Linear Regression - Ordinary Least Squares | |||||
| Variable | Parameter | S.D. | T-STAT H0: parameter = 0 | 2-tail p-value | 1-tail p-value |
| (Intercept) | 5.85983560324739 | 0.358551 | 16.3431 | 0 | 0 |
| Change | -0.193750237489209 | 0.180539 | -1.0732 | 0.287714 | 0.143857 |
| Size | 0.918765989349365 | 0.036376 | 25.2572 | 0 | 0 |
| Complex | 0.111643647631725 | 0.055308 | 2.0186 | 0.048243 | 0.024122 |
| Big4 | 0.0987641837552761 | 0.251436 | 0.3928 | 0.695932 | 0.347966 |
| Product | 0.363757783598691 | 0.189636 | 1.9182 | 0.060101 | 0.030051 |
| t | 0.00450198364339269 | 0.004752 | 0.9474 | 0.347449 | 0.173725 |
| Multiple Linear Regression - Regression Statistics | |
| Multiple R | 0.982913104345197 |
| R-squared | 0.966118170693513 |
| Adjusted R-squared | 0.962551662345462 |
| F-TEST (value) | 270.886277673063 |
| F-TEST (DF numerator) | 6 |
| F-TEST (DF denominator) | 57 |
| p-value | 0 |
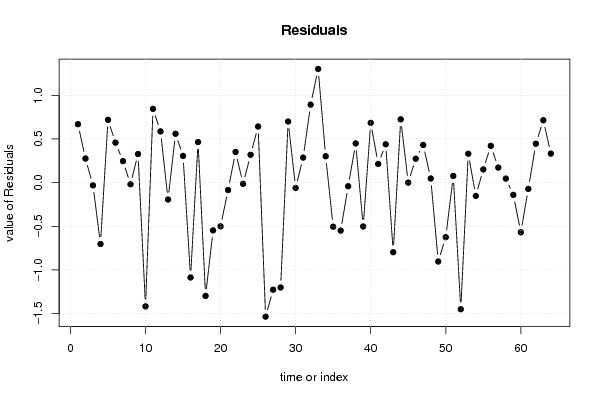
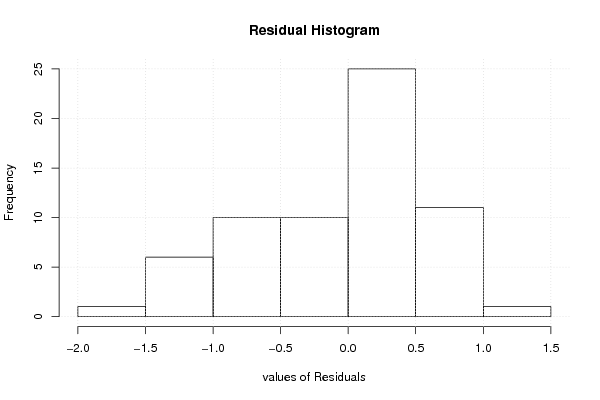
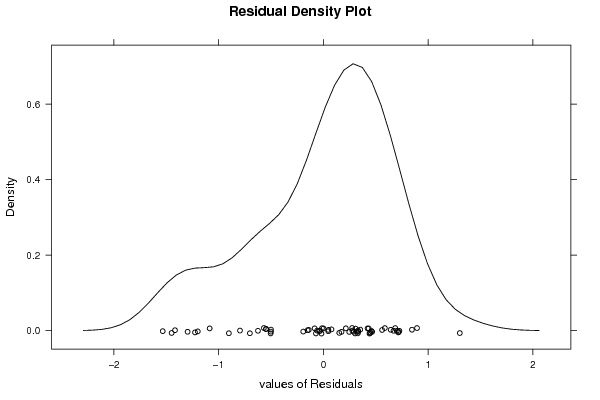
| Multiple Linear Regression - Residual Statistics | |
| Residual Standard Deviation | 0.677305054069505 |
| Sum Squared Residuals | 26.1483017672814 |
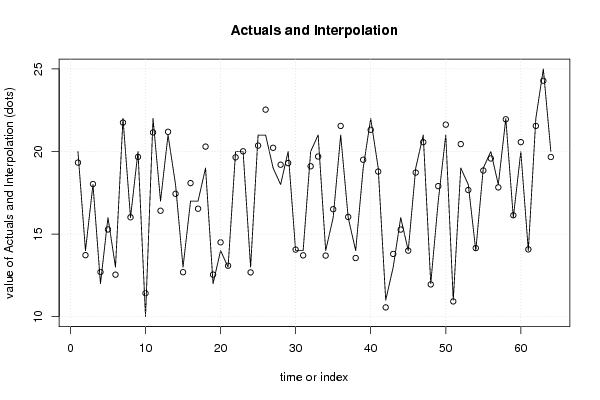
| Multiple Linear Regression - Actuals, Interpolation, and Residuals | |||
| Time or Index | Actuals | Interpolation Forecast | Residuals Prediction Error |
| 1 | 20 | 19.3307641105418 | 0.66923588945817 |
| 2 | 14 | 13.7239059743338 | 0.276094025666245 |
| 3 | 18 | 18.0309172795143 | -0.030917279514271 |
| 4 | 12 | 12.7025003046395 | -0.70250030463945 |
| 5 | 16 | 15.280413246345 | 0.719586753654991 |
| 6 | 13 | 12.5414967258168 | 0.458503274183246 |
| 7 | 22 | 21.7535262292595 | 0.246473770740457 |
| 8 | 16 | 16.0189349491353 | -0.0189349491353428 |
| 9 | 20 | 19.6721738648099 | 0.327826135190093 |
| 10 | 10 | 11.4174513757775 | -1.41745137577751 |
| 11 | 22 | 21.1549520271967 | 0.845047972803269 |
| 12 | 17 | 16.4135801311841 | 0.586419868815946 |
| 13 | 21 | 21.192782835187 | -0.192782835187032 |
| 14 | 18 | 17.4401142715755 | 0.55988572842452 |
| 15 | 13 | 12.693658226239 | 0.306341773760986 |
| 16 | 17 | 18.0862330344704 | -1.08623303447042 |
| 17 | 17 | 16.5348542331563 | 0.465145766843707 |
| 18 | 19 | 20.2972369811254 | -1.29723698112536 |
| 19 | 12 | 12.5467427640269 | -0.54674276402689 |
| 20 | 14 | 14.5004203740007 | -0.50042037400074 |
| 21 | 13 | 13.0844279116981 | -0.0844279116980607 |
| 22 | 20 | 19.6485930623165 | 0.351406937683472 |
| 23 | 20 | 20.0136427971507 | -0.0136427971506601 |
| 24 | 13 | 12.6808963298756 | 0.319103670124421 |
| 25 | 21 | 20.3575777073326 | 0.642422292667379 |
| 26 | 21 | 22.5345426125699 | -1.53454261256992 |
| 27 | 19 | 20.2261111862842 | -1.22611118628417 |
| 28 | 18 | 19.2002035329465 | -1.20020353294647 |
| 29 | 20 | 19.2996915703238 | 0.700308429676206 |
| 30 | 14 | 14.0603693477358 | -0.0603693477357527 |
| 31 | 14 | 13.7132827945862 | 0.286717205413823 |
| 32 | 20 | 19.1065678198883 | 0.893432180111686 |
| 33 | 21 | 19.6981148823938 | 1.30188511760615 |
| 34 | 14 | 13.6979619048128 | 0.30203809518716 |
| 35 | 16 | 16.5042462911056 | -0.504246291105636 |
| 36 | 21 | 21.5491528120228 | -0.549152812022756 |
| 37 | 16 | 16.04105885957 | -0.0410588595699574 |
| 38 | 14 | 13.5510464426007 | 0.448953557399283 |
| 39 | 19 | 19.5018394889908 | -0.501839488990754 |
| 40 | 22 | 21.3150466106294 | 0.68495338937064 |
| 41 | 19 | 18.7858277044174 | 0.214172295582617 |
| 42 | 11 | 10.5606422731592 | 0.439357726840774 |
| 43 | 13 | 13.7968436560811 | -0.796843656081131 |
| 44 | 16 | 15.2751198348246 | 0.724880165175436 |
| 45 | 14 | 13.9995978608571 | 0.000402139142874625 |
| 46 | 19 | 18.7262310327769 | 0.273768967223138 |
| 47 | 21 | 20.568264995119 | 0.431735004881014 |
| 48 | 12 | 11.9522845378251 | 0.0477154621748775 |
| 49 | 17 | 17.9030775842152 | -0.90307758421516 |
| 50 | 21 | 21.6250600469067 | -0.625060046906703 |
| 51 | 11 | 10.9232116049685 | 0.0767883950315128 |
| 52 | 19 | 20.44959420793 | -1.44959420792998 |
| 53 | 18 | 17.6689713828218 | 0.331028617178236 |
| 54 | 14 | 14.1517593612794 | -0.151759361279385 |
| 55 | 19 | 18.8488554754249 | 0.15114452457512 |
| 56 | 20 | 19.5783732109284 | 0.421626789071571 |
| 57 | 18 | 17.8274498057306 | 0.172550194269425 |
| 58 | 22 | 21.9535903372983 | 0.0464096627016709 |
| 59 | 16 | 16.1401024997246 | -0.140102499724597 |
| 60 | 20 | 20.5684268840053 | -0.568426884005334 |
| 61 | 14 | 14.0716295991514 | -0.0716295991514085 |
| 62 | 22 | 21.5545607391192 | 0.445439260880759 |
| 63 | 25 | 24.2858236330365 | 0.714176366963512 |
| 64 | 20 | 19.6676688292295 | 0.33233117077046 |
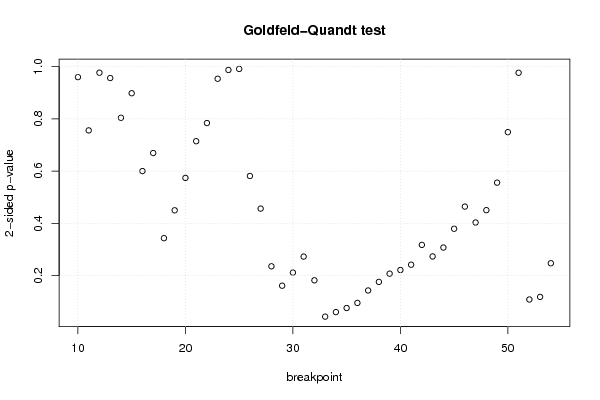
| Goldfeld-Quandt test for Heteroskedasticity | |||
| p-values | Alternative Hypothesis | ||
| breakpoint index | greater | 2-sided | less |
| 10 | 0.520040215095388 | 0.959919569809224 | 0.479959784904612 |
| 11 | 0.378010817055758 | 0.756021634111515 | 0.621989182944242 |
| 12 | 0.51160368153319 | 0.97679263693362 | 0.48839631846681 |
| 13 | 0.478245773055909 | 0.956491546111819 | 0.521754226944091 |
| 14 | 0.597851780620124 | 0.804296438759753 | 0.402148219379876 |
| 15 | 0.55087082980369 | 0.89825834039262 | 0.44912917019631 |
| 16 | 0.699876535427654 | 0.600246929144693 | 0.300123464572346 |
| 17 | 0.66528586877883 | 0.66942826244234 | 0.33471413122117 |
| 18 | 0.828312515524793 | 0.343374968950415 | 0.171687484475207 |
| 19 | 0.774941790465774 | 0.450116419068452 | 0.225058209534226 |
| 20 | 0.712896216111944 | 0.574207567776112 | 0.287103783888056 |
| 21 | 0.642703186599911 | 0.714593626800178 | 0.357296813400089 |
| 22 | 0.607897642327156 | 0.784204715345687 | 0.392102357672844 |
| 23 | 0.523153590955618 | 0.953692818088763 | 0.476846409044382 |
| 24 | 0.493698162791037 | 0.987396325582074 | 0.506301837208963 |
| 25 | 0.504382597053094 | 0.991234805893812 | 0.495617402946906 |
| 26 | 0.709266343962852 | 0.581467312074296 | 0.290733656037148 |
| 27 | 0.771683886539379 | 0.456632226921242 | 0.228316113460621 |
| 28 | 0.88212311146622 | 0.235753777067561 | 0.11787688853378 |
| 29 | 0.919283332136563 | 0.161433335726874 | 0.0807166678634372 |
| 30 | 0.894105226731429 | 0.211789546537143 | 0.105894773268571 |
| 31 | 0.863563093347335 | 0.27287381330533 | 0.136436906652665 |
| 32 | 0.908909021535258 | 0.182181956929484 | 0.0910909784647419 |
| 33 | 0.978505918016126 | 0.0429881639677475 | 0.0214940819838738 |
| 34 | 0.96978167328081 | 0.0604366534383807 | 0.0302183267191903 |
| 35 | 0.96198127424885 | 0.0760374515023006 | 0.0380187257511503 |
| 36 | 0.952221465067554 | 0.0955570698648913 | 0.0477785349324456 |
| 37 | 0.928392402951221 | 0.143215194097559 | 0.0716075970487794 |
| 38 | 0.912032760173577 | 0.175934479652846 | 0.0879672398264228 |
| 39 | 0.896179598352932 | 0.207640803294136 | 0.103820401647068 |
| 40 | 0.889258475609595 | 0.221483048780809 | 0.110741524390405 |
| 41 | 0.879106343696581 | 0.241787312606838 | 0.120893656303419 |
| 42 | 0.841156217710972 | 0.317687564578055 | 0.158843782289028 |
| 43 | 0.86322855923274 | 0.273542881534519 | 0.13677144076726 |
| 44 | 0.846264663321707 | 0.307470673356586 | 0.153735336678293 |
| 45 | 0.8102789328305 | 0.379442134339002 | 0.189721067169501 |
| 46 | 0.76786417180435 | 0.464271656391299 | 0.232135828195649 |
| 47 | 0.79827356890843 | 0.403452862183139 | 0.201726431091569 |
| 48 | 0.774675959483742 | 0.450648081032517 | 0.225324040516258 |
| 49 | 0.722003118223203 | 0.555993763553595 | 0.277996881776797 |
| 50 | 0.625326842089071 | 0.749346315821858 | 0.374673157910929 |
| 51 | 0.511721376541092 | 0.976557246917815 | 0.488278623458908 |
| 52 | 0.945676798925921 | 0.108646402148157 | 0.0543232010740786 |
| 53 | 0.940730831838294 | 0.118538336323411 | 0.0592691681617057 |
| 54 | 0.876254501502585 | 0.247490996994829 | 0.123745498497415 |
| Meta Analysis of Goldfeld-Quandt test for Heteroskedasticity | |||
| Description | # significant tests | % significant tests | OK/NOK |
| 1% type I error level | 0 | 0 | OK |
| 5% type I error level | 1 | 0.0222222222222222 | OK |
| 10% type I error level | 4 | 0.0888888888888889 | OK |