| Multiple Linear Regression - Estimated Regression Equation |
| TotalNrPV[t] = + 263.671396878483 + 2.06460984300451TotalNrCC[t] + 0.9806804078626TotalNrPRV[t] + e[t] |
| Multiple Linear Regression - Ordinary Least Squares | |||||
| Variable | Parameter | S.D. | T-STAT H0: parameter = 0 | 2-tail p-value | 1-tail p-value |
| (Intercept) | 263.671396878483 | 51.083735 | 5.1616 | 3e-06 | 2e-06 |
| TotalNrCC | 2.06460984300451 | 0.098276 | 21.0083 | 0 | 0 |
| TotalNrPRV | 0.9806804078626 | 0.367477 | 2.6687 | 0.0099 | 0.00495 |
| Multiple Linear Regression - Regression Statistics | |
| Multiple R | 0.962581335039603 |
| R-squared | 0.926562826566625 |
| Adjusted R-squared | 0.923986083639138 |
| F-TEST (value) | 359.586832152606 |
| F-TEST (DF numerator) | 2 |
| F-TEST (DF denominator) | 57 |
| p-value | 0 |
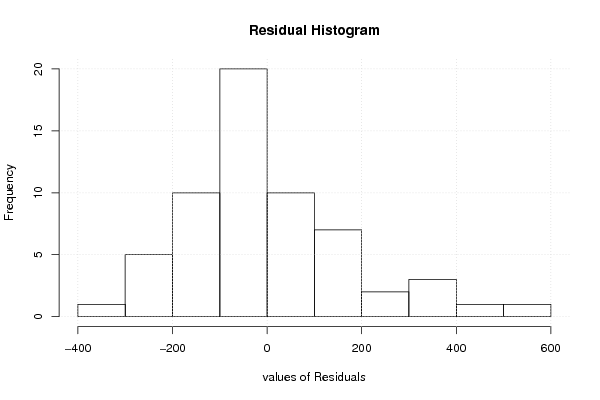
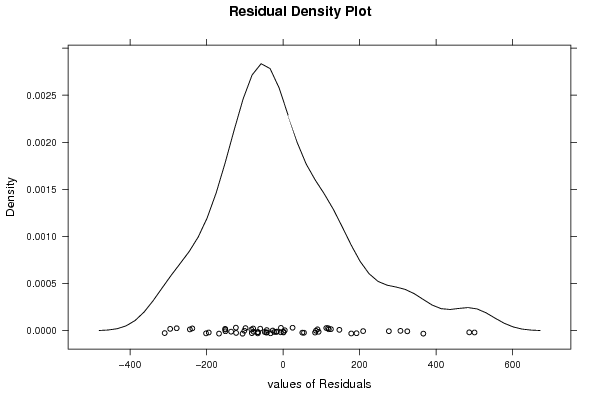
| Multiple Linear Regression - Residual Statistics | |
| Residual Standard Deviation | 178.199149066604 |
| Sum Squared Residuals | 1810031.39349953 |
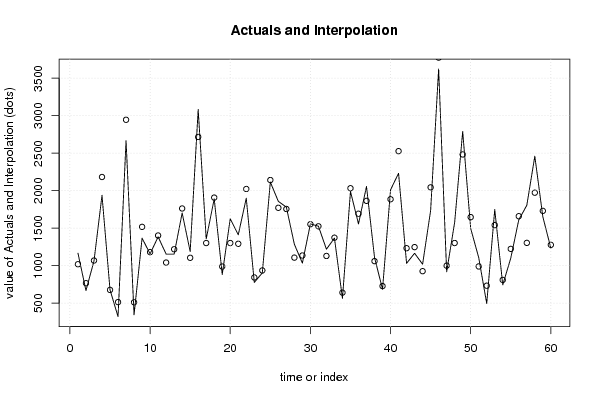
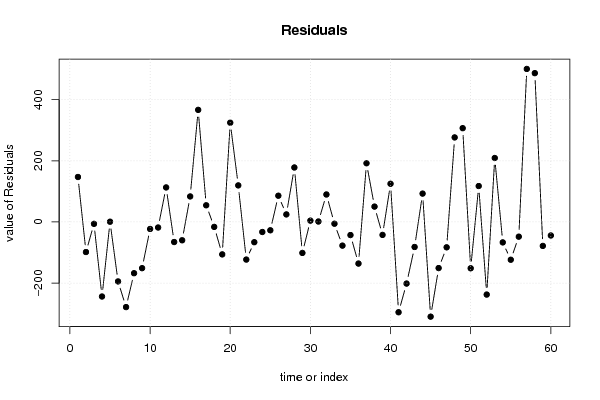
| Multiple Linear Regression - Actuals, Interpolation, and Residuals | |||
| Time or Index | Actuals | Interpolation Forecast | Residuals Prediction Error |
| 1 | 1167 | 1019.83410314937 | 147.165896850634 |
| 2 | 669 | 767.229329814442 | -98.2293298144423 |
| 3 | 1063 | 1069.07536300222 | -6.07536300221766 |
| 4 | 1939 | 2182.77675835707 | -243.776758357067 |
| 5 | 678 | 677.1092399132 | 0.890760086800492 |
| 6 | 321 | 515.398738832823 | -194.398738832823 |
| 7 | 2667 | 2945.28946515692 | -278.289465156917 |
| 8 | 345 | 512.508136771584 | -167.508136771584 |
| 9 | 1367 | 1518.02456947713 | -151.024569477128 |
| 10 | 1158 | 1180.82223174137 | -22.8222317413685 |
| 11 | 1385 | 1403.0773515949 | -18.0773515949 |
| 12 | 1155 | 1042.0289369886 | 112.9710630114 |
| 13 | 1154 | 1219.48213445971 | -65.4821344597087 |
| 14 | 1703 | 1762.78389954915 | -59.7838995491501 |
| 15 | 1189 | 1105.46415782299 | 83.5358421770052 |
| 16 | 3083 | 2716.32389993539 | 366.676100064606 |
| 17 | 1357 | 1302.37627526173 | 54.6237247382731 |
| 18 | 1892 | 1908.02933175042 | -16.0293317504206 |
| 19 | 883 | 988.968575234159 | -105.968575234159 |
| 20 | 1627 | 1302.27302623445 | 324.726973765552 |
| 21 | 1412 | 1292.36260242596 | 119.637397574039 |
| 22 | 1900 | 2022.92473976772 | -122.924739767718 |
| 23 | 777 | 843.155458734143 | -66.1554587341433 |
| 24 | 904 | 936.733834995371 | -32.7338349953707 |
| 25 | 2115 | 2142.155494823 | -27.1554948230011 |
| 26 | 1858 | 1772.07482919396 | 85.9251708060388 |
| 27 | 1781 | 1756.22888377595 | 24.7711162240502 |
| 28 | 1286 | 1107.78670488291 | 178.213295117093 |
| 29 | 1035 | 1136.2268074135 | -101.226807413504 |
| 30 | 1557 | 1552.60632096923 | 4.39367903077391 |
| 31 | 1527 | 1525.45738733349 | 1.54261266650715 |
| 32 | 1220 | 1130.08441704684 | 89.9155829531609 |
| 33 | 1368 | 1373.65693935902 | -5.656939359022 |
| 34 | 564 | 641.339939256098 | -77.3399392560983 |
| 35 | 1990 | 2032.73191454893 | -42.7319145489255 |
| 36 | 1557 | 1692.94872183377 | -135.948721833765 |
| 37 | 2057 | 1864.98227212916 | 192.017727870836 |
| 38 | 1111 | 1060.71367460292 | 50.2863253970797 |
| 39 | 686 | 728.260050716846 | -42.2600507168461 |
| 40 | 2011 | 1885.98992750598 | 125.010072494023 |
| 41 | 2232 | 2527.2061572998 | -295.206157299796 |
| 42 | 1032 | 1233.41815822434 | -201.418158224344 |
| 43 | 1166 | 1247.7671780981 | -81.767178098096 |
| 44 | 1020 | 927.184968133652 | 92.8150318663479 |
| 45 | 1735 | 2044.60332847056 | -309.603328470556 |
| 46 | 3623 | 3773.70906750198 | -150.709067501978 |
| 47 | 918 | 1000.89142831814 | -82.8914283181385 |
| 48 | 1579 | 1302.42771442408 | 276.572285575924 |
| 49 | 2790 | 2483.17767586551 | 306.822324134487 |
| 50 | 1496 | 1647.42405626039 | -151.424056260387 |
| 51 | 1108 | 990.362251751139 | 117.637748248861 |
| 52 | 496 | 733.369950810718 | -237.369950810718 |
| 53 | 1750 | 1540.73527775018 | 209.264722249823 |
| 54 | 744 | 810.741195409747 | -66.741195409747 |
| 55 | 1101 | 1224.43697566137 | -123.436975661371 |
| 56 | 1612 | 1660.01821337297 | -48.0182133729725 |
| 57 | 1805 | 1304.49232426708 | 500.50767573292 |
| 58 | 2460 | 1973.27011310317 | 486.729886896833 |
| 59 | 1653 | 1731.29887747027 | -78.2988774702676 |
| 60 | 1234 | 1278.16864144442 | -44.1686414444182 |
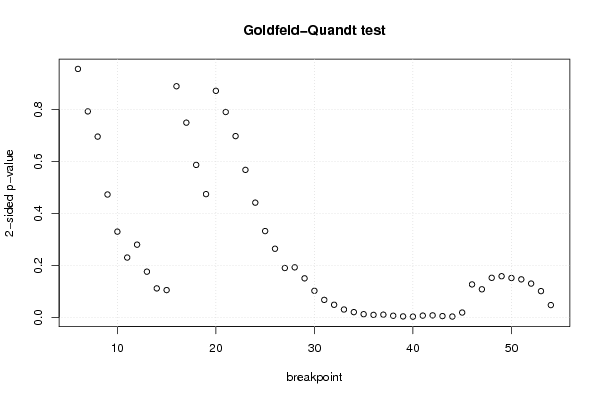
| Goldfeld-Quandt test for Heteroskedasticity | |||
| p-values | Alternative Hypothesis | ||
| breakpoint index | greater | 2-sided | less |
| 6 | 0.521375649627074 | 0.957248700745853 | 0.478624350372927 |
| 7 | 0.396775338028277 | 0.793550676056553 | 0.603224661971723 |
| 8 | 0.348225348406814 | 0.696450696813628 | 0.651774651593186 |
| 9 | 0.236599150078614 | 0.473198300157228 | 0.763400849921386 |
| 10 | 0.165009899362485 | 0.330019798724969 | 0.834990100637515 |
| 11 | 0.115086507491533 | 0.230173014983066 | 0.884913492508467 |
| 12 | 0.139913050351704 | 0.279826100703408 | 0.860086949648296 |
| 13 | 0.0878533588633737 | 0.175706717726747 | 0.912146641136626 |
| 14 | 0.05562426123434 | 0.11124852246868 | 0.94437573876566 |
| 15 | 0.0523358023940543 | 0.104671604788109 | 0.947664197605946 |
| 16 | 0.445266617113354 | 0.890533234226707 | 0.554733382886647 |
| 17 | 0.375066605073001 | 0.750133210146002 | 0.624933394926999 |
| 18 | 0.293633225176895 | 0.58726645035379 | 0.706366774823105 |
| 19 | 0.23734091923624 | 0.474681838472481 | 0.76265908076376 |
| 20 | 0.436491977211788 | 0.872983954423576 | 0.563508022788212 |
| 21 | 0.395615366242264 | 0.791230732484528 | 0.604384633757736 |
| 22 | 0.349149387256502 | 0.698298774513004 | 0.650850612743498 |
| 23 | 0.284110670019441 | 0.568221340038882 | 0.715889329980559 |
| 24 | 0.220874344889314 | 0.441748689778627 | 0.779125655110687 |
| 25 | 0.166138012807685 | 0.332276025615371 | 0.833861987192315 |
| 26 | 0.132040755687168 | 0.264081511374336 | 0.867959244312832 |
| 27 | 0.0949377063381318 | 0.189875412676264 | 0.905062293661868 |
| 28 | 0.096211187499088 | 0.192422374998176 | 0.903788812500912 |
| 29 | 0.0750229550740894 | 0.150045910148179 | 0.924977044925911 |
| 30 | 0.0509772025835845 | 0.101954405167169 | 0.949022797416415 |
| 31 | 0.0334762477952164 | 0.0669524955904328 | 0.966523752204784 |
| 32 | 0.0240558173324322 | 0.0481116346648645 | 0.975944182667568 |
| 33 | 0.0149086550538231 | 0.0298173101076462 | 0.985091344946177 |
| 34 | 0.00986409786697851 | 0.019728195733957 | 0.990135902133021 |
| 35 | 0.005894596636569 | 0.011789193273138 | 0.994105403363431 |
| 36 | 0.00459143685712124 | 0.00918287371424249 | 0.995408563142879 |
| 37 | 0.00499765135508638 | 0.00999530271017276 | 0.995002348644914 |
| 38 | 0.00290137062606078 | 0.00580274125212157 | 0.997098629373939 |
| 39 | 0.00161973316741946 | 0.00323946633483891 | 0.998380266832581 |
| 40 | 0.00114738329553362 | 0.00229476659106723 | 0.998852616704466 |
| 41 | 0.00319039548293952 | 0.00638079096587904 | 0.99680960451706 |
| 42 | 0.00364241187630618 | 0.00728482375261236 | 0.996357588123694 |
| 43 | 0.00225388098293288 | 0.00450776196586576 | 0.997746119017067 |
| 44 | 0.0013385402840292 | 0.00267708056805841 | 0.998661459715971 |
| 45 | 0.00906654653498671 | 0.0181330930699734 | 0.990933453465013 |
| 46 | 0.0632694011307949 | 0.12653880226159 | 0.936730598869205 |
| 47 | 0.0538848099354915 | 0.107769619870983 | 0.946115190064509 |
| 48 | 0.0760094929949398 | 0.15201898598988 | 0.92399050700506 |
| 49 | 0.0790684607148681 | 0.158136921429736 | 0.920931539285132 |
| 50 | 0.0756631272159375 | 0.151326254431875 | 0.924336872784062 |
| 51 | 0.0730568545840691 | 0.146113709168138 | 0.926943145415931 |
| 52 | 0.0649195372718186 | 0.129839074543637 | 0.935080462728181 |
| 53 | 0.0503590749396233 | 0.100718149879247 | 0.949640925060377 |
| 54 | 0.023448161369337 | 0.0468963227386741 | 0.976551838630663 |
| Meta Analysis of Goldfeld-Quandt test for Heteroskedasticity | |||
| Description | # significant tests | % significant tests | OK/NOK |
| 1% type I error level | 9 | 0.183673469387755 | NOK |
| 5% type I error level | 15 | 0.306122448979592 | NOK |
| 10% type I error level | 16 | 0.326530612244898 | NOK |