| Multiple Linear Regression - Estimated Regression Equation |
| TotalTime[t] = + 20651.8195834353 + 0.219466213707421Compendiumwriting_char[t] + 1.46147516078375Compendiumwriting_sec[t] + e[t] |
| Multiple Linear Regression - Ordinary Least Squares | |||||
| Variable | Parameter | S.D. | T-STAT H0: parameter = 0 | 2-tail p-value | 1-tail p-value |
| (Intercept) | 20651.8195834353 | 13676.132686 | 1.5101 | 0.136551 | 0.068276 |
| Compendiumwriting_char | 0.219466213707421 | 0.309729 | 0.7086 | 0.481477 | 0.240738 |
| Compendiumwriting_sec | 1.46147516078375 | 0.207462 | 7.0446 | 0 | 0 |
| Multiple Linear Regression - Regression Statistics | |
| Multiple R | 0.832912302378095 |
| R-squared | 0.69374290345278 |
| Adjusted R-squared | 0.682997040416035 |
| F-TEST (value) | 64.5590680879316 |
| F-TEST (DF numerator) | 2 |
| F-TEST (DF denominator) | 57 |
| p-value | 2.22044604925031e-15 |
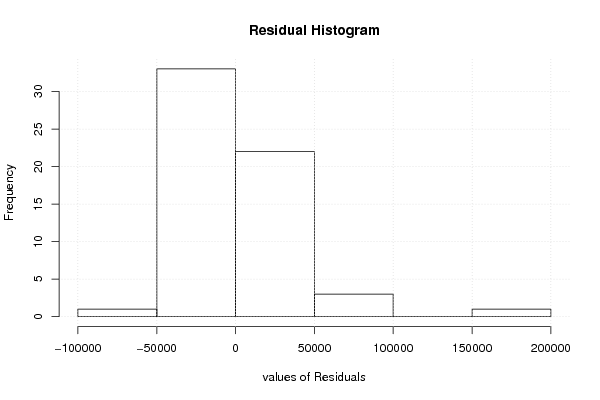
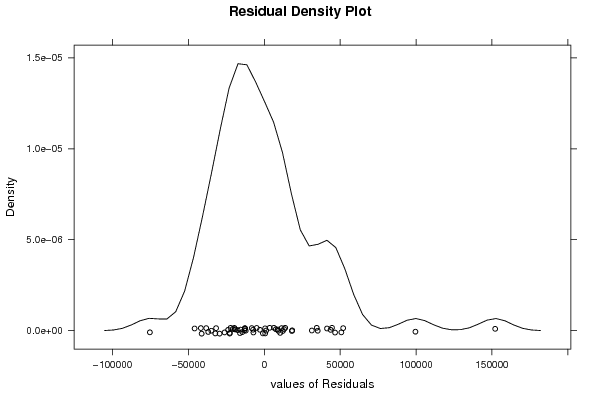
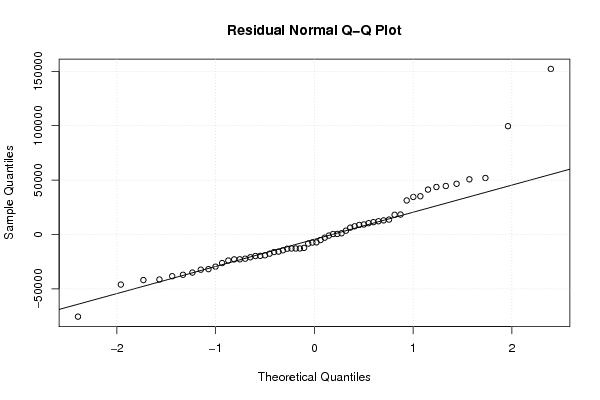
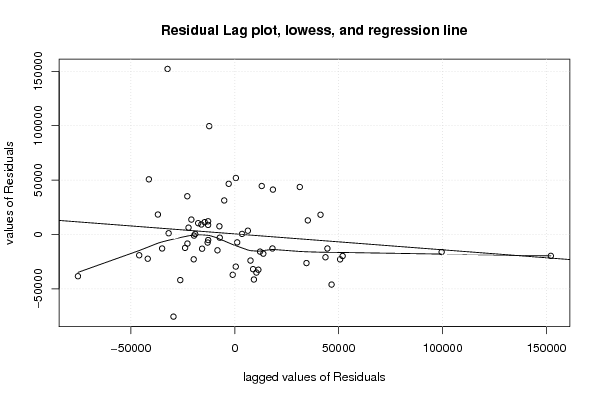
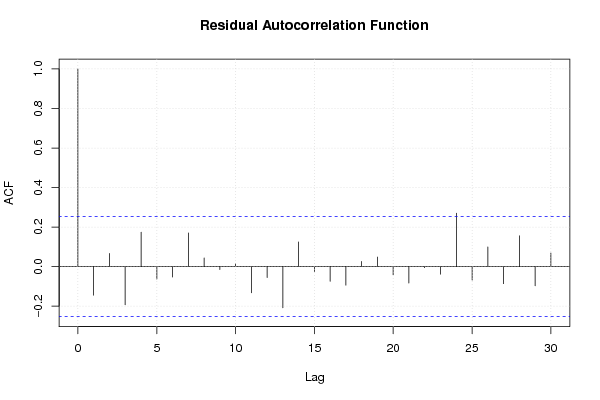
| Multiple Linear Regression - Residual Statistics | |
| Residual Standard Deviation | 36485.9534296789 |
| Sum Squared Residuals | 75879813467.3439 |
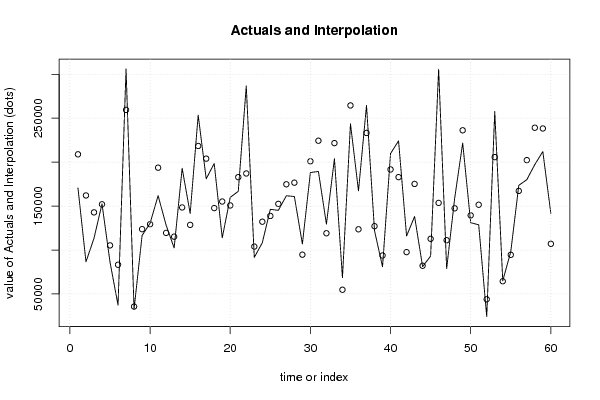
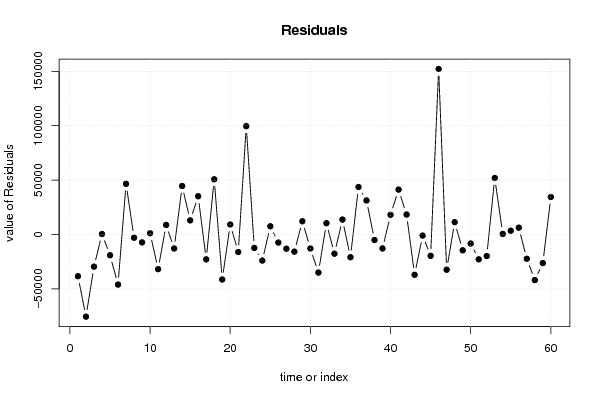
| Multiple Linear Regression - Actuals, Interpolation, and Residuals | |||
| Time or Index | Actuals | Interpolation Forecast | Residuals Prediction Error |
| 1 | 170588 | 208915.271805056 | -38327.2718050559 |
| 2 | 86621 | 162104.923928856 | -75483.9239288563 |
| 3 | 113337 | 142851.547153698 | -29514.5471536981 |
| 4 | 152510 | 152039.123319162 | 470.876680838274 |
| 5 | 86206 | 105279.910747127 | -19073.9107471268 |
| 6 | 37257 | 83259.1463275083 | -46002.1463275083 |
| 7 | 306055 | 259466.64437633 | 46588.3556236705 |
| 8 | 32750 | 35672.6747963115 | -2922.67479631146 |
| 9 | 116502 | 123732.035949029 | -7230.03594902886 |
| 10 | 130539 | 129383.134211129 | 1155.86578887092 |
| 11 | 161876 | 193713.883430999 | -31837.8834309987 |
| 12 | 128274 | 119485.39639071 | 8788.60360928956 |
| 13 | 102350 | 115196.632382236 | -12846.6323822363 |
| 14 | 193024 | 148448.099559478 | 44575.9004405222 |
| 15 | 141574 | 128601.186545061 | 12972.8134549388 |
| 16 | 253559 | 218404.635585429 | 35154.3644145714 |
| 17 | 181110 | 203971.2394783 | -22861.2394783001 |
| 18 | 198432 | 147722.141896834 | 50709.8581031663 |
| 19 | 113853 | 155204.284326494 | -41351.2843264942 |
| 20 | 159940 | 150735.985522419 | 9204.01447758139 |
| 21 | 166822 | 182912.650556341 | -16090.6505563414 |
| 22 | 286675 | 187108.998075532 | 99566.001924468 |
| 23 | 91657 | 103962.880930674 | -12305.8809306745 |
| 24 | 108278 | 132208.940678621 | -23930.9406786213 |
| 25 | 146342 | 138775.947541904 | 7566.05245809596 |
| 26 | 145142 | 152538.776374967 | -7396.77637496671 |
| 27 | 161740 | 174804.853062816 | -13064.853062816 |
| 28 | 160905 | 176642.134726088 | -15737.1347260878 |
| 29 | 106888 | 94720.5822338744 | 12167.4177661256 |
| 30 | 188150 | 200986.682201364 | -12836.6822013637 |
| 31 | 189401 | 224372.271710891 | -34971.2717108913 |
| 32 | 129484 | 119085.43685512 | 10398.5631448795 |
| 33 | 204030 | 221646.214927669 | -17616.2149276694 |
| 34 | 68538 | 54814.8236688 | 13723.1763312 |
| 35 | 243625 | 264533.855053354 | -20908.8550533537 |
| 36 | 167255 | 123604.573775678 | 43650.4262243217 |
| 37 | 264528 | 233239.815535824 | 31288.184464176 |
| 38 | 122024 | 127103.766932024 | -5079.76693202426 |
| 39 | 80964 | 93787.2881152313 | -12823.2881152313 |
| 40 | 209795 | 191663.746972641 | 18131.2530273589 |
| 41 | 224205 | 182936.768662584 | 41268.2313374157 |
| 42 | 115971 | 97618.7341746333 | 18352.2658253667 |
| 43 | 138191 | 175199.946139317 | -37008.946139317 |
| 44 | 81106 | 82099.1135700965 | -993.113570096463 |
| 45 | 93125 | 112729.461133329 | -19604.4611333286 |
| 46 | 305756 | 153624.32778077 | 152131.67221923 |
| 47 | 78800 | 111158.544514148 | -32358.5445141475 |
| 48 | 158835 | 147485.855822834 | 11349.1441771665 |
| 49 | 221745 | 236252.543519454 | -14507.5435194538 |
| 50 | 131108 | 139441.190459485 | -8333.19045948487 |
| 51 | 128734 | 151522.285293202 | -22788.2852932024 |
| 52 | 24188 | 43951.3832496291 | -19763.3832496291 |
| 53 | 257662 | 205733.369970476 | 51928.6300295243 |
| 54 | 65029 | 64491.8441179447 | 537.155882055287 |
| 55 | 98066 | 94579.7557919288 | 3486.2442080712 |
| 56 | 173587 | 167283.709326291 | 6303.29067370902 |
| 57 | 180042 | 202304.423303278 | -22262.4233032781 |
| 58 | 197266 | 239156.95156485 | -41890.9515648504 |
| 59 | 212060 | 238308.742414947 | -26248.7424149466 |
| 60 | 141582 | 107076.911529222 | 34505.0884707779 |
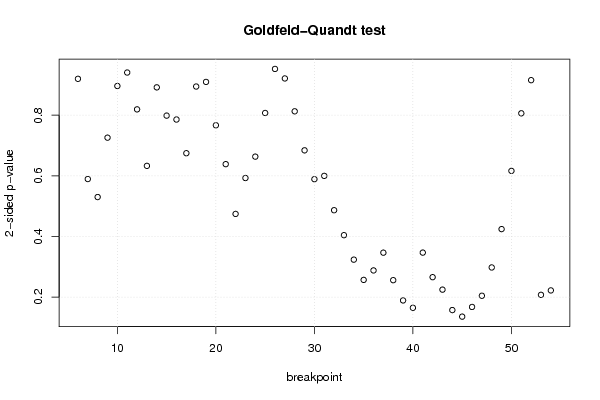
| Goldfeld-Quandt test for Heteroskedasticity | |||
| p-values | Alternative Hypothesis | ||
| breakpoint index | greater | 2-sided | less |
| 6 | 0.460020148417255 | 0.92004029683451 | 0.539979851582745 |
| 7 | 0.705243786232768 | 0.589512427534464 | 0.294756213767232 |
| 8 | 0.734997709476271 | 0.530004581047458 | 0.265002290523729 |
| 9 | 0.637047270897995 | 0.725905458204009 | 0.362952729102005 |
| 10 | 0.55176141821916 | 0.89647716356168 | 0.44823858178084 |
| 11 | 0.470415251717635 | 0.94083050343527 | 0.529584748282365 |
| 12 | 0.40965564788457 | 0.819311295769141 | 0.59034435211543 |
| 13 | 0.316465378702936 | 0.632930757405872 | 0.683534621297064 |
| 14 | 0.44594573524427 | 0.891891470488539 | 0.55405426475573 |
| 15 | 0.399329687216418 | 0.798659374432835 | 0.600670312783582 |
| 16 | 0.392896985455159 | 0.785793970910318 | 0.607103014544841 |
| 17 | 0.337337381919532 | 0.674674763839065 | 0.662662618080467 |
| 18 | 0.447321136804439 | 0.894642273608879 | 0.552678863195561 |
| 19 | 0.454901428426644 | 0.909802856853288 | 0.545098571573356 |
| 20 | 0.383396774119376 | 0.766793548238753 | 0.616603225880624 |
| 21 | 0.319280035932527 | 0.638560071865055 | 0.680719964067473 |
| 22 | 0.762788968511875 | 0.474422062976249 | 0.237211031488125 |
| 23 | 0.703574906515066 | 0.592850186969868 | 0.296425093484934 |
| 24 | 0.668318272625502 | 0.663363454748996 | 0.331681727374498 |
| 25 | 0.596329448538091 | 0.807341102923818 | 0.403670551461909 |
| 26 | 0.523683854186085 | 0.95263229162783 | 0.476316145813915 |
| 27 | 0.46063735298347 | 0.921274705966941 | 0.53936264701653 |
| 28 | 0.406436323428403 | 0.812872646856806 | 0.593563676571597 |
| 29 | 0.342079193251694 | 0.684158386503388 | 0.657920806748306 |
| 30 | 0.294515938168171 | 0.589031876336341 | 0.705484061831829 |
| 31 | 0.299950982477647 | 0.599901964955295 | 0.700049017522353 |
| 32 | 0.243314839496648 | 0.486629678993296 | 0.756685160503352 |
| 33 | 0.202147695332487 | 0.404295390664974 | 0.797852304667513 |
| 34 | 0.161740891705754 | 0.323481783411507 | 0.838259108294247 |
| 35 | 0.128380398548612 | 0.256760797097223 | 0.871619601451388 |
| 36 | 0.143977341042131 | 0.287954682084263 | 0.856022658957869 |
| 37 | 0.173278857224334 | 0.346557714448668 | 0.826721142775666 |
| 38 | 0.127907284152936 | 0.255814568305871 | 0.872092715847064 |
| 39 | 0.094503231104784 | 0.189006462209568 | 0.905496768895216 |
| 40 | 0.0823311276258791 | 0.164662255251758 | 0.917668872374121 |
| 41 | 0.173373451660186 | 0.346746903320371 | 0.826626548339814 |
| 42 | 0.132829407379614 | 0.265658814759228 | 0.867170592620386 |
| 43 | 0.112284849846697 | 0.224569699693394 | 0.887715150153303 |
| 44 | 0.078578240833629 | 0.157156481667258 | 0.921421759166371 |
| 45 | 0.0677418345283719 | 0.135483669056744 | 0.932258165471628 |
| 46 | 0.916296086757041 | 0.167407826485919 | 0.0837039132429594 |
| 47 | 0.897793280375521 | 0.204413439248958 | 0.102206719624479 |
| 48 | 0.851140412787586 | 0.297719174424829 | 0.148859587212414 |
| 49 | 0.787869342047298 | 0.424261315905405 | 0.212130657952702 |
| 50 | 0.691800064750188 | 0.616399870499624 | 0.308199935249812 |
| 51 | 0.596844318326546 | 0.806311363346909 | 0.403155681673454 |
| 52 | 0.542233045399634 | 0.915533909200733 | 0.457766954600366 |
| 53 | 0.896307002301073 | 0.207385995397854 | 0.103692997698927 |
| 54 | 0.888979483050767 | 0.222041033898466 | 0.111020516949233 |
| Meta Analysis of Goldfeld-Quandt test for Heteroskedasticity | |||
| Description | # significant tests | % significant tests | OK/NOK |
| 1% type I error level | 0 | 0 | OK |
| 5% type I error level | 0 | 0 | OK |
| 10% type I error level | 0 | 0 | OK |