Free Statistics

of Irreproducible Research!

Author's title

Author*Unverified author*
R Software Modulerwasp_autocorrelation.wasp
Title produced by software(Partial) Autocorrelation Function
Date of computationMon, 21 Nov 2011 12:01:13 -0500
Cite this page as followsStatistical Computations at FreeStatistics.org, Office for Research Development and Education, URL https://freestatistics.org/blog/index.php?v=date/2011/Nov/21/t1321895292kmtfos3o91p1sz0.htm/, Retrieved Fri, 19 Apr 2024 18:59:20 +0000
Statistical Computations at FreeStatistics.org, Office for Research Development and Education, URL https://freestatistics.org/blog/index.php?pk=145827, Retrieved Fri, 19 Apr 2024 18:59:20 +0000
QR Codes:

Original text written by user:
IsPrivate?No (this computation is public)
User-defined keywordsKDGP2W12
Estimated Impact74
Family? (F = Feedback message, R = changed R code, M = changed R Module, P = changed Parameters, D = changed Data)
-       [(Partial) Autocorrelation Function] [Goudkoers te Brus...] [2011-11-21 17:01:13] [b7d89a59d057204a66389ee14552eeec] [Current]
Feedback Forum

Post a new message
Dataseries X:
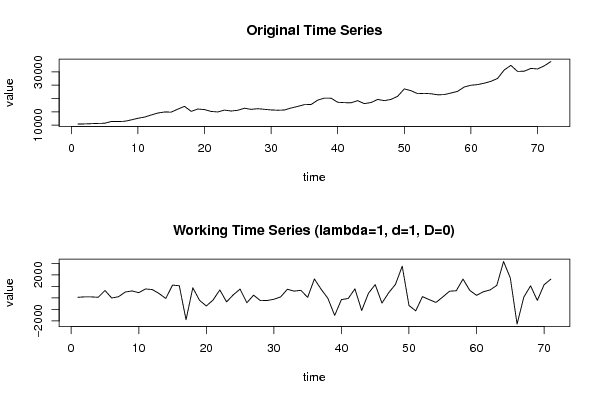
10407
10463
10556
10646
10702
11353
11346
11451
11964
12574
13031
13812
14544
14931
14886
16005
17064
15168
16050
15839
15137
14954
15648
15305
15579
16348
15928
16171
15937
15713
15594
15683
16438
17032
17696
17745
19394
20148
20108
18584
18441
18391
19178
18079
18483
19644
19195
19650
20830
23595
22937
21814
21928
21777
21383
21467
22052
22680
24320
24977
25204
25739
26434
27525
30695
32436
30160
30236
31293
31077
32226
33865


Summary of computational transaction
Raw Inputview raw input (R code)
Raw Outputview raw output of R engine
Computing time2 seconds
R Server'George Udny Yule' @ yule.wessa.net

\begin{tabular}{lllllllll}
\hline
Summary of computational transaction \tabularnewline
Raw Input & view raw input (R code)  \tabularnewline
Raw Output & view raw output of R engine  \tabularnewline
Computing time & 2 seconds \tabularnewline
R Server & 'George Udny Yule' @ yule.wessa.net \tabularnewline
\hline
\end{tabular}
%Source: https://freestatistics.org/blog/index.php?pk=145827&T=0

[TABLE]
[ROW][C]Summary of computational transaction[/C][/ROW]
[ROW][C]Raw Input[/C][C]view raw input (R code) [/C][/ROW]
[ROW][C]Raw Output[/C][C]view raw output of R engine [/C][/ROW]
[ROW][C]Computing time[/C][C]2 seconds[/C][/ROW]
[ROW][C]R Server[/C][C]'George Udny Yule' @ yule.wessa.net[/C][/ROW]
[/TABLE]
Source: https://freestatistics.org/blog/index.php?pk=145827&T=0

Globally Unique Identifier (entire table): ba.freestatistics.org/blog/index.php?pk=145827&T=0

As an alternative you can also use a QR Code:  

The GUIDs for individual cells are displayed in the table below:

Summary of computational transaction
Raw Inputview raw input (R code)
Raw Outputview raw output of R engine
Computing time2 seconds
R Server'George Udny Yule' @ yule.wessa.net


Autocorrelation Function
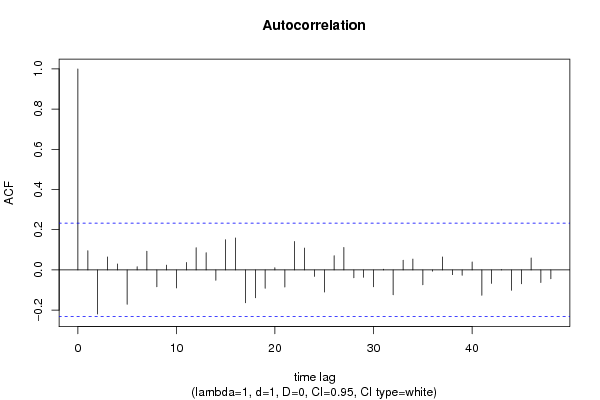
Time lag kACF(k)T-STATP-value
10.0957560.80690.211221
2-0.219408-1.84880.034328
30.0643930.54260.294559
40.0293720.24750.40262
5-0.170952-1.44050.077066
60.0159150.13410.446851
70.0924780.77920.219217
8-0.083551-0.7040.241864
90.0236940.19970.421162
10-0.089633-0.75530.226294
110.0370290.3120.377972
120.1100530.92730.17845
130.0858160.72310.235998
14-0.051707-0.43570.332192
150.1502171.26580.104869
160.1584891.33550.092997
17-0.163192-1.37510.086715
18-0.138248-1.16490.12398
19-0.091333-0.76960.22205
200.0105240.08870.464793
21-0.085131-0.71730.237762
220.1412961.19060.118892
230.108460.91390.181931
24-0.032253-0.27180.393293
25-0.110297-0.92940.177921
260.0706980.59570.276631
270.1114140.93880.17551
28-0.039152-0.32990.371222
29-0.036398-0.30670.379986
30-0.083572-0.70420.24181
310.0030430.02560.489808
32-0.123891-1.04390.15003
330.047780.40260.344224
340.0537070.45250.32613
35-0.073646-0.62060.268441
36-0.006171-0.0520.47934
370.0645490.54390.294106
38-0.023541-0.19840.421666
39-0.026871-0.22640.410763
400.0397270.33470.369403
41-0.125872-1.06060.146229
42-0.067146-0.56580.286662
430.0013560.01140.495457
44-0.101121-0.85210.198523
45-0.068563-0.57770.282639
460.0589960.49710.310325
47-0.062821-0.52930.299112
48-0.044327-0.37350.354943

\begin{tabular}{lllllllll}
\hline
Autocorrelation Function \tabularnewline
Time lag k & ACF(k) & T-STAT & P-value \tabularnewline
1 & 0.095756 & 0.8069 & 0.211221 \tabularnewline
2 & -0.219408 & -1.8488 & 0.034328 \tabularnewline
3 & 0.064393 & 0.5426 & 0.294559 \tabularnewline
4 & 0.029372 & 0.2475 & 0.40262 \tabularnewline
5 & -0.170952 & -1.4405 & 0.077066 \tabularnewline
6 & 0.015915 & 0.1341 & 0.446851 \tabularnewline
7 & 0.092478 & 0.7792 & 0.219217 \tabularnewline
8 & -0.083551 & -0.704 & 0.241864 \tabularnewline
9 & 0.023694 & 0.1997 & 0.421162 \tabularnewline
10 & -0.089633 & -0.7553 & 0.226294 \tabularnewline
11 & 0.037029 & 0.312 & 0.377972 \tabularnewline
12 & 0.110053 & 0.9273 & 0.17845 \tabularnewline
13 & 0.085816 & 0.7231 & 0.235998 \tabularnewline
14 & -0.051707 & -0.4357 & 0.332192 \tabularnewline
15 & 0.150217 & 1.2658 & 0.104869 \tabularnewline
16 & 0.158489 & 1.3355 & 0.092997 \tabularnewline
17 & -0.163192 & -1.3751 & 0.086715 \tabularnewline
18 & -0.138248 & -1.1649 & 0.12398 \tabularnewline
19 & -0.091333 & -0.7696 & 0.22205 \tabularnewline
20 & 0.010524 & 0.0887 & 0.464793 \tabularnewline
21 & -0.085131 & -0.7173 & 0.237762 \tabularnewline
22 & 0.141296 & 1.1906 & 0.118892 \tabularnewline
23 & 0.10846 & 0.9139 & 0.181931 \tabularnewline
24 & -0.032253 & -0.2718 & 0.393293 \tabularnewline
25 & -0.110297 & -0.9294 & 0.177921 \tabularnewline
26 & 0.070698 & 0.5957 & 0.276631 \tabularnewline
27 & 0.111414 & 0.9388 & 0.17551 \tabularnewline
28 & -0.039152 & -0.3299 & 0.371222 \tabularnewline
29 & -0.036398 & -0.3067 & 0.379986 \tabularnewline
30 & -0.083572 & -0.7042 & 0.24181 \tabularnewline
31 & 0.003043 & 0.0256 & 0.489808 \tabularnewline
32 & -0.123891 & -1.0439 & 0.15003 \tabularnewline
33 & 0.04778 & 0.4026 & 0.344224 \tabularnewline
34 & 0.053707 & 0.4525 & 0.32613 \tabularnewline
35 & -0.073646 & -0.6206 & 0.268441 \tabularnewline
36 & -0.006171 & -0.052 & 0.47934 \tabularnewline
37 & 0.064549 & 0.5439 & 0.294106 \tabularnewline
38 & -0.023541 & -0.1984 & 0.421666 \tabularnewline
39 & -0.026871 & -0.2264 & 0.410763 \tabularnewline
40 & 0.039727 & 0.3347 & 0.369403 \tabularnewline
41 & -0.125872 & -1.0606 & 0.146229 \tabularnewline
42 & -0.067146 & -0.5658 & 0.286662 \tabularnewline
43 & 0.001356 & 0.0114 & 0.495457 \tabularnewline
44 & -0.101121 & -0.8521 & 0.198523 \tabularnewline
45 & -0.068563 & -0.5777 & 0.282639 \tabularnewline
46 & 0.058996 & 0.4971 & 0.310325 \tabularnewline
47 & -0.062821 & -0.5293 & 0.299112 \tabularnewline
48 & -0.044327 & -0.3735 & 0.354943 \tabularnewline
\hline
\end{tabular}
%Source: https://freestatistics.org/blog/index.php?pk=145827&T=1

[TABLE]
[ROW][C]Autocorrelation Function[/C][/ROW]
[ROW][C]Time lag k[/C][C]ACF(k)[/C][C]T-STAT[/C][C]P-value[/C][/ROW]
[ROW][C]1[/C][C]0.095756[/C][C]0.8069[/C][C]0.211221[/C][/ROW]
[ROW][C]2[/C][C]-0.219408[/C][C]-1.8488[/C][C]0.034328[/C][/ROW]
[ROW][C]3[/C][C]0.064393[/C][C]0.5426[/C][C]0.294559[/C][/ROW]
[ROW][C]4[/C][C]0.029372[/C][C]0.2475[/C][C]0.40262[/C][/ROW]
[ROW][C]5[/C][C]-0.170952[/C][C]-1.4405[/C][C]0.077066[/C][/ROW]
[ROW][C]6[/C][C]0.015915[/C][C]0.1341[/C][C]0.446851[/C][/ROW]
[ROW][C]7[/C][C]0.092478[/C][C]0.7792[/C][C]0.219217[/C][/ROW]
[ROW][C]8[/C][C]-0.083551[/C][C]-0.704[/C][C]0.241864[/C][/ROW]
[ROW][C]9[/C][C]0.023694[/C][C]0.1997[/C][C]0.421162[/C][/ROW]
[ROW][C]10[/C][C]-0.089633[/C][C]-0.7553[/C][C]0.226294[/C][/ROW]
[ROW][C]11[/C][C]0.037029[/C][C]0.312[/C][C]0.377972[/C][/ROW]
[ROW][C]12[/C][C]0.110053[/C][C]0.9273[/C][C]0.17845[/C][/ROW]
[ROW][C]13[/C][C]0.085816[/C][C]0.7231[/C][C]0.235998[/C][/ROW]
[ROW][C]14[/C][C]-0.051707[/C][C]-0.4357[/C][C]0.332192[/C][/ROW]
[ROW][C]15[/C][C]0.150217[/C][C]1.2658[/C][C]0.104869[/C][/ROW]
[ROW][C]16[/C][C]0.158489[/C][C]1.3355[/C][C]0.092997[/C][/ROW]
[ROW][C]17[/C][C]-0.163192[/C][C]-1.3751[/C][C]0.086715[/C][/ROW]
[ROW][C]18[/C][C]-0.138248[/C][C]-1.1649[/C][C]0.12398[/C][/ROW]
[ROW][C]19[/C][C]-0.091333[/C][C]-0.7696[/C][C]0.22205[/C][/ROW]
[ROW][C]20[/C][C]0.010524[/C][C]0.0887[/C][C]0.464793[/C][/ROW]
[ROW][C]21[/C][C]-0.085131[/C][C]-0.7173[/C][C]0.237762[/C][/ROW]
[ROW][C]22[/C][C]0.141296[/C][C]1.1906[/C][C]0.118892[/C][/ROW]
[ROW][C]23[/C][C]0.10846[/C][C]0.9139[/C][C]0.181931[/C][/ROW]
[ROW][C]24[/C][C]-0.032253[/C][C]-0.2718[/C][C]0.393293[/C][/ROW]
[ROW][C]25[/C][C]-0.110297[/C][C]-0.9294[/C][C]0.177921[/C][/ROW]
[ROW][C]26[/C][C]0.070698[/C][C]0.5957[/C][C]0.276631[/C][/ROW]
[ROW][C]27[/C][C]0.111414[/C][C]0.9388[/C][C]0.17551[/C][/ROW]
[ROW][C]28[/C][C]-0.039152[/C][C]-0.3299[/C][C]0.371222[/C][/ROW]
[ROW][C]29[/C][C]-0.036398[/C][C]-0.3067[/C][C]0.379986[/C][/ROW]
[ROW][C]30[/C][C]-0.083572[/C][C]-0.7042[/C][C]0.24181[/C][/ROW]
[ROW][C]31[/C][C]0.003043[/C][C]0.0256[/C][C]0.489808[/C][/ROW]
[ROW][C]32[/C][C]-0.123891[/C][C]-1.0439[/C][C]0.15003[/C][/ROW]
[ROW][C]33[/C][C]0.04778[/C][C]0.4026[/C][C]0.344224[/C][/ROW]
[ROW][C]34[/C][C]0.053707[/C][C]0.4525[/C][C]0.32613[/C][/ROW]
[ROW][C]35[/C][C]-0.073646[/C][C]-0.6206[/C][C]0.268441[/C][/ROW]
[ROW][C]36[/C][C]-0.006171[/C][C]-0.052[/C][C]0.47934[/C][/ROW]
[ROW][C]37[/C][C]0.064549[/C][C]0.5439[/C][C]0.294106[/C][/ROW]
[ROW][C]38[/C][C]-0.023541[/C][C]-0.1984[/C][C]0.421666[/C][/ROW]
[ROW][C]39[/C][C]-0.026871[/C][C]-0.2264[/C][C]0.410763[/C][/ROW]
[ROW][C]40[/C][C]0.039727[/C][C]0.3347[/C][C]0.369403[/C][/ROW]
[ROW][C]41[/C][C]-0.125872[/C][C]-1.0606[/C][C]0.146229[/C][/ROW]
[ROW][C]42[/C][C]-0.067146[/C][C]-0.5658[/C][C]0.286662[/C][/ROW]
[ROW][C]43[/C][C]0.001356[/C][C]0.0114[/C][C]0.495457[/C][/ROW]
[ROW][C]44[/C][C]-0.101121[/C][C]-0.8521[/C][C]0.198523[/C][/ROW]
[ROW][C]45[/C][C]-0.068563[/C][C]-0.5777[/C][C]0.282639[/C][/ROW]
[ROW][C]46[/C][C]0.058996[/C][C]0.4971[/C][C]0.310325[/C][/ROW]
[ROW][C]47[/C][C]-0.062821[/C][C]-0.5293[/C][C]0.299112[/C][/ROW]
[ROW][C]48[/C][C]-0.044327[/C][C]-0.3735[/C][C]0.354943[/C][/ROW]
[/TABLE]
Source: https://freestatistics.org/blog/index.php?pk=145827&T=1

Globally Unique Identifier (entire table): ba.freestatistics.org/blog/index.php?pk=145827&T=1

As an alternative you can also use a QR Code:  

The GUIDs for individual cells are displayed in the table below:

Autocorrelation Function
Time lag kACF(k)T-STATP-value
10.0957560.80690.211221
2-0.219408-1.84880.034328
30.0643930.54260.294559
40.0293720.24750.40262
5-0.170952-1.44050.077066
60.0159150.13410.446851
70.0924780.77920.219217
8-0.083551-0.7040.241864
90.0236940.19970.421162
10-0.089633-0.75530.226294
110.0370290.3120.377972
120.1100530.92730.17845
130.0858160.72310.235998
14-0.051707-0.43570.332192
150.1502171.26580.104869
160.1584891.33550.092997
17-0.163192-1.37510.086715
18-0.138248-1.16490.12398
19-0.091333-0.76960.22205
200.0105240.08870.464793
21-0.085131-0.71730.237762
220.1412961.19060.118892
230.108460.91390.181931
24-0.032253-0.27180.393293
25-0.110297-0.92940.177921
260.0706980.59570.276631
270.1114140.93880.17551
28-0.039152-0.32990.371222
29-0.036398-0.30670.379986
30-0.083572-0.70420.24181
310.0030430.02560.489808
32-0.123891-1.04390.15003
330.047780.40260.344224
340.0537070.45250.32613
35-0.073646-0.62060.268441
36-0.006171-0.0520.47934
370.0645490.54390.294106
38-0.023541-0.19840.421666
39-0.026871-0.22640.410763
400.0397270.33470.369403
41-0.125872-1.06060.146229
42-0.067146-0.56580.286662
430.0013560.01140.495457
44-0.101121-0.85210.198523
45-0.068563-0.57770.282639
460.0589960.49710.310325
47-0.062821-0.52930.299112
48-0.044327-0.37350.354943


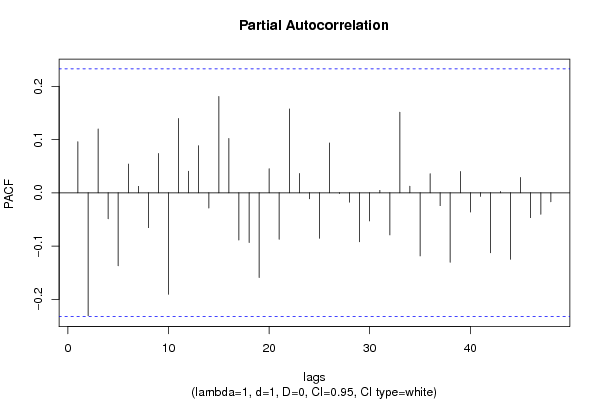
Partial Autocorrelation Function
Time lag kPACF(k)T-STATP-value
10.0957560.80690.211221
2-0.230692-1.94380.027939
30.1197521.0090.158189
4-0.048856-0.41170.340912
5-0.136974-1.15420.126151
60.0538170.45350.325796
70.0120910.10190.459568
8-0.065456-0.55150.291498
90.0739740.62330.267537
10-0.190415-1.60450.056525
110.1394861.17530.121895
120.0405190.34140.3669
130.0884720.74550.229222
14-0.02862-0.24120.405064
150.1809931.52510.065841
160.1019130.85870.196688
17-0.088645-0.74690.228785
18-0.093445-0.78740.21684
19-0.159173-1.34120.092063
200.0450370.37950.352728
21-0.087385-0.73630.23198
220.1572631.32510.094689
230.0361220.30440.380869
24-0.011233-0.09470.462429
25-0.085532-0.72070.236729
260.0936150.78880.216424
27-0.001373-0.01160.4954
28-0.017549-0.14790.441432
29-0.092064-0.77570.220238
30-0.05272-0.44420.329116
310.0046440.03910.484449
32-0.078995-0.66560.253905
330.151251.27450.103329
340.0122260.1030.45912
35-0.118517-0.99860.160679
360.0358830.30240.381632
37-0.024119-0.20320.41977
38-0.130478-1.09940.137648
390.0398660.33590.368963
40-0.036215-0.30520.380571
41-0.006702-0.05650.477563
42-0.112479-0.94780.173233
430.0024490.02060.491796
44-0.1247-1.05070.14847
450.0286680.24160.404909
46-0.046643-0.3930.347741
47-0.040319-0.33970.367531
48-0.016746-0.14110.444094

\begin{tabular}{lllllllll}
\hline
Partial Autocorrelation Function \tabularnewline
Time lag k & PACF(k) & T-STAT & P-value \tabularnewline
1 & 0.095756 & 0.8069 & 0.211221 \tabularnewline
2 & -0.230692 & -1.9438 & 0.027939 \tabularnewline
3 & 0.119752 & 1.009 & 0.158189 \tabularnewline
4 & -0.048856 & -0.4117 & 0.340912 \tabularnewline
5 & -0.136974 & -1.1542 & 0.126151 \tabularnewline
6 & 0.053817 & 0.4535 & 0.325796 \tabularnewline
7 & 0.012091 & 0.1019 & 0.459568 \tabularnewline
8 & -0.065456 & -0.5515 & 0.291498 \tabularnewline
9 & 0.073974 & 0.6233 & 0.267537 \tabularnewline
10 & -0.190415 & -1.6045 & 0.056525 \tabularnewline
11 & 0.139486 & 1.1753 & 0.121895 \tabularnewline
12 & 0.040519 & 0.3414 & 0.3669 \tabularnewline
13 & 0.088472 & 0.7455 & 0.229222 \tabularnewline
14 & -0.02862 & -0.2412 & 0.405064 \tabularnewline
15 & 0.180993 & 1.5251 & 0.065841 \tabularnewline
16 & 0.101913 & 0.8587 & 0.196688 \tabularnewline
17 & -0.088645 & -0.7469 & 0.228785 \tabularnewline
18 & -0.093445 & -0.7874 & 0.21684 \tabularnewline
19 & -0.159173 & -1.3412 & 0.092063 \tabularnewline
20 & 0.045037 & 0.3795 & 0.352728 \tabularnewline
21 & -0.087385 & -0.7363 & 0.23198 \tabularnewline
22 & 0.157263 & 1.3251 & 0.094689 \tabularnewline
23 & 0.036122 & 0.3044 & 0.380869 \tabularnewline
24 & -0.011233 & -0.0947 & 0.462429 \tabularnewline
25 & -0.085532 & -0.7207 & 0.236729 \tabularnewline
26 & 0.093615 & 0.7888 & 0.216424 \tabularnewline
27 & -0.001373 & -0.0116 & 0.4954 \tabularnewline
28 & -0.017549 & -0.1479 & 0.441432 \tabularnewline
29 & -0.092064 & -0.7757 & 0.220238 \tabularnewline
30 & -0.05272 & -0.4442 & 0.329116 \tabularnewline
31 & 0.004644 & 0.0391 & 0.484449 \tabularnewline
32 & -0.078995 & -0.6656 & 0.253905 \tabularnewline
33 & 0.15125 & 1.2745 & 0.103329 \tabularnewline
34 & 0.012226 & 0.103 & 0.45912 \tabularnewline
35 & -0.118517 & -0.9986 & 0.160679 \tabularnewline
36 & 0.035883 & 0.3024 & 0.381632 \tabularnewline
37 & -0.024119 & -0.2032 & 0.41977 \tabularnewline
38 & -0.130478 & -1.0994 & 0.137648 \tabularnewline
39 & 0.039866 & 0.3359 & 0.368963 \tabularnewline
40 & -0.036215 & -0.3052 & 0.380571 \tabularnewline
41 & -0.006702 & -0.0565 & 0.477563 \tabularnewline
42 & -0.112479 & -0.9478 & 0.173233 \tabularnewline
43 & 0.002449 & 0.0206 & 0.491796 \tabularnewline
44 & -0.1247 & -1.0507 & 0.14847 \tabularnewline
45 & 0.028668 & 0.2416 & 0.404909 \tabularnewline
46 & -0.046643 & -0.393 & 0.347741 \tabularnewline
47 & -0.040319 & -0.3397 & 0.367531 \tabularnewline
48 & -0.016746 & -0.1411 & 0.444094 \tabularnewline
\hline
\end{tabular}
%Source: https://freestatistics.org/blog/index.php?pk=145827&T=2

[TABLE]
[ROW][C]Partial Autocorrelation Function[/C][/ROW]
[ROW][C]Time lag k[/C][C]PACF(k)[/C][C]T-STAT[/C][C]P-value[/C][/ROW]
[ROW][C]1[/C][C]0.095756[/C][C]0.8069[/C][C]0.211221[/C][/ROW]
[ROW][C]2[/C][C]-0.230692[/C][C]-1.9438[/C][C]0.027939[/C][/ROW]
[ROW][C]3[/C][C]0.119752[/C][C]1.009[/C][C]0.158189[/C][/ROW]
[ROW][C]4[/C][C]-0.048856[/C][C]-0.4117[/C][C]0.340912[/C][/ROW]
[ROW][C]5[/C][C]-0.136974[/C][C]-1.1542[/C][C]0.126151[/C][/ROW]
[ROW][C]6[/C][C]0.053817[/C][C]0.4535[/C][C]0.325796[/C][/ROW]
[ROW][C]7[/C][C]0.012091[/C][C]0.1019[/C][C]0.459568[/C][/ROW]
[ROW][C]8[/C][C]-0.065456[/C][C]-0.5515[/C][C]0.291498[/C][/ROW]
[ROW][C]9[/C][C]0.073974[/C][C]0.6233[/C][C]0.267537[/C][/ROW]
[ROW][C]10[/C][C]-0.190415[/C][C]-1.6045[/C][C]0.056525[/C][/ROW]
[ROW][C]11[/C][C]0.139486[/C][C]1.1753[/C][C]0.121895[/C][/ROW]
[ROW][C]12[/C][C]0.040519[/C][C]0.3414[/C][C]0.3669[/C][/ROW]
[ROW][C]13[/C][C]0.088472[/C][C]0.7455[/C][C]0.229222[/C][/ROW]
[ROW][C]14[/C][C]-0.02862[/C][C]-0.2412[/C][C]0.405064[/C][/ROW]
[ROW][C]15[/C][C]0.180993[/C][C]1.5251[/C][C]0.065841[/C][/ROW]
[ROW][C]16[/C][C]0.101913[/C][C]0.8587[/C][C]0.196688[/C][/ROW]
[ROW][C]17[/C][C]-0.088645[/C][C]-0.7469[/C][C]0.228785[/C][/ROW]
[ROW][C]18[/C][C]-0.093445[/C][C]-0.7874[/C][C]0.21684[/C][/ROW]
[ROW][C]19[/C][C]-0.159173[/C][C]-1.3412[/C][C]0.092063[/C][/ROW]
[ROW][C]20[/C][C]0.045037[/C][C]0.3795[/C][C]0.352728[/C][/ROW]
[ROW][C]21[/C][C]-0.087385[/C][C]-0.7363[/C][C]0.23198[/C][/ROW]
[ROW][C]22[/C][C]0.157263[/C][C]1.3251[/C][C]0.094689[/C][/ROW]
[ROW][C]23[/C][C]0.036122[/C][C]0.3044[/C][C]0.380869[/C][/ROW]
[ROW][C]24[/C][C]-0.011233[/C][C]-0.0947[/C][C]0.462429[/C][/ROW]
[ROW][C]25[/C][C]-0.085532[/C][C]-0.7207[/C][C]0.236729[/C][/ROW]
[ROW][C]26[/C][C]0.093615[/C][C]0.7888[/C][C]0.216424[/C][/ROW]
[ROW][C]27[/C][C]-0.001373[/C][C]-0.0116[/C][C]0.4954[/C][/ROW]
[ROW][C]28[/C][C]-0.017549[/C][C]-0.1479[/C][C]0.441432[/C][/ROW]
[ROW][C]29[/C][C]-0.092064[/C][C]-0.7757[/C][C]0.220238[/C][/ROW]
[ROW][C]30[/C][C]-0.05272[/C][C]-0.4442[/C][C]0.329116[/C][/ROW]
[ROW][C]31[/C][C]0.004644[/C][C]0.0391[/C][C]0.484449[/C][/ROW]
[ROW][C]32[/C][C]-0.078995[/C][C]-0.6656[/C][C]0.253905[/C][/ROW]
[ROW][C]33[/C][C]0.15125[/C][C]1.2745[/C][C]0.103329[/C][/ROW]
[ROW][C]34[/C][C]0.012226[/C][C]0.103[/C][C]0.45912[/C][/ROW]
[ROW][C]35[/C][C]-0.118517[/C][C]-0.9986[/C][C]0.160679[/C][/ROW]
[ROW][C]36[/C][C]0.035883[/C][C]0.3024[/C][C]0.381632[/C][/ROW]
[ROW][C]37[/C][C]-0.024119[/C][C]-0.2032[/C][C]0.41977[/C][/ROW]
[ROW][C]38[/C][C]-0.130478[/C][C]-1.0994[/C][C]0.137648[/C][/ROW]
[ROW][C]39[/C][C]0.039866[/C][C]0.3359[/C][C]0.368963[/C][/ROW]
[ROW][C]40[/C][C]-0.036215[/C][C]-0.3052[/C][C]0.380571[/C][/ROW]
[ROW][C]41[/C][C]-0.006702[/C][C]-0.0565[/C][C]0.477563[/C][/ROW]
[ROW][C]42[/C][C]-0.112479[/C][C]-0.9478[/C][C]0.173233[/C][/ROW]
[ROW][C]43[/C][C]0.002449[/C][C]0.0206[/C][C]0.491796[/C][/ROW]
[ROW][C]44[/C][C]-0.1247[/C][C]-1.0507[/C][C]0.14847[/C][/ROW]
[ROW][C]45[/C][C]0.028668[/C][C]0.2416[/C][C]0.404909[/C][/ROW]
[ROW][C]46[/C][C]-0.046643[/C][C]-0.393[/C][C]0.347741[/C][/ROW]
[ROW][C]47[/C][C]-0.040319[/C][C]-0.3397[/C][C]0.367531[/C][/ROW]
[ROW][C]48[/C][C]-0.016746[/C][C]-0.1411[/C][C]0.444094[/C][/ROW]
[/TABLE]
Source: https://freestatistics.org/blog/index.php?pk=145827&T=2

Globally Unique Identifier (entire table): ba.freestatistics.org/blog/index.php?pk=145827&T=2

As an alternative you can also use a QR Code:  

The GUIDs for individual cells are displayed in the table below:

Partial Autocorrelation Function
Time lag kPACF(k)T-STATP-value
10.0957560.80690.211221
2-0.230692-1.94380.027939
30.1197521.0090.158189
4-0.048856-0.41170.340912
5-0.136974-1.15420.126151
60.0538170.45350.325796
70.0120910.10190.459568
8-0.065456-0.55150.291498
90.0739740.62330.267537
10-0.190415-1.60450.056525
110.1394861.17530.121895
120.0405190.34140.3669
130.0884720.74550.229222
14-0.02862-0.24120.405064
150.1809931.52510.065841
160.1019130.85870.196688
17-0.088645-0.74690.228785
18-0.093445-0.78740.21684
19-0.159173-1.34120.092063
200.0450370.37950.352728
21-0.087385-0.73630.23198
220.1572631.32510.094689
230.0361220.30440.380869
24-0.011233-0.09470.462429
25-0.085532-0.72070.236729
260.0936150.78880.216424
27-0.001373-0.01160.4954
28-0.017549-0.14790.441432
29-0.092064-0.77570.220238
30-0.05272-0.44420.329116
310.0046440.03910.484449
32-0.078995-0.66560.253905
330.151251.27450.103329
340.0122260.1030.45912
35-0.118517-0.99860.160679
360.0358830.30240.381632
37-0.024119-0.20320.41977
38-0.130478-1.09940.137648
390.0398660.33590.368963
40-0.036215-0.30520.380571
41-0.006702-0.05650.477563
42-0.112479-0.94780.173233
430.0024490.02060.491796
44-0.1247-1.05070.14847
450.0286680.24160.404909
46-0.046643-0.3930.347741
47-0.040319-0.33970.367531
48-0.016746-0.14110.444094


Parameters (Session):
par1 = 48 ; par2 = 1 ; par3 = 1 ; par4 = 0 ; par5 = 12 ; par6 = White Noise ; par7 = 0.95 ;
Parameters (R input):
par1 = 48 ; par2 = 1 ; par3 = 1 ; par4 = 0 ; par5 = 12 ; par6 = White Noise ; par7 = 0.95 ; par8 = ;
R code (references can be found in the software module):
if (par1 == 'Default') {
par1 = 10*log10(length(x))
} else {
par1 <- as.numeric(par1)
}
par2 <- as.numeric(par2)
par3 <- as.numeric(par3)
par4 <- as.numeric(par4)
par5 <- as.numeric(par5)
if (par6 == 'White Noise') par6 <- 'white' else par6 <- 'ma'
par7 <- as.numeric(par7)
if (par8 != '') par8 <- as.numeric(par8)
ox <- x
if (par8 == '') {
if (par2 == 0) {
x <- log(x)
} else {
x <- (x ^ par2 - 1) / par2
}
} else {
x <- log(x,base=par8)
}
if (par3 > 0) x <- diff(x,lag=1,difference=par3)
if (par4 > 0) x <- diff(x,lag=par5,difference=par4)
bitmap(file='picts.png')
op <- par(mfrow=c(2,1))
plot(ox,type='l',main='Original Time Series',xlab='time',ylab='value')
if (par8=='') {
mytitle <- paste('Working Time Series (lambda=',par2,', d=',par3,', D=',par4,')',sep='')
mysub <- paste('(lambda=',par2,', d=',par3,', D=',par4,', CI=', par7, ', CI type=',par6,')',sep='')
} else {
mytitle <- paste('Working Time Series (base=',par8,', d=',par3,', D=',par4,')',sep='')
mysub <- paste('(base=',par8,', d=',par3,', D=',par4,', CI=', par7, ', CI type=',par6,')',sep='')
}
plot(x,type='l', main=mytitle,xlab='time',ylab='value')
par(op)
dev.off()
bitmap(file='pic1.png')
racf <- acf(x, par1, main='Autocorrelation', xlab='time lag', ylab='ACF', ci.type=par6, ci=par7, sub=mysub)
dev.off()
bitmap(file='pic2.png')
rpacf <- pacf(x,par1,main='Partial Autocorrelation',xlab='lags',ylab='PACF',sub=mysub)
dev.off()
(myacf <- c(racf$acf))
(mypacf <- c(rpacf$acf))
lengthx <- length(x)
sqrtn <- sqrt(lengthx)
load(file='createtable')
a<-table.start()
a<-table.row.start(a)
a<-table.element(a,'Autocorrelation Function',4,TRUE)
a<-table.row.end(a)
a<-table.row.start(a)
a<-table.element(a,'Time lag k',header=TRUE)
a<-table.element(a,hyperlink('basics.htm','ACF(k)','click here for more information about the Autocorrelation Function'),header=TRUE)
a<-table.element(a,'T-STAT',header=TRUE)
a<-table.element(a,'P-value',header=TRUE)
a<-table.row.end(a)
for (i in 2:(par1+1)) {
a<-table.row.start(a)
a<-table.element(a,i-1,header=TRUE)
a<-table.element(a,round(myacf[i],6))
mytstat <- myacf[i]*sqrtn
a<-table.element(a,round(mytstat,4))
a<-table.element(a,round(1-pt(abs(mytstat),lengthx),6))
a<-table.row.end(a)
}
a<-table.end(a)
table.save(a,file='mytable.tab')
a<-table.start()
a<-table.row.start(a)
a<-table.element(a,'Partial Autocorrelation Function',4,TRUE)
a<-table.row.end(a)
a<-table.row.start(a)
a<-table.element(a,'Time lag k',header=TRUE)
a<-table.element(a,hyperlink('basics.htm','PACF(k)','click here for more information about the Partial Autocorrelation Function'),header=TRUE)
a<-table.element(a,'T-STAT',header=TRUE)
a<-table.element(a,'P-value',header=TRUE)
a<-table.row.end(a)
for (i in 1:par1) {
a<-table.row.start(a)
a<-table.element(a,i,header=TRUE)
a<-table.element(a,round(mypacf[i],6))
mytstat <- mypacf[i]*sqrtn
a<-table.element(a,round(mytstat,4))
a<-table.element(a,round(1-pt(abs(mytstat),lengthx),6))
a<-table.row.end(a)
}
a<-table.end(a)
table.save(a,file='mytable1.tab')