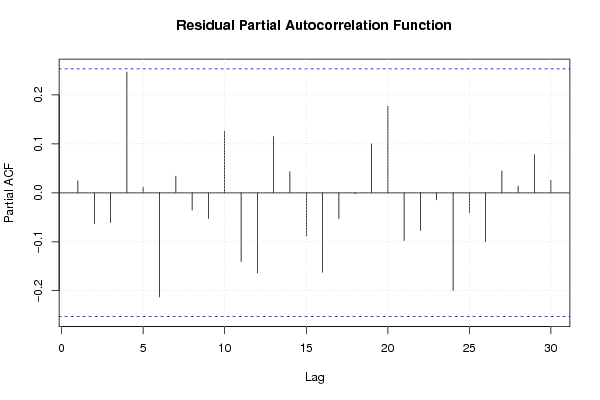
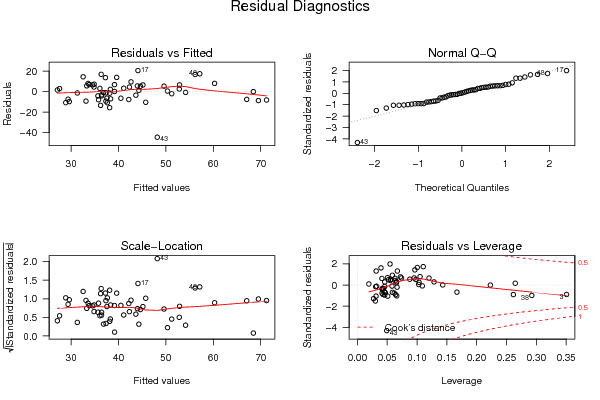
| Multiple Linear Regression - Estimated Regression Equation |
| rating[t] = + 99.7465175437067 -0.0259260786851935fat[t] + 0.0490031953731906sugars[t] -0.533827627418403calories[t] -1.4235803508721shelf[t] + e[t] |
| Multiple Linear Regression - Ordinary Least Squares | |||||
| Variable | Parameter | S.D. | T-STAT H0: parameter = 0 | 2-tail p-value | 1-tail p-value |
| (Intercept) | 99.7465175437067 | 10.531564 | 9.4712 | 0 | 0 |
| fat | -0.0259260786851935 | 0.017501 | -1.4814 | 0.144212 | 0.072106 |
| sugars | 0.0490031953731906 | 0.02199 | 2.2284 | 0.029962 | 0.014981 |
| calories | -0.533827627418403 | 0.099197 | -5.3815 | 2e-06 | 1e-06 |
| shelf | -1.4235803508721 | 1.690679 | -0.842 | 0.403425 | 0.201713 |
| Multiple Linear Regression - Regression Statistics | |
| Multiple R | 0.714665117106891 |
| R-squared | 0.510746229609406 |
| Adjusted R-squared | 0.475164137217363 |
| F-TEST (value) | 14.3540246026571 |
| F-TEST (DF numerator) | 4 |
| F-TEST (DF denominator) | 55 |
| p-value | 4.36111182722243e-08 |
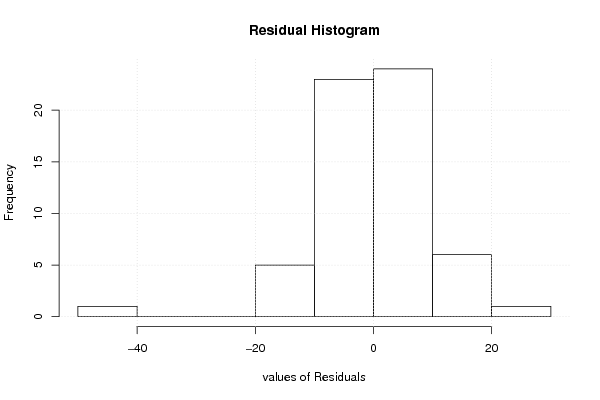
| Multiple Linear Regression - Residual Statistics | |
| Residual Standard Deviation | 10.570214921725 |
| Sum Squared Residuals | 6145.11939203018 |
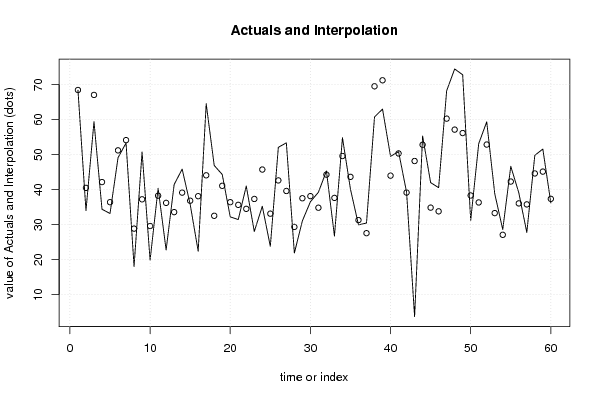
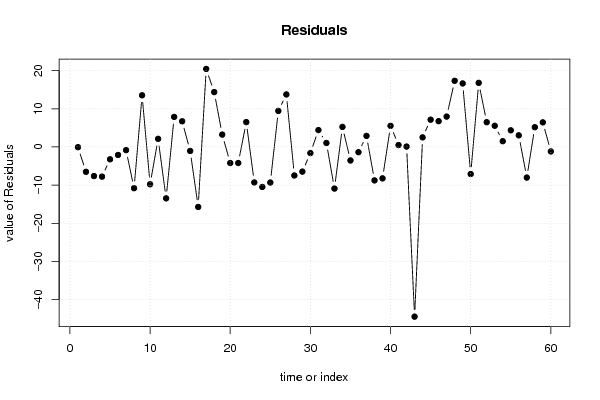
| Multiple Linear Regression - Actuals, Interpolation, and Residuals | |||
| Time or Index | Actuals | Interpolation Forecast | Residuals Prediction Error |
| 1 | 68.402973 | 68.4583470472202 | -0.0553740472201881 |
| 2 | 33.983679 | 40.4901620977291 | -6.50648309772911 |
| 3 | 59.425505 | 67.0480846330729 | -7.62257963307288 |
| 4 | 34.384843 | 42.1591873087357 | -7.77434430873573 |
| 5 | 33.174094 | 36.4076538514847 | -3.23355985148475 |
| 6 | 49.120253 | 51.2186344097885 | -2.0983814097885 |
| 7 | 53.313813 | 54.1445813221939 | -0.830768322193942 |
| 8 | 18.042851 | 28.8514160790733 | -10.8085650790733 |
| 9 | 50.765 | 37.2286708722892 | 13.5363291277108 |
| 10 | 19.823573 | 29.6007088196571 | -9.77713581965713 |
| 11 | 40.400208 | 38.270421973324 | 2.12978602667597 |
| 12 | 22.736446 | 36.2067994081289 | -13.4703534081289 |
| 13 | 41.445019 | 33.5676760292859 | 7.87734297071409 |
| 14 | 45.863324 | 39.1367234703499 | 6.72660052965009 |
| 15 | 35.782791 | 36.8250346517346 | -1.04224365173461 |
| 16 | 22.396513 | 38.1204117127329 | -15.7238987127329 |
| 17 | 64.533816 | 44.0911680405086 | 20.4426479594914 |
| 18 | 46.895644 | 32.5210960255193 | 14.3745479744807 |
| 19 | 44.330856 | 41.0873144289186 | 3.24354157108138 |
| 20 | 32.207582 | 36.4076538514848 | -4.20007185148475 |
| 21 | 31.435973 | 35.6417623241014 | -4.20578932410139 |
| 22 | 41.015492 | 34.5048094373419 | 6.51068256265815 |
| 23 | 28.025765 | 37.326957438639 | -9.30119243863896 |
| 24 | 35.252444 | 45.7336287250883 | -10.4811847250883 |
| 25 | 23.804043 | 33.1241595858776 | -9.32011658587762 |
| 26 | 52.076897 | 42.6286343400443 | 9.44826265995575 |
| 27 | 53.371007 | 39.6047523839146 | 13.7662546160854 |
| 28 | 21.871292 | 29.3414480328052 | -7.4701560328052 |
| 29 | 31.072217 | 37.5306660890991 | -6.4584490890991 |
| 30 | 36.523683 | 38.1346565227189 | -1.61097352271886 |
| 31 | 39.241114 | 34.8212455335876 | 4.41986846641237 |
| 32 | 45.328074 | 44.2829858577963 | 1.04508814220368 |
| 33 | 26.734515 | 37.630379759001 | -10.895864759001 |
| 34 | 54.850917 | 49.5954780114475 | 5.25543898855255 |
| 35 | 40.105965 | 43.6467247238389 | -3.54075972383893 |
| 36 | 29.924285 | 31.2977947673672 | -1.37350976736715 |
| 37 | 30.450843 | 27.551134994998 | 2.89970800500197 |
| 38 | 60.756112 | 69.5194430507681 | -8.76333105076812 |
| 39 | 63.005645 | 71.2345548888298 | -8.22890988882979 |
| 40 | 49.511874 | 43.9833446178 | 5.52852938220002 |
| 41 | 50.828392 | 50.3305259420453 | 0.497866057954691 |
| 42 | 39.259197 | 39.1563319174293 | 0.102865082570706 |
| 43 | 3.7034 | 48.1709707873139 | -44.4675707873139 |
| 44 | 55.333142 | 52.8216415144851 | 2.51150048551487 |
| 45 | 41.998933 | 34.8497351535596 | 7.1491978464404 |
| 46 | 40.560159 | 33.7984471961659 | 6.76171180383412 |
| 47 | 68.235885 | 60.2720305598155 | 7.96385444018449 |
| 48 | 74.472949 | 57.1388980774251 | 17.3340509225749 |
| 49 | 72.801787 | 56.1588341699612 | 16.6429528300388 |
| 50 | 31.230054 | 38.3236201329023 | -7.0935661329023 |
| 51 | 53.131324 | 36.3340758247413 | 16.7972481752587 |
| 52 | 59.363993 | 52.8762667776155 | 6.48772622238448 |
| 53 | 38.839746 | 33.2846335760891 | 5.55511242391091 |
| 54 | 28.592785 | 27.0846886381611 | 1.5080963618389 |
| 55 | 46.658844 | 42.2981495032624 | 4.3606944967376 |
| 56 | 39.106174 | 36.0605702279034 | 3.04560377209662 |
| 57 | 27.753301 | 35.7737466943409 | -8.02044569434089 |
| 58 | 49.787445 | 44.6125438213168 | 5.17490117868324 |
| 59 | 51.592193 | 45.1453102050066 | 6.44688279499339 |
| 60 | 36.187559 | 37.3568741621631 | -1.16931516216306 |
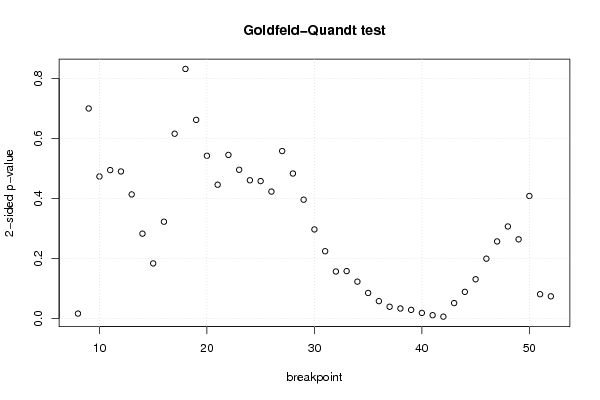
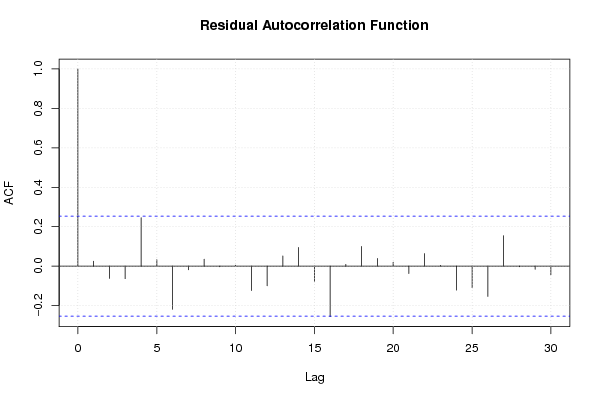
| Goldfeld-Quandt test for Heteroskedasticity | |||
| p-values | Alternative Hypothesis | ||
| breakpoint index | greater | 2-sided | less |
| 8 | 0.00786679526371612 | 0.0157335905274322 | 0.992133204736284 |
| 9 | 0.350323651284501 | 0.700647302569002 | 0.649676348715499 |
| 10 | 0.236758379072396 | 0.473516758144792 | 0.763241620927604 |
| 11 | 0.247480523893016 | 0.494961047786032 | 0.752519476106984 |
| 12 | 0.245173477638795 | 0.49034695527759 | 0.754826522361205 |
| 13 | 0.206822901369129 | 0.413645802738259 | 0.793177098630871 |
| 14 | 0.141295386729402 | 0.282590773458803 | 0.858704613270598 |
| 15 | 0.0916366560569073 | 0.183273312113815 | 0.908363343943093 |
| 16 | 0.161240642623229 | 0.322481285246458 | 0.838759357376771 |
| 17 | 0.308153292314627 | 0.616306584629255 | 0.691846707685373 |
| 18 | 0.416335266866758 | 0.832670533733516 | 0.583664733133242 |
| 19 | 0.331254761531101 | 0.662509523062202 | 0.668745238468899 |
| 20 | 0.271357133959952 | 0.542714267919904 | 0.728642866040048 |
| 21 | 0.223036123242768 | 0.446072246485536 | 0.776963876757232 |
| 22 | 0.272791291432651 | 0.545582582865302 | 0.727208708567349 |
| 23 | 0.247980925764442 | 0.495961851528885 | 0.752019074235558 |
| 24 | 0.230487535929262 | 0.460975071858524 | 0.769512464070738 |
| 25 | 0.229115786839483 | 0.458231573678965 | 0.770884213160517 |
| 26 | 0.211540218891582 | 0.423080437783165 | 0.788459781108418 |
| 27 | 0.279259271578182 | 0.558518543156365 | 0.720740728421818 |
| 28 | 0.241730189732307 | 0.483460379464613 | 0.758269810267693 |
| 29 | 0.198015514532358 | 0.396031029064716 | 0.801984485467642 |
| 30 | 0.148401404064669 | 0.296802808129337 | 0.851598595935331 |
| 31 | 0.111953989349414 | 0.223907978698828 | 0.888046010650586 |
| 32 | 0.0781495607523388 | 0.156299121504678 | 0.921850439247661 |
| 33 | 0.0787497275095415 | 0.157499455019083 | 0.921250272490459 |
| 34 | 0.0611741667321448 | 0.12234833346429 | 0.938825833267855 |
| 35 | 0.0422790002841196 | 0.0845580005682392 | 0.95772099971588 |
| 36 | 0.0286444198594012 | 0.0572888397188024 | 0.971355580140599 |
| 37 | 0.0192532075304874 | 0.0385064150609748 | 0.980746792469513 |
| 38 | 0.016373660447564 | 0.032747320895128 | 0.983626339552436 |
| 39 | 0.014075266864488 | 0.0281505337289761 | 0.985924733135512 |
| 40 | 0.00893840681085123 | 0.0178768136217025 | 0.991061593189149 |
| 41 | 0.00514426333452174 | 0.0102885266690435 | 0.994855736665478 |
| 42 | 0.00273840834606752 | 0.00547681669213505 | 0.997261591653932 |
| 43 | 0.97460039423641 | 0.050799211527181 | 0.0253996057635905 |
| 44 | 0.955858614911662 | 0.0882827701766766 | 0.0441413850883383 |
| 45 | 0.934821787779597 | 0.130356424440806 | 0.0651782122204029 |
| 46 | 0.900454642187978 | 0.199090715624043 | 0.0995453578120216 |
| 47 | 0.871685862152996 | 0.256628275694009 | 0.128314137847004 |
| 48 | 0.846662690099481 | 0.306674619801037 | 0.153337309900519 |
| 49 | 0.868130147497836 | 0.263739705004328 | 0.131869852502164 |
| 50 | 0.795796225024697 | 0.408407549950606 | 0.204203774975303 |
| 51 | 0.959822709596215 | 0.0803545808075691 | 0.0401772904037846 |
| 52 | 0.963303478908947 | 0.0733930421821065 | 0.0366965210910532 |
| Meta Analysis of Goldfeld-Quandt test for Heteroskedasticity | |||
| Description | # significant tests | % significant tests | OK/NOK |
| 1% type I error level | 1 | 0.0222222222222222 | NOK |
| 5% type I error level | 7 | 0.155555555555556 | NOK |
| 10% type I error level | 13 | 0.288888888888889 | NOK |