| Multiple Linear Regression - Estimated Regression Equation |
| Change[t] = + 0.424397081030911 -0.0175775787246776Size[t] + 0.0436542336017371Complex[t] + 0.134765540998012Big4[t] + 0.203098887510866Product[t] + e[t] |
| Multiple Linear Regression - Ordinary Least Squares | |||||
| Variable | Parameter | S.D. | T-STAT H0: parameter = 0 | 2-tail p-value | 1-tail p-value |
| (Intercept) | 0.424397081030911 | 0.241998 | 1.7537 | 0.084672 | 0.042336 |
| Size | -0.0175775787246776 | 0.026623 | -0.6602 | 0.511674 | 0.255837 |
| Complex | 0.0436542336017371 | 0.040058 | 1.0898 | 0.280247 | 0.140123 |
| Big4 | 0.134765540998012 | 0.183822 | 0.7331 | 0.466382 | 0.233191 |
| Product | 0.203098887510866 | 0.135447 | 1.4995 | 0.139082 | 0.069541 |
| Multiple Linear Regression - Regression Statistics | |
| Multiple R | 0.251781016634972 |
| R-squared | 0.0633936803377403 |
| Adjusted R-squared | -0.000105053198684146 |
| F-TEST (value) | 0.998345585922216 |
| F-TEST (DF numerator) | 4 |
| F-TEST (DF denominator) | 59 |
| p-value | 0.415750762723599 |
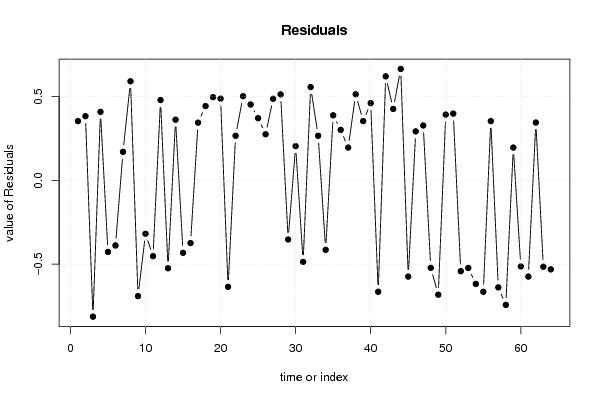
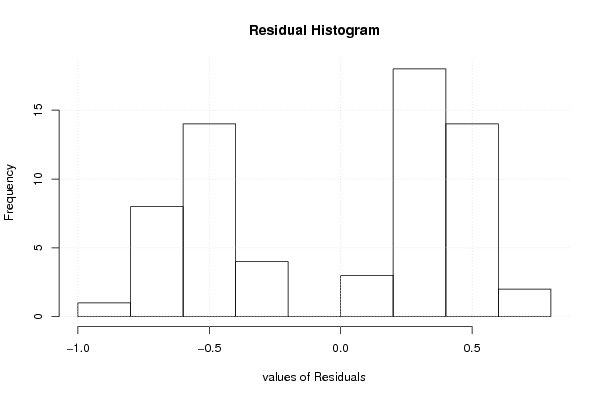
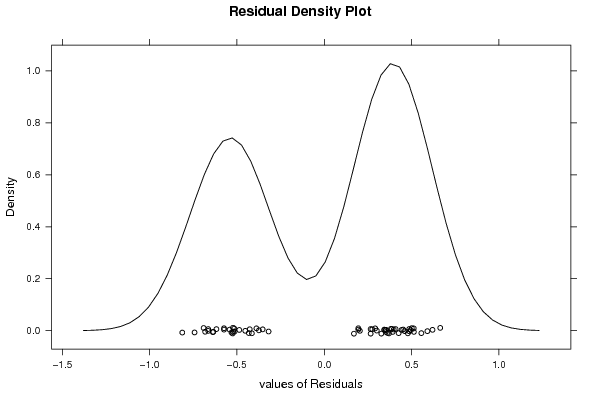
| Multiple Linear Regression - Residual Statistics | |
| Residual Standard Deviation | 0.497788997416356 |
| Sum Squared Residuals | 14.6198392709781 |
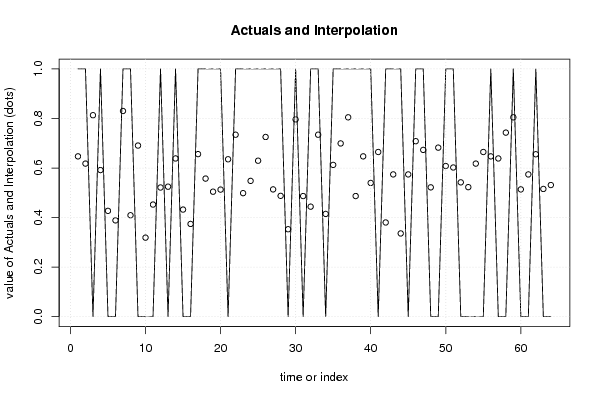
| Multiple Linear Regression - Actuals, Interpolation, and Residuals | |||
| Time or Index | Actuals | Interpolation Forecast | Residuals Prediction Error |
| 1 | 1 | 0.647138108199514 | 0.352861891800486 |
| 2 | 1 | 0.617838039549568 | 0.382161960450432 |
| 3 | 0 | 0.813255966454081 | -0.813255966454081 |
| 4 | 1 | 0.591761384672509 | 0.408238615327491 |
| 5 | 0 | 0.427041068383884 | -0.427041068383884 |
| 6 | 0 | 0.388662497161642 | -0.388662497161642 |
| 7 | 1 | 0.830254118758845 | 0.169745881241155 |
| 8 | 1 | 0.409463489659207 | 0.590536510340793 |
| 9 | 0 | 0.690792341801252 | -0.690792341801252 |
| 10 | 0 | 0.318931608682845 | -0.318931608682845 |
| 11 | 0 | 0.45253829684103 | -0.45253829684103 |
| 12 | 1 | 0.521451069773798 | 0.478548930226202 |
| 13 | 0 | 0.524674483546685 | -0.524674483546685 |
| 14 | 1 | 0.638639032047132 | 0.361360967952867 |
| 15 | 0 | 0.432316730763379 | -0.432316730763379 |
| 16 | 0 | 0.374308332209851 | -0.374308332209851 |
| 17 | 1 | 0.65621661077181 | 0.34378338922819 |
| 18 | 1 | 0.557424342769182 | 0.442575657230818 |
| 19 | 1 | 0.504452917469034 | 0.495547082530966 |
| 20 | 1 | 0.512951993621416 | 0.487048006378584 |
| 21 | 0 | 0.635415618274246 | -0.635415618274246 |
| 22 | 1 | 0.734446575402989 | 0.265553424597011 |
| 23 | 1 | 0.498597828669625 | 0.501402171330375 |
| 24 | 1 | 0.548107151070772 | 0.451892848929228 |
| 25 | 1 | 0.629560529474837 | 0.370439470525163 |
| 26 | 1 | 0.725368072830693 | 0.274631927169307 |
| 27 | 1 | 0.513770109167445 | 0.486229890832555 |
| 28 | 1 | 0.487693454290385 | 0.512306545709615 |
| 29 | 0 | 0.352927913292373 | -0.352927913292373 |
| 30 | 1 | 0.796257814149317 | 0.203742185850683 |
| 31 | 0 | 0.486875338744357 | -0.486875338744357 |
| 32 | 1 | 0.444039220688648 | 0.555960779311352 |
| 33 | 1 | 0.734446575402989 | 0.265553424597011 |
| 34 | 0 | 0.414739152038702 | -0.414739152038702 |
| 35 | 1 | 0.612562377170073 | 0.387437622829927 |
| 36 | 1 | 0.699291417953634 | 0.300708582046366 |
| 37 | 1 | 0.804756890301699 | 0.195243109698301 |
| 38 | 1 | 0.486875338744357 | 0.513124661255643 |
| 39 | 1 | 0.647138108199514 | 0.352861891800486 |
| 40 | 1 | 0.539846764044504 | 0.460153235955496 |
| 41 | 0 | 0.664715686924192 | -0.664715686924192 |
| 42 | 1 | 0.38016342100926 | 0.61983657899074 |
| 43 | 1 | 0.574183805947831 | 0.425816194052169 |
| 44 | 1 | 0.335929760987609 | 0.664070239012391 |
| 45 | 0 | 0.574183805947831 | -0.574183805947831 |
| 46 | 1 | 0.708369920525929 | 0.291630079474071 |
| 47 | 1 | 0.673214763076574 | 0.326785236923426 |
| 48 | 0 | 0.522030496193712 | -0.522030496193712 |
| 49 | 0 | 0.68229326564887 | -0.68229326564887 |
| 50 | 1 | 0.608180110557359 | 0.391819889442641 |
| 51 | 1 | 0.602237429210746 | 0.397762570789254 |
| 52 | 0 | 0.542252062271363 | -0.542252062271363 |
| 53 | 0 | 0.52284861173974 | -0.52284861173974 |
| 54 | 0 | 0.617838039549568 | -0.617838039549568 |
| 55 | 0 | 0.664715686924192 | -0.664715686924192 |
| 56 | 1 | 0.647138108199514 | 0.352861891800486 |
| 57 | 0 | 0.638639032047133 | -0.638639032047133 |
| 58 | 0 | 0.742945651555371 | -0.742945651555371 |
| 59 | 1 | 0.804756890301699 | 0.195243109698301 |
| 60 | 0 | 0.513770109167445 | -0.513770109167445 |
| 61 | 0 | 0.574183805947831 | -0.574183805947831 |
| 62 | 1 | 0.655637184351896 | 0.344362815648104 |
| 63 | 0 | 0.515595980974389 | -0.515595980974389 |
| 64 | 0 | 0.531347687892122 | -0.531347687892122 |
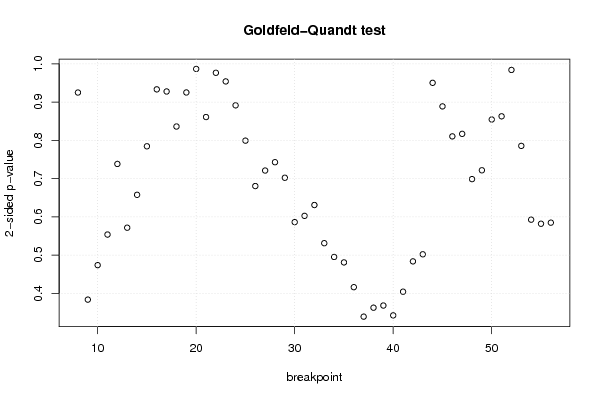
| Goldfeld-Quandt test for Heteroskedasticity | |||
| p-values | Alternative Hypothesis | ||
| breakpoint index | greater | 2-sided | less |
| 8 | 0.537453357623604 | 0.925093284752792 | 0.462546642376396 |
| 9 | 0.808256295442997 | 0.383487409114007 | 0.191743704557003 |
| 10 | 0.763172298266427 | 0.473655403467145 | 0.236827701733573 |
| 11 | 0.723156857118868 | 0.553686285762265 | 0.276843142881132 |
| 12 | 0.630835284181822 | 0.738329431636356 | 0.369164715818178 |
| 13 | 0.714239556792357 | 0.571520886415287 | 0.285760443207643 |
| 14 | 0.671214848888019 | 0.657570302223963 | 0.328785151111981 |
| 15 | 0.607742941413697 | 0.784514117172605 | 0.392257058586302 |
| 16 | 0.533287990621247 | 0.933424018757506 | 0.466712009378753 |
| 17 | 0.463920566285529 | 0.927841132571058 | 0.536079433714471 |
| 18 | 0.581900923649165 | 0.836198152701671 | 0.418099076350835 |
| 19 | 0.537394798855697 | 0.925210402288606 | 0.462605201144303 |
| 20 | 0.493378671524347 | 0.986757343048694 | 0.506621328475653 |
| 21 | 0.569489032476337 | 0.861021935047325 | 0.430510967523663 |
| 22 | 0.511639989001899 | 0.976720021996203 | 0.488360010998101 |
| 23 | 0.477075336383987 | 0.954150672767974 | 0.522924663616013 |
| 24 | 0.445795867245346 | 0.891591734490692 | 0.554204132754654 |
| 25 | 0.399602380546096 | 0.799204761092191 | 0.600397619453904 |
| 26 | 0.340246638188272 | 0.680493276376544 | 0.659753361811728 |
| 27 | 0.360536687834188 | 0.721073375668376 | 0.639463312165812 |
| 28 | 0.371431249602841 | 0.742862499205682 | 0.628568750397159 |
| 29 | 0.351096364657258 | 0.702192729314516 | 0.648903635342742 |
| 30 | 0.29308269493029 | 0.586165389860581 | 0.70691730506971 |
| 31 | 0.301282514709723 | 0.602565029419446 | 0.698717485290277 |
| 32 | 0.31545981238484 | 0.630919624769679 | 0.68454018761516 |
| 33 | 0.265523430601177 | 0.531046861202355 | 0.734476569398823 |
| 34 | 0.247514165590969 | 0.495028331181937 | 0.752485834409031 |
| 35 | 0.240387604596279 | 0.480775209192558 | 0.759612395403721 |
| 36 | 0.208008558833117 | 0.416017117666234 | 0.791991441166883 |
| 37 | 0.169476774336459 | 0.338953548672918 | 0.830523225663541 |
| 38 | 0.181177933448108 | 0.362355866896217 | 0.818822066551892 |
| 39 | 0.184020824550699 | 0.368041649101397 | 0.815979175449301 |
| 40 | 0.171153379561041 | 0.342306759122081 | 0.828846620438959 |
| 41 | 0.202110328022227 | 0.404220656044455 | 0.797889671977772 |
| 42 | 0.24177625381666 | 0.48355250763332 | 0.75822374618334 |
| 43 | 0.251039808342482 | 0.502079616684964 | 0.748960191657518 |
| 44 | 0.47521535667722 | 0.950430713354441 | 0.52478464332278 |
| 45 | 0.444432246445199 | 0.888864492890398 | 0.555567753554801 |
| 46 | 0.405206677808171 | 0.810413355616341 | 0.594793322191829 |
| 47 | 0.40852717890369 | 0.817054357807379 | 0.59147282109631 |
| 48 | 0.349324798723616 | 0.698649597447232 | 0.650675201276384 |
| 49 | 0.360883707414351 | 0.721767414828702 | 0.639116292585649 |
| 50 | 0.572727973202432 | 0.854544053595135 | 0.427272026797568 |
| 51 | 0.568535493116574 | 0.862929013766852 | 0.431464506883426 |
| 52 | 0.492084798160749 | 0.984169596321498 | 0.507915201839251 |
| 53 | 0.392779266240383 | 0.785558532480767 | 0.607220733759617 |
| 54 | 0.296267180394107 | 0.592534360788215 | 0.703732819605893 |
| 55 | 0.290942147530277 | 0.581884295060554 | 0.709057852469723 |
| 56 | 0.292381461823007 | 0.584762923646014 | 0.707618538176993 |
| Meta Analysis of Goldfeld-Quandt test for Heteroskedasticity | |||
| Description | # significant tests | % significant tests | OK/NOK |
| 1% type I error level | 0 | 0 | OK |
| 5% type I error level | 0 | 0 | OK |
| 10% type I error level | 0 | 0 | OK |