| Multiple Linear Regression - Estimated Regression Equation |
| Gem_Graden[t] = + 12.8237912538522 + 0.507963376925985Gem_Fietsers[t] -0.450640823263281`Aantal_Mannen `[t] + e[t] |
| Multiple Linear Regression - Ordinary Least Squares | |||||
| Variable | Parameter | S.D. | T-STAT H0: parameter = 0 | 2-tail p-value | 1-tail p-value |
| (Intercept) | 12.8237912538522 | 0.806271 | 15.9051 | 0 | 0 |
| Gem_Fietsers | 0.507963376925985 | 0.079387 | 6.3985 | 0 | 0 |
| `Aantal_Mannen ` | -0.450640823263281 | 0.100708 | -4.4747 | 3.7e-05 | 1.9e-05 |
| Multiple Linear Regression - Regression Statistics | |
| Multiple R | 0.799622716864037 |
| R-squared | 0.639396489325023 |
| Adjusted R-squared | 0.626743734564498 |
| F-TEST (value) | 50.534172314778 |
| F-TEST (DF numerator) | 2 |
| F-TEST (DF denominator) | 57 |
| p-value | 2.37365682664858e-13 |
| Multiple Linear Regression - Residual Statistics | |
| Residual Standard Deviation | 2.1647537053454 |
| Sum Squared Residuals | 267.111040473978 |
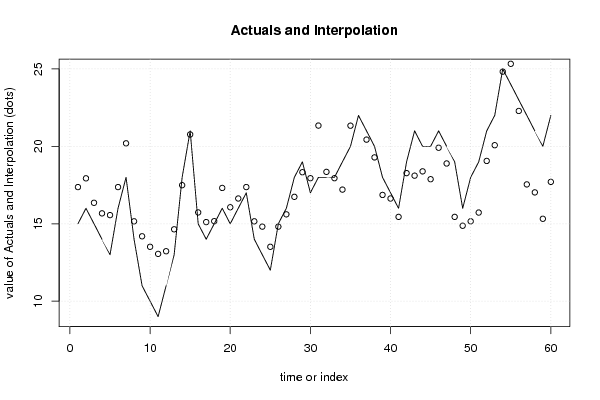
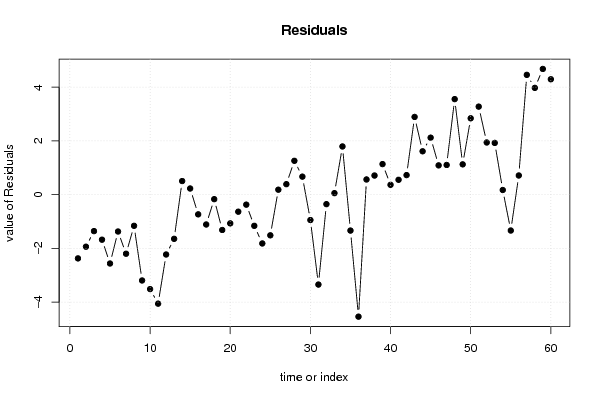
| Multiple Linear Regression - Actuals, Interpolation, and Residuals | |||
| Time or Index | Actuals | Interpolation Forecast | Residuals Prediction Error |
| 1 | 15 | 17.3698975166768 | -2.36989751667677 |
| 2 | 16 | 17.9351834472655 | -1.93518344726548 |
| 3 | 15 | 16.3539707628248 | -1.35397076282483 |
| 4 | 14 | 15.6740397249107 | -1.67403972491073 |
| 5 | 13 | 15.5593946175853 | -2.55939461758532 |
| 6 | 16 | 17.3698975166768 | -1.3698975166768 |
| 7 | 18 | 20.1963271696202 | -2.19632716962024 |
| 8 | 14 | 15.1581367419464 | -1.15813674194639 |
| 9 | 11 | 14.1915929357188 | -3.19159293571878 |
| 10 | 10 | 13.5116618978047 | -3.51166189780468 |
| 11 | 9 | 13.053081468503 | -4.05308146850305 |
| 12 | 11 | 13.2250491294912 | -2.22504912949116 |
| 13 | 13 | 14.6422337589821 | -1.64223375898206 |
| 14 | 18 | 17.4924822300406 | 0.507517769959442 |
| 15 | 21 | 20.7695527062473 | 0.230447293752715 |
| 16 | 15 | 15.7313622785734 | -0.731362278573435 |
| 17 | 14 | 15.108753794322 | -1.10875379432204 |
| 18 | 15 | 15.1660763479847 | -0.166076347984746 |
| 19 | 16 | 17.3125749630141 | -1.31257496301409 |
| 20 | 15 | 16.0673579945113 | -1.06735799451131 |
| 21 | 16 | 16.6326439251 | -0.632643925099997 |
| 22 | 17 | 17.3698975166768 | -0.369897516676798 |
| 23 | 14 | 15.1581367419464 | -1.15813674194639 |
| 24 | 13 | 14.8142014199702 | -1.81420141997017 |
| 25 | 12 | 13.5116618978047 | -1.51166189780468 |
| 26 | 15 | 14.8142014199702 | 0.18579858002983 |
| 27 | 16 | 15.6087775652097 | 0.391222434790325 |
| 28 | 18 | 16.7393494263871 | 1.26065057361295 |
| 29 | 19 | 18.3285017168661 | 0.671498283133936 |
| 30 | 17 | 17.9431230533038 | -0.943123053303839 |
| 31 | 18 | 21.3427782428743 | -3.34277824287433 |
| 32 | 18 | 18.3523205349811 | -0.352320534981119 |
| 33 | 18 | 17.9431230533038 | 0.0568769466961609 |
| 34 | 19 | 17.205869461727 | 1.79413053827296 |
| 35 | 20 | 21.334838636836 | -1.33483863683597 |
| 36 | 22 | 26.5370571194596 | -4.53705711945959 |
| 37 | 21 | 20.4335569903094 | 0.566443009690589 |
| 38 | 20 | 19.2871059170553 | 0.71289408294467 |
| 39 | 18 | 16.8619341397508 | 1.13806586024919 |
| 40 | 17 | 16.6326439251 | 0.367356074900003 |
| 41 | 16 | 15.4447495102599 | 0.555250489740085 |
| 42 | 19 | 18.2711791632034 | 0.72882083679664 |
| 43 | 21 | 18.1071511082536 | 2.8928488917464 |
| 44 | 20 | 18.3858242705288 | 1.61417572947123 |
| 45 | 20 | 17.8778608936028 | 2.12213910639722 |
| 46 | 21 | 19.9097144013067 | 1.09028559869328 |
| 47 | 20 | 18.8937876474548 | 1.10621235254525 |
| 48 | 19 | 15.4447495102599 | 3.55525048974009 |
| 49 | 16 | 14.8715239736329 | 1.12847602636713 |
| 50 | 18 | 15.1581367419464 | 2.84186325805361 |
| 51 | 19 | 15.7234226725351 | 3.27657732746492 |
| 52 | 21 | 19.0578157024045 | 1.94218429759549 |
| 53 | 22 | 20.0737424562565 | 1.92625754374352 |
| 54 | 25 | 24.8253201156168 | 0.174679884383187 |
| 55 | 24 | 25.3332834925428 | -1.3332834925428 |
| 56 | 23 | 22.2855032309869 | 0.714496769013113 |
| 57 | 22 | 17.5418651776649 | 4.45813482233509 |
| 58 | 21 | 17.0259621947006 | 3.97403780529943 |
| 59 | 20 | 15.3221647968962 | 4.67783520310384 |
| 60 | 22 | 17.7058932326147 | 4.29410676738533 |
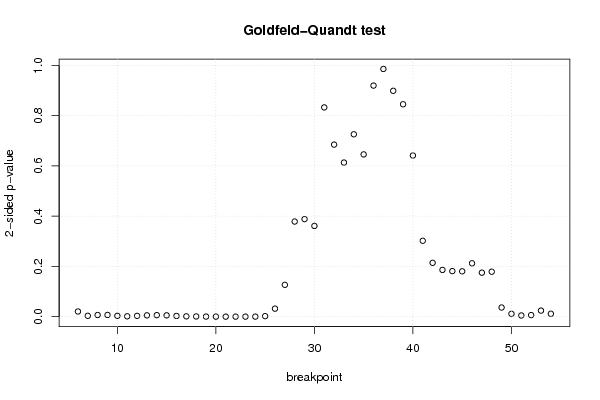
| Goldfeld-Quandt test for Heteroskedasticity | |||
| p-values | Alternative Hypothesis | ||
| breakpoint index | greater | 2-sided | less |
| 6 | 0.0103621998048612 | 0.0207243996097223 | 0.989637800195139 |
| 7 | 0.00177562239416285 | 0.00355124478832571 | 0.998224377605837 |
| 8 | 0.00339028441339832 | 0.00678056882679665 | 0.996609715586602 |
| 9 | 0.00346007740698787 | 0.00692015481397573 | 0.996539922593012 |
| 10 | 0.00168508575104463 | 0.00337017150208927 | 0.998314914248955 |
| 11 | 0.000803323975263578 | 0.00160664795052716 | 0.999196676024736 |
| 12 | 0.00165960478654958 | 0.00331920957309916 | 0.99834039521345 |
| 13 | 0.00266941630277637 | 0.00533883260555274 | 0.997330583697224 |
| 14 | 0.00305867656428254 | 0.00611735312856508 | 0.996941323435718 |
| 15 | 0.00269527582426346 | 0.00539055164852692 | 0.997304724175737 |
| 16 | 0.00141347608740283 | 0.00282695217480567 | 0.998586523912597 |
| 17 | 0.000692208711867454 | 0.00138441742373491 | 0.999307791288133 |
| 18 | 0.00047580201279876 | 0.00095160402559752 | 0.999524197987201 |
| 19 | 0.000235277933335434 | 0.000470555866670868 | 0.999764722066665 |
| 20 | 0.000134014774030317 | 0.000268029548060634 | 0.99986598522597 |
| 21 | 0.000105830305367921 | 0.000211660610735841 | 0.999894169694632 |
| 22 | 7.53442225506448e-05 | 0.00015068844510129 | 0.999924655777449 |
| 23 | 7.60247066686905e-05 | 0.000152049413337381 | 0.999923975293331 |
| 24 | 0.000148609306757717 | 0.000297218613515434 | 0.999851390693242 |
| 25 | 0.00108038601573691 | 0.00216077203147381 | 0.998919613984263 |
| 26 | 0.0159954694680405 | 0.0319909389360809 | 0.98400453053196 |
| 27 | 0.063380268864865 | 0.12676053772973 | 0.936619731135135 |
| 28 | 0.189381465605158 | 0.378762931210316 | 0.810618534394842 |
| 29 | 0.194209062923017 | 0.388418125846034 | 0.805790937076983 |
| 30 | 0.180659249786985 | 0.36131849957397 | 0.819340750213015 |
| 31 | 0.416503615521047 | 0.833007231042093 | 0.583496384478953 |
| 32 | 0.34248328033326 | 0.684966560666519 | 0.65751671966674 |
| 33 | 0.306785582427974 | 0.613571164855948 | 0.693214417572026 |
| 34 | 0.363036719680676 | 0.726073439361352 | 0.636963280319324 |
| 35 | 0.322997549349419 | 0.645995098698838 | 0.677002450650581 |
| 36 | 0.540063634062222 | 0.919872731875557 | 0.459936365937778 |
| 37 | 0.506933242147405 | 0.986133515705189 | 0.493066757852595 |
| 38 | 0.550450044677403 | 0.899099910645193 | 0.449549955322597 |
| 39 | 0.577214301306807 | 0.845571397386386 | 0.422785698693193 |
| 40 | 0.679211460295949 | 0.641577079408102 | 0.320788539704051 |
| 41 | 0.848904543435382 | 0.302190913129235 | 0.151095456564618 |
| 42 | 0.892756219429062 | 0.214487561141876 | 0.107243780570938 |
| 43 | 0.906929757433687 | 0.186140485132626 | 0.0930702425663129 |
| 44 | 0.909291043038189 | 0.181417913923621 | 0.0907089569618107 |
| 45 | 0.909679095273466 | 0.180641809453068 | 0.0903209047265338 |
| 46 | 0.893718817954934 | 0.212562364090131 | 0.106281182045066 |
| 47 | 0.91239784507567 | 0.175204309848661 | 0.0876021549243305 |
| 48 | 0.910492890340519 | 0.179014219318962 | 0.0895071096594811 |
| 49 | 0.981725798064009 | 0.0365484038719818 | 0.0182742019359909 |
| 50 | 0.994238330321732 | 0.0115233393565361 | 0.00576166967826804 |
| 51 | 0.997618684509385 | 0.0047626309812297 | 0.00238131549061485 |
| 52 | 0.99680180162085 | 0.00639639675829987 | 0.00319819837914993 |
| 53 | 0.987892894476139 | 0.0242142110477227 | 0.0121071055238614 |
| 54 | 0.994177616724757 | 0.011644766550486 | 0.005822383275243 |
| Meta Analysis of Goldfeld-Quandt test for Heteroskedasticity | |||
| Description | # significant tests | % significant tests | OK/NOK |
| 1% type I error level | 21 | 0.428571428571429 | NOK |
| 5% type I error level | 27 | 0.551020408163265 | NOK |
| 10% type I error level | 27 | 0.551020408163265 | NOK |