| Multiple Linear Regression - Estimated Regression Equation |
| Gem_Graden[t] = + 12.1342791396536 + 0.127221061677616Gem_Fietsers[t] + 1.88557563162603`Geslacht `[t] + e[t] |
| Multiple Linear Regression - Ordinary Least Squares | |||||
| Variable | Parameter | S.D. | T-STAT H0: parameter = 0 | 2-tail p-value | 1-tail p-value |
| (Intercept) | 12.1342791396536 | 0.915018 | 13.2612 | 0 | 0 |
| Gem_Fietsers | 0.127221061677616 | 0.026503 | 4.8003 | 1.2e-05 | 6e-06 |
| `Geslacht ` | 1.88557563162603 | 0.930926 | 2.0255 | 0.047509 | 0.023755 |
| Multiple Linear Regression - Regression Statistics | |
| Multiple R | 0.738539369486175 |
| R-squared | 0.545440400281037 |
| Adjusted R-squared | 0.529490940641775 |
| F-TEST (value) | 34.198048875484 |
| F-TEST (DF numerator) | 2 |
| F-TEST (DF denominator) | 57 |
| p-value | 1.74316561185606e-10 |
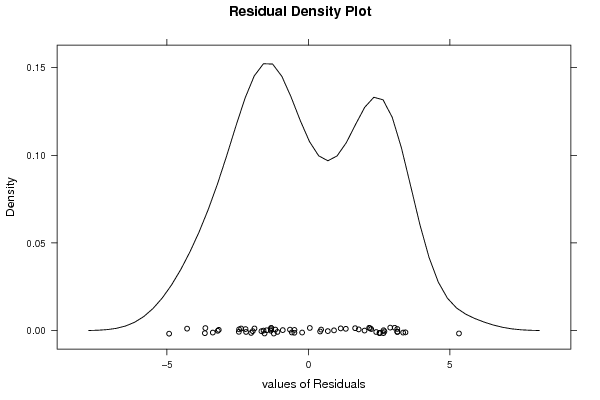
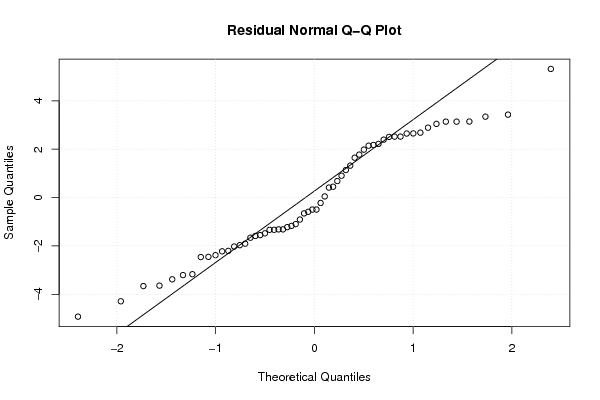
| Multiple Linear Regression - Residual Statistics | |
| Residual Standard Deviation | 2.43046254892519 |
| Sum Squared Residuals | 336.707447498493 |
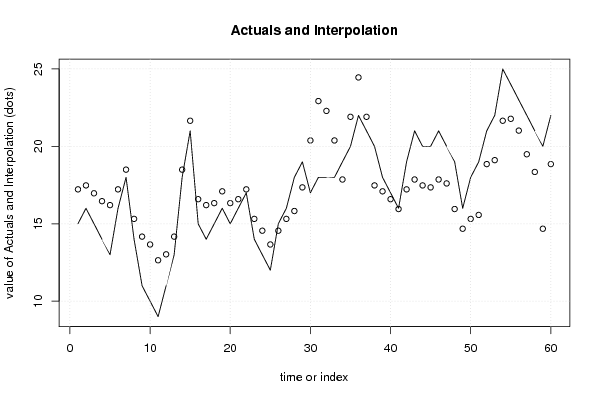
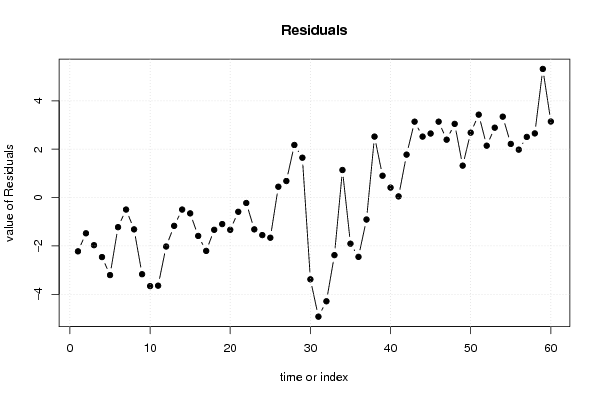
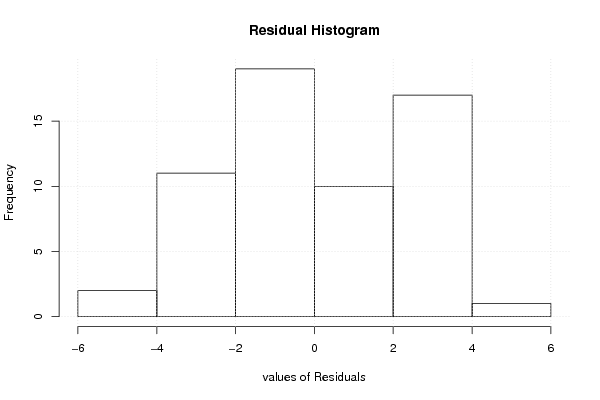
| Multiple Linear Regression - Actuals, Interpolation, and Residuals | |||
| Time or Index | Actuals | Interpolation Forecast | Residuals Prediction Error |
| 1 | 15 | 17.2231216067582 | -2.22312160675821 |
| 2 | 16 | 17.4775637301135 | -1.47756373011347 |
| 3 | 15 | 16.968679483403 | -1.96867948340301 |
| 4 | 14 | 16.4597952366925 | -2.45979523669255 |
| 5 | 13 | 16.2053531133373 | -3.20535311333732 |
| 6 | 16 | 17.2231216067582 | -1.22312160675824 |
| 7 | 18 | 18.4953322235344 | -0.495332223534404 |
| 8 | 14 | 15.314805681594 | -1.314805681594 |
| 9 | 11 | 14.1698161264955 | -3.16981612649546 |
| 10 | 10 | 13.660931879785 | -3.660931879785 |
| 11 | 9 | 12.6431633863641 | -3.64316338636407 |
| 12 | 11 | 13.0248265713969 | -2.02482657139692 |
| 13 | 13 | 14.1698161264955 | -1.16981612649546 |
| 14 | 18 | 18.4953322235344 | -0.495332223534404 |
| 15 | 21 | 21.6531184719366 | -0.65311847193659 |
| 16 | 15 | 16.5870162983702 | -1.58701629837016 |
| 17 | 14 | 16.2053531133373 | -2.20535311333732 |
| 18 | 15 | 16.3325741750149 | -1.33257417501493 |
| 19 | 16 | 17.0959005450806 | -1.09590054508063 |
| 20 | 15 | 16.3325741750149 | -1.33257417501493 |
| 21 | 16 | 16.5870162983702 | -0.587016298370164 |
| 22 | 17 | 17.2231216067582 | -0.223121606758244 |
| 23 | 14 | 15.314805681594 | -1.314805681594 |
| 24 | 13 | 14.5514793115283 | -1.55147931152831 |
| 25 | 12 | 13.660931879785 | -1.660931879785 |
| 26 | 15 | 14.5514793115283 | 0.448520688471692 |
| 27 | 16 | 15.314805681594 | 0.685194318405997 |
| 28 | 18 | 15.8236899283045 | 2.17631007169553 |
| 29 | 19 | 17.3503426684359 | 1.64965733156414 |
| 30 | 17 | 20.3809078551604 | -3.38090785516043 |
| 31 | 18 | 22.9253290887128 | -4.92532908871275 |
| 32 | 18 | 22.2892237803247 | -4.28922378032467 |
| 33 | 18 | 20.3809078551604 | -2.38090785516043 |
| 34 | 19 | 17.8592269151463 | 1.14077308485368 |
| 35 | 20 | 21.9075605952918 | -1.90756059529182 |
| 36 | 22 | 24.4519818288441 | -2.45198182884414 |
| 37 | 21 | 21.9075605952918 | -0.907560595291822 |
| 38 | 20 | 17.4775637301135 | 2.52243626988652 |
| 39 | 18 | 17.0959005450806 | 0.904099454919372 |
| 40 | 17 | 16.5870162983702 | 0.412983701629836 |
| 41 | 16 | 15.9509109899821 | 0.0490890100179163 |
| 42 | 19 | 17.2231216067582 | 1.77687839324176 |
| 43 | 21 | 17.8592269151463 | 3.14077308485368 |
| 44 | 20 | 17.4775637301135 | 2.52243626988652 |
| 45 | 20 | 17.3503426684359 | 2.64965733156414 |
| 46 | 21 | 17.8592269151463 | 3.14077308485368 |
| 47 | 20 | 17.6047847917911 | 2.39521520820891 |
| 48 | 19 | 15.9509109899821 | 3.04908901001792 |
| 49 | 16 | 14.6787003732059 | 1.32129962679408 |
| 50 | 18 | 15.314805681594 | 2.685194318406 |
| 51 | 19 | 15.5692478049492 | 3.43075219505076 |
| 52 | 21 | 18.854255115029 | 2.14574488497096 |
| 53 | 22 | 19.1086972383843 | 2.89130276161573 |
| 54 | 25 | 21.6531184719366 | 3.34688152806341 |
| 55 | 24 | 21.7803395336142 | 2.21966046638579 |
| 56 | 23 | 21.0170131635485 | 1.98298683645149 |
| 57 | 22 | 19.4903604234171 | 2.50963957658288 |
| 58 | 21 | 18.3453708683186 | 2.65462913168143 |
| 59 | 20 | 14.6787003732059 | 5.32129962679408 |
| 60 | 22 | 18.854255115029 | 3.14574488497096 |
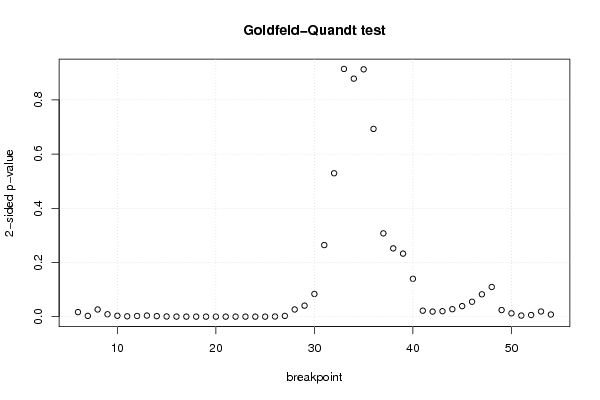
| Goldfeld-Quandt test for Heteroskedasticity | |||
| p-values | Alternative Hypothesis | ||
| breakpoint index | greater | 2-sided | less |
| 6 | 0.00842326312801528 | 0.0168465262560306 | 0.991576736871985 |
| 7 | 0.00143700007519862 | 0.00287400015039723 | 0.998562999924801 |
| 8 | 0.013270820440662 | 0.0265416408813241 | 0.986729179559338 |
| 9 | 0.00447022565698443 | 0.00894045131396886 | 0.995529774343016 |
| 10 | 0.00162554197371475 | 0.00325108394742951 | 0.998374458026285 |
| 11 | 0.000662233534552935 | 0.00132446706910587 | 0.999337766465447 |
| 12 | 0.00121972035448522 | 0.00243944070897044 | 0.998780279645515 |
| 13 | 0.0019848850062218 | 0.00396977001244361 | 0.998015114993778 |
| 14 | 0.000934325121492388 | 0.00186865024298478 | 0.999065674878508 |
| 15 | 0.000332638007795353 | 0.000665276015590706 | 0.999667361992205 |
| 16 | 0.000134026009511546 | 0.000268052019023091 | 0.999865973990488 |
| 17 | 6.44210253776287e-05 | 0.000128842050755257 | 0.999935578974622 |
| 18 | 3.09499812001851e-05 | 6.18999624003703e-05 | 0.9999690500188 |
| 19 | 1.33495764193398e-05 | 2.66991528386795e-05 | 0.99998665042358 |
| 20 | 6.50580915857155e-06 | 1.30116183171431e-05 | 0.999993494190841 |
| 21 | 5.66154772386642e-06 | 1.13230954477328e-05 | 0.999994338452276 |
| 22 | 4.81757058334286e-06 | 9.63514116668571e-06 | 0.999995182429417 |
| 23 | 3.82689476113788e-06 | 7.65378952227576e-06 | 0.999996173105239 |
| 24 | 4.53430418915674e-06 | 9.06860837831347e-06 | 0.99999546569581 |
| 25 | 1.4007273282116e-05 | 2.8014546564232e-05 | 0.999985992726718 |
| 26 | 0.000269276241948727 | 0.000538552483897453 | 0.999730723758051 |
| 27 | 0.00139629271838324 | 0.00279258543676648 | 0.998603707281617 |
| 28 | 0.0132503217750828 | 0.0265006435501657 | 0.986749678224917 |
| 29 | 0.0202866998916123 | 0.0405733997832245 | 0.979713300108388 |
| 30 | 0.0419260276261292 | 0.0838520552522584 | 0.95807397237387 |
| 31 | 0.132145038945254 | 0.264290077890508 | 0.867854961054746 |
| 32 | 0.264686225652785 | 0.529372451305571 | 0.735313774347215 |
| 33 | 0.457194486114162 | 0.914388972228324 | 0.542805513885838 |
| 34 | 0.439274272837797 | 0.878548545675594 | 0.560725727162203 |
| 35 | 0.543492777736739 | 0.913014444526521 | 0.456507222263261 |
| 36 | 0.653436238306577 | 0.693127523386846 | 0.346563761693423 |
| 37 | 0.846247525747723 | 0.307504948504555 | 0.153752474252277 |
| 38 | 0.873923517197564 | 0.252152965604873 | 0.126076482802436 |
| 39 | 0.88367249413011 | 0.23265501173978 | 0.11632750586989 |
| 40 | 0.930068710719427 | 0.139862578561146 | 0.0699312892805731 |
| 41 | 0.988992876138634 | 0.0220142477227319 | 0.011007123861366 |
| 42 | 0.99063573839811 | 0.0187285232037788 | 0.00936426160188942 |
| 43 | 0.989953435887405 | 0.0200931282251906 | 0.0100465641125953 |
| 44 | 0.986248515944544 | 0.0275029681109126 | 0.0137514840554563 |
| 45 | 0.980573064168752 | 0.0388538716624953 | 0.0194269358312477 |
| 46 | 0.972484985423131 | 0.0550300291537387 | 0.0275150145768694 |
| 47 | 0.95873588773672 | 0.0825282245265595 | 0.0412641122632798 |
| 48 | 0.945260115349193 | 0.109479769301615 | 0.0547398846508074 |
| 49 | 0.987772723749874 | 0.0244545525002529 | 0.0122272762501265 |
| 50 | 0.993860326253003 | 0.0122793474939942 | 0.00613967374699708 |
| 51 | 0.997997830194538 | 0.00400433961092319 | 0.0020021698054616 |
| 52 | 0.99696525905089 | 0.00606948189821856 | 0.00303474094910928 |
| 53 | 0.9904868603029 | 0.0190262793941984 | 0.0095131396970992 |
| 54 | 0.996041141557073 | 0.00791771688585413 | 0.00395885844292706 |
| Meta Analysis of Goldfeld-Quandt test for Heteroskedasticity | |||
| Description | # significant tests | % significant tests | OK/NOK |
| 1% type I error level | 23 | 0.469387755102041 | NOK |
| 5% type I error level | 35 | 0.714285714285714 | NOK |
| 10% type I error level | 38 | 0.775510204081633 | NOK |