| Multiple Linear Regression - Estimated Regression Equation |
| Constant[t] = -0.731267597549556 + 0.0146779012617584Mortality[t] + 0.974896174406623Marriages[t] + e[t] |
| Multiple Linear Regression - Ordinary Least Squares | |||||
| Variable | Parameter | S.D. | T-STAT H0: parameter = 0 | 2-tail p-value | 1-tail p-value |
| (Intercept) | -0.731267597549556 | 0.485997 | -1.5047 | 0.139891 | 0.069946 |
| Mortality | 0.0146779012617584 | 0.014949 | 0.9818 | 0.331798 | 0.165899 |
| Marriages | 0.974896174406623 | 0.034292 | 28.4294 | 0 | 0 |
| Multiple Linear Regression - Regression Statistics | |
| Multiple R | 0.997495961281934 |
| R-squared | 0.99499819277377 |
| Adjusted R-squared | 0.994760011477283 |
| F-TEST (value) | 4177.48247846739 |
| F-TEST (DF numerator) | 2 |
| F-TEST (DF denominator) | 42 |
| p-value | 0 |
| Multiple Linear Regression - Residual Statistics | |
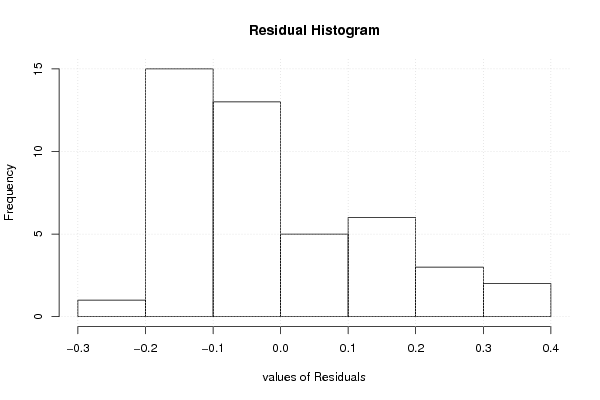
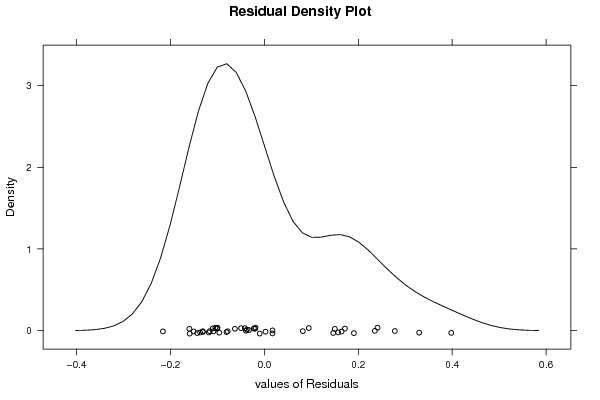
| Residual Standard Deviation | 0.15097980924285 |
| Sum Squared Residuals | 0.957385917558312 |
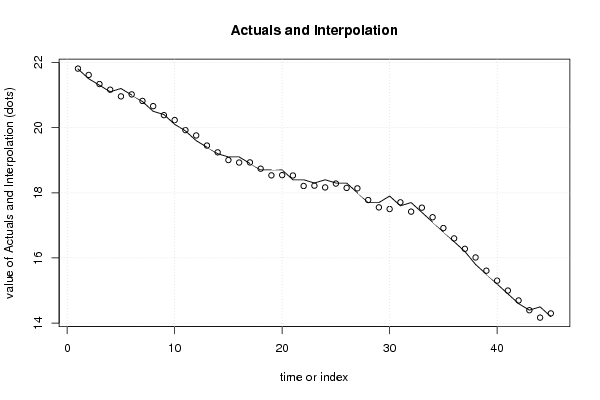
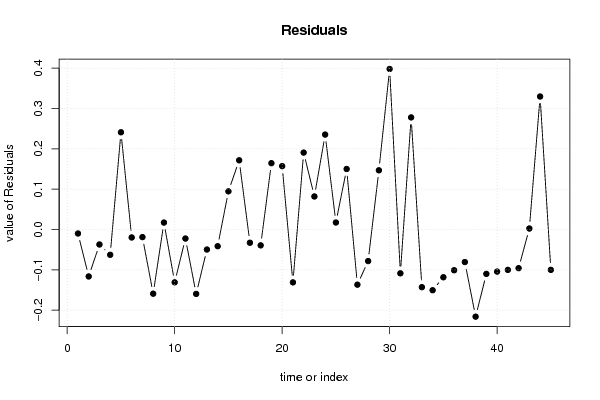
| Multiple Linear Regression - Actuals, Interpolation, and Residuals | |||
| Time or Index | Actuals | Interpolation Forecast | Residuals Prediction Error |
| 1 | 21.8 | 21.8099518833972 | -0.00995188339717043 |
| 2 | 21.5 | 21.616440438642 | -0.116440438642015 |
| 3 | 21.3 | 21.3371816974556 | -0.0371816974556087 |
| 4 | 21.1 | 21.1627515243407 | -0.0627515243407455 |
| 5 | 21.2 | 20.9589655487024 | 0.241034451297631 |
| 6 | 21 | 21.0197604129886 | -0.0197604129886322 |
| 7 | 20.8 | 20.8189100176026 | -0.0189100176026043 |
| 8 | 20.5 | 20.6591577457495 | -0.159157745749501 |
| 9 | 20.4 | 20.3828345848154 | 0.0171654151845516 |
| 10 | 20.1 | 20.2310367327063 | -0.131036732706276 |
| 11 | 19.9 | 19.9224221889964 | -0.0224221889963603 |
| 12 | 19.6 | 19.7597343368909 | -0.159734336890898 |
| 13 | 19.4 | 19.4496520030548 | -0.0496520030548071 |
| 14 | 19.2 | 19.2414626570379 | -0.0414626570378964 |
| 15 | 19.1 | 19.0053852986236 | 0.0946147013763532 |
| 16 | 19.1 | 18.9284447429494 | 0.171555257050552 |
| 17 | 18.9 | 18.932848113328 | -0.0328481133279784 |
| 18 | 18.7 | 18.7393366685728 | -0.0393366685728262 |
| 19 | 18.7 | 18.5355506929344 | 0.164449307065553 |
| 20 | 18.7 | 18.5428896435653 | 0.157110356434674 |
| 21 | 18.4 | 18.5311473225559 | -0.13114732255592 |
| 22 | 18.4 | 18.2093226677104 | 0.190677332289584 |
| 23 | 18.3 | 18.2181294084675 | 0.0818705915325312 |
| 24 | 18.4 | 18.1646734948121 | 0.235326505187914 |
| 25 | 18.3 | 18.2827121740192 | 0.0172878259807946 |
| 26 | 18.3 | 18.1499955935503 | 0.150004406449675 |
| 27 | 18 | 18.1367854824147 | -0.136785482414743 |
| 28 | 17.7 | 17.7782660744148 | -0.0782660744148438 |
| 29 | 17.7 | 17.5533155678969 | 0.146684432103056 |
| 30 | 17.9 | 17.5019429134808 | 0.398057086519209 |
| 31 | 17.6 | 17.7086644693715 | -0.108664469371519 |
| 32 | 17.7 | 17.4220667775542 | 0.27793322244576 |
| 33 | 17.4 | 17.5430410370137 | -0.143041037013714 |
| 34 | 17.1 | 17.2505721846917 | -0.150572184691724 |
| 35 | 16.8 | 16.918472998963 | -0.118472998962992 |
| 36 | 16.5 | 16.601051714496 | -0.101051714496016 |
| 37 | 16.2 | 16.2806948497767 | -0.0806948497766884 |
| 38 | 15.8 | 16.016114009852 | -0.21611400985204 |
| 39 | 15.5 | 15.6100098487015 | -0.110009848701459 |
| 40 | 15.2 | 15.3043308852439 | -0.104330885243889 |
| 41 | 14.9 | 15.0001197119125 | -0.100119711912494 |
| 42 | 14.6 | 14.6959085385811 | -0.0959085385811016 |
| 43 | 14.4 | 14.3975685257544 | 0.00243147424559064 |
| 44 | 14.5 | 14.1702979080972 | 0.329702091902783 |
| 45 | 14.2 | 14.3000789083137 | -0.100078908313748 |
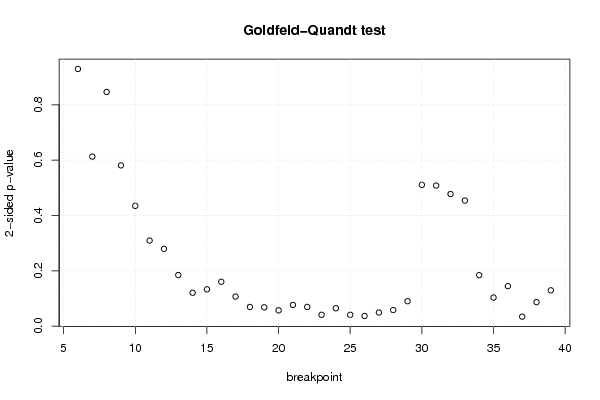
| Goldfeld-Quandt test for Heteroskedasticity | |||
| p-values | Alternative Hypothesis | ||
| breakpoint index | greater | 2-sided | less |
| 6 | 0.464838944107915 | 0.929677888215831 | 0.535161055892085 |
| 7 | 0.306361139733481 | 0.612722279466961 | 0.693638860266519 |
| 8 | 0.423331815899926 | 0.846663631799851 | 0.576668184100074 |
| 9 | 0.290571239316465 | 0.581142478632929 | 0.709428760683535 |
| 10 | 0.217398077446144 | 0.434796154892289 | 0.782601922553856 |
| 11 | 0.154597981315326 | 0.309195962630652 | 0.845402018684674 |
| 12 | 0.139706715692844 | 0.279413431385688 | 0.860293284307156 |
| 13 | 0.0923264675198984 | 0.184652935039797 | 0.907673532480102 |
| 14 | 0.0603329224087344 | 0.120665844817469 | 0.939667077591266 |
| 15 | 0.0665149996718006 | 0.133029999343601 | 0.933485000328199 |
| 16 | 0.0802311165489425 | 0.160462233097885 | 0.919768883451057 |
| 17 | 0.0533837370387009 | 0.106767474077402 | 0.946616262961299 |
| 18 | 0.0346355178645365 | 0.069271035729073 | 0.965364482135464 |
| 19 | 0.0340260705240913 | 0.0680521410481826 | 0.965973929475909 |
| 20 | 0.028583694298129 | 0.057167388596258 | 0.971416305701871 |
| 21 | 0.0383188570911367 | 0.0766377141822735 | 0.961681142908863 |
| 22 | 0.0347741254064561 | 0.0695482508129123 | 0.965225874593544 |
| 23 | 0.0204999988011278 | 0.0409999976022555 | 0.979500001198872 |
| 24 | 0.0322694840891793 | 0.0645389681783586 | 0.967730515910821 |
| 25 | 0.0205308574617687 | 0.0410617149235373 | 0.979469142538231 |
| 26 | 0.0183998580671634 | 0.0367997161343267 | 0.981600141932837 |
| 27 | 0.0245801374015616 | 0.0491602748031231 | 0.975419862598438 |
| 28 | 0.0291225756275543 | 0.0582451512551087 | 0.970877424372446 |
| 29 | 0.0450140330608413 | 0.0900280661216827 | 0.954985966939159 |
| 30 | 0.25544369400944 | 0.51088738801888 | 0.74455630599056 |
| 31 | 0.254126341702451 | 0.508252683404901 | 0.745873658297549 |
| 32 | 0.761216253614327 | 0.477567492771346 | 0.238783746385673 |
| 33 | 0.773059124680056 | 0.453881750639889 | 0.226940875319944 |
| 34 | 0.907902399299748 | 0.184195201400503 | 0.0920976007002515 |
| 35 | 0.948319642391301 | 0.103360715217398 | 0.0516803576086989 |
| 36 | 0.927754194053949 | 0.144491611892102 | 0.0722458059460509 |
| 37 | 0.982866912292847 | 0.0342661754143062 | 0.0171330877071531 |
| 38 | 0.956568670730847 | 0.0868626585383065 | 0.0434313292691532 |
| 39 | 0.93529256030908 | 0.129414879381839 | 0.0647074396909195 |
| Meta Analysis of Goldfeld-Quandt test for Heteroskedasticity | |||
| Description | # significant tests | % significant tests | OK/NOK |
| 1% type I error level | 0 | 0 | OK |
| 5% type I error level | 5 | 0.147058823529412 | NOK |
| 10% type I error level | 14 | 0.411764705882353 | NOK |