| Multiple Linear Regression - Estimated Regression Equation |
| rating[t] = + 96.7642422137256 -0.0252260374703789fat[t] + 0.0449018590792939sugars[t] -0.526265081499741calories[t] + e[t] |
| Multiple Linear Regression - Ordinary Least Squares | |||||
| Variable | Parameter | S.D. | T-STAT H0: parameter = 0 | 2-tail p-value | 1-tail p-value |
| (Intercept) | 96.7642422137256 | 9.892328 | 9.7817 | 0 | 0 |
| fat | -0.0252260374703789 | 0.017436 | -1.4468 | 0.153535 | 0.076768 |
| sugars | 0.0449018590792939 | 0.021388 | 2.0994 | 0.040305 | 0.020152 |
| calories | -0.526265081499741 | 0.098533 | -5.341 | 2e-06 | 1e-06 |
| Multiple Linear Regression - Regression Statistics | |
| Multiple R | 0.710238953825194 |
| R-squared | 0.504439371530707 |
| Adjusted R-squared | 0.477891480719851 |
| F-TEST (value) | 19.0011091700155 |
| F-TEST (DF numerator) | 3 |
| F-TEST (DF denominator) | 56 |
| p-value | 1.26788004539691e-08 |
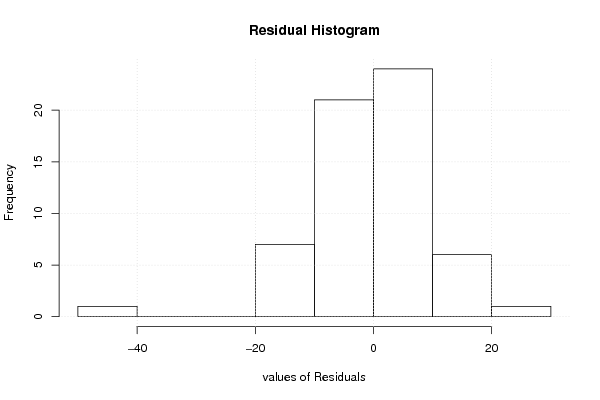
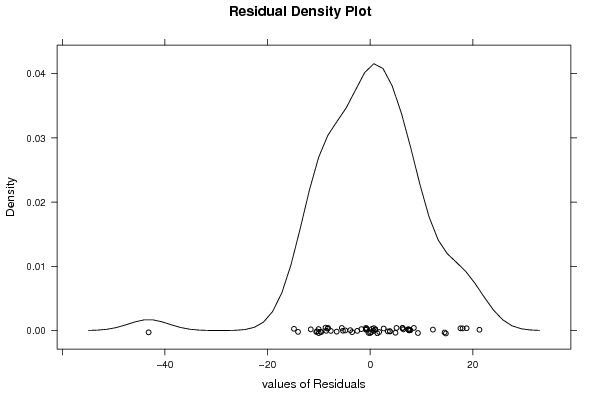
| Multiple Linear Regression - Residual Statistics | |
| Residual Standard Deviation | 10.5427147458672 |
| Sum Squared Residuals | 6224.33471591263 |
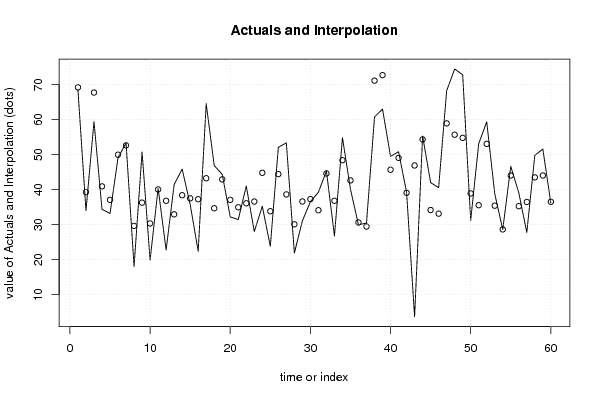
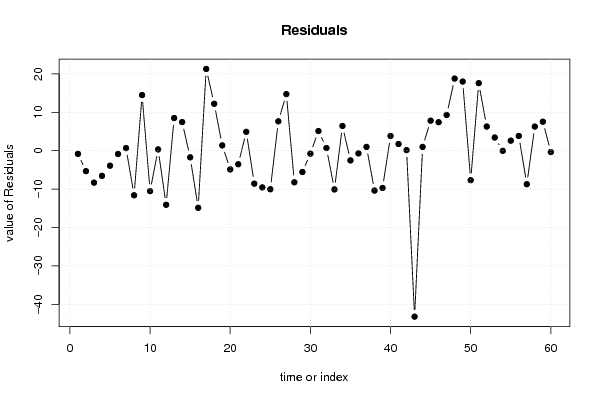
| Multiple Linear Regression - Actuals, Interpolation, and Residuals | |||
| Time or Index | Actuals | Interpolation Forecast | Residuals Prediction Error |
| 1 | 68.402973 | 69.2188221797966 | -0.815849179796559 |
| 2 | 33.983679 | 39.2957928474057 | -5.31211384740571 |
| 3 | 59.425505 | 67.7355116718193 | -8.31000667181927 |
| 4 | 34.384843 | 40.9243694892068 | -6.53952648920677 |
| 5 | 33.174094 | 37.0688843373356 | -3.89479033733558 |
| 6 | 49.120253 | 49.9679097695849 | -0.847656769584894 |
| 7 | 53.313813 | 52.6342702350352 | 0.6795427649648 |
| 8 | 18.042851 | 29.6342692580486 | -11.5914182580486 |
| 9 | 50.765 | 36.2742275856701 | 14.4907724143299 |
| 10 | 19.823573 | 30.3355482235454 | -10.5119752235454 |
| 11 | 40.400208 | 40.0581332062269 | 0.342074793773064 |
| 12 | 22.736446 | 36.8039987534471 | -14.0675527534471 |
| 13 | 41.445019 | 32.9343392340304 | 8.51067976596963 |
| 14 | 45.863324 | 38.3937482651169 | 7.46957573488307 |
| 15 | 35.782791 | 37.5027770580059 | -1.7199860580059 |
| 16 | 22.396513 | 37.25301734424 | -14.85650434424 |
| 17 | 64.533816 | 43.2421975431036 | 21.2916184568964 |
| 18 | 46.895644 | 34.6724107776496 | 12.2232332223504 |
| 19 | 44.330856 | 42.9369356707231 | 1.39392032927695 |
| 20 | 32.207582 | 37.0688843373356 | -4.86130233733558 |
| 21 | 31.435973 | 34.9524222316607 | -3.51644923166069 |
| 22 | 41.015492 | 36.0895366659316 | 4.92595533406839 |
| 23 | 28.025765 | 36.5921146672353 | -8.56634966723532 |
| 24 | 35.252444 | 44.7986367407562 | -9.54619274075624 |
| 25 | 23.804043 | 33.8323764156163 | -10.0283334156163 |
| 26 | 52.076897 | 44.4227468396385 | 7.65415016036154 |
| 27 | 53.371007 | 38.6278241959262 | 14.7431828040738 |
| 28 | 21.871292 | 30.0832878488416 | -8.21199584884158 |
| 29 | 31.072217 | 36.6097411982958 | -5.53752419829585 |
| 30 | 36.523683 | 37.2807684235473 | -0.757085423547345 |
| 31 | 39.241114 | 34.1123878696274 | 5.12872613037264 |
| 32 | 45.328074 | 44.6195050557276 | 0.708568944272386 |
| 33 | 26.734515 | 36.8039987534471 | -10.0694837534471 |
| 34 | 54.850917 | 48.4034106762845 | 6.44750632371555 |
| 35 | 40.105965 | 42.6291731374046 | -2.52320813740462 |
| 36 | 29.924285 | 30.6155596775565 | -0.691274677556475 |
| 37 | 30.450843 | 29.4495783383102 | 1.00126466168984 |
| 38 | 60.756112 | 71.124516024928 | -10.368404024928 |
| 39 | 63.005645 | 72.6960810927033 | -9.69043609270327 |
| 40 | 49.511874 | 45.6714235039727 | 3.84045049602729 |
| 41 | 50.828392 | 49.0769385624739 | 1.75145343752614 |
| 42 | 39.259197 | 39.0914107440077 | 0.167786255992325 |
| 43 | 3.7034 | 46.8923490889996 | -43.1889490889996 |
| 44 | 55.333142 | 54.3395893774713 | 0.993552622528729 |
| 45 | 41.998933 | 34.167890028242 | 7.831042971758 |
| 46 | 40.560159 | 33.1310974501195 | 7.42906154988047 |
| 47 | 68.235885 | 58.9287123062793 | 9.30717269372072 |
| 48 | 74.472949 | 55.6866451498501 | 18.7863038501499 |
| 49 | 72.801787 | 54.7886079682642 | 18.0131790317358 |
| 50 | 31.230054 | 38.9053349889994 | -7.67528098899936 |
| 51 | 53.131324 | 35.5426968799281 | 17.5886271200719 |
| 52 | 59.363993 | 53.0631616338297 | 6.30083136617029 |
| 53 | 38.839746 | 35.4014408224536 | 3.43830517754637 |
| 54 | 28.592785 | 28.6216112726275 | -0.0288262726274982 |
| 55 | 46.658844 | 44.0317310683981 | 2.62711293160193 |
| 56 | 39.106174 | 35.262685425917 | 3.84348857408297 |
| 57 | 27.753301 | 36.4659844798834 | -8.71268347988343 |
| 58 | 49.787445 | 43.4994592396832 | 6.28798576031682 |
| 59 | 51.592193 | 44.0317310683981 | 7.56046193160192 |
| 60 | 36.187559 | 36.523987299436 | -0.336428299435975 |
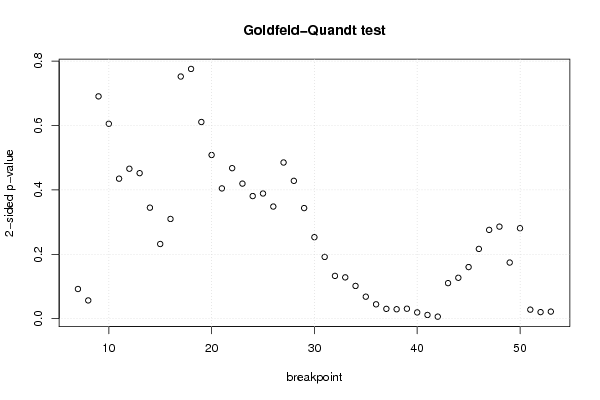
| Goldfeld-Quandt test for Heteroskedasticity | |||
| p-values | Alternative Hypothesis | ||
| breakpoint index | greater | 2-sided | less |
| 7 | 0.0460667358115111 | 0.0921334716230222 | 0.953933264188489 |
| 8 | 0.0283370570915002 | 0.0566741141830003 | 0.9716629429085 |
| 9 | 0.345205389130444 | 0.690410778260887 | 0.654794610869556 |
| 10 | 0.302621785186217 | 0.605243570372435 | 0.697378214813782 |
| 11 | 0.217371514006797 | 0.434743028013593 | 0.782628485993203 |
| 12 | 0.232782661649274 | 0.465565323298547 | 0.767217338350726 |
| 13 | 0.225947383978124 | 0.451894767956248 | 0.774052616021876 |
| 14 | 0.172338929729003 | 0.344677859458005 | 0.827661070270997 |
| 15 | 0.115930729810443 | 0.231861459620886 | 0.884069270189557 |
| 16 | 0.154809281682345 | 0.309618563364691 | 0.845190718317655 |
| 17 | 0.375984256383494 | 0.751968512766987 | 0.624015743616506 |
| 18 | 0.387752050192527 | 0.775504100385054 | 0.612247949807473 |
| 19 | 0.305377721051336 | 0.610755442102672 | 0.694622278948664 |
| 20 | 0.254132419803535 | 0.508264839607069 | 0.745867580196465 |
| 21 | 0.202296484887635 | 0.404592969775269 | 0.797703515112365 |
| 22 | 0.233695921424813 | 0.467391842849627 | 0.766304078575186 |
| 23 | 0.209698482337462 | 0.419396964674924 | 0.790301517662538 |
| 24 | 0.190382036573685 | 0.38076407314737 | 0.809617963426315 |
| 25 | 0.194369146130596 | 0.388738292261192 | 0.805630853869404 |
| 26 | 0.174065408735358 | 0.348130817470715 | 0.825934591264642 |
| 27 | 0.242498175188465 | 0.48499635037693 | 0.757501824811535 |
| 28 | 0.214037156767 | 0.428074313534 | 0.785962843233 |
| 29 | 0.171740787730724 | 0.343481575461449 | 0.828259212269276 |
| 30 | 0.126518844132243 | 0.253037688264486 | 0.873481155867757 |
| 31 | 0.0958886290071841 | 0.191777258014368 | 0.904111370992816 |
| 32 | 0.0663975525463033 | 0.132795105092607 | 0.933602447453697 |
| 33 | 0.064157632257017 | 0.128315264514034 | 0.935842367742983 |
| 34 | 0.0508194639980202 | 0.10163892799604 | 0.94918053600198 |
| 35 | 0.0341270776082473 | 0.0682541552164947 | 0.965872922391753 |
| 36 | 0.0222963354779402 | 0.0445926709558804 | 0.97770366452206 |
| 37 | 0.0152319015816704 | 0.0304638031633409 | 0.98476809841833 |
| 38 | 0.0146398258566232 | 0.0292796517132464 | 0.985360174143377 |
| 39 | 0.0154207798198865 | 0.030841559639773 | 0.984579220180113 |
| 40 | 0.00973531748176848 | 0.019470634963537 | 0.990264682518232 |
| 41 | 0.00575038160852871 | 0.0115007632170574 | 0.994249618391471 |
| 42 | 0.00313722602751666 | 0.00627445205503332 | 0.996862773972483 |
| 43 | 0.944802399680629 | 0.110395200638742 | 0.055197600319371 |
| 44 | 0.936498982043062 | 0.127002035913876 | 0.0635010179569382 |
| 45 | 0.919875739800524 | 0.160248520398952 | 0.0801242601994759 |
| 46 | 0.891715955669532 | 0.216568088660936 | 0.108284044330468 |
| 47 | 0.862152847836543 | 0.275694304326914 | 0.137847152163457 |
| 48 | 0.857123277296281 | 0.285753445407438 | 0.142876722703719 |
| 49 | 0.91284387043937 | 0.174312259121259 | 0.0871561295606297 |
| 50 | 0.859527208455108 | 0.280945583089784 | 0.140472791544892 |
| 51 | 0.986003347358056 | 0.0279933052838879 | 0.013996652641944 |
| 52 | 0.98980639121003 | 0.0203872175799405 | 0.0101936087899702 |
| 53 | 0.989071277974966 | 0.0218574440500679 | 0.010928722025034 |
| Meta Analysis of Goldfeld-Quandt test for Heteroskedasticity | |||
| Description | # significant tests | % significant tests | OK/NOK |
| 1% type I error level | 1 | 0.0212765957446809 | NOK |
| 5% type I error level | 10 | 0.212765957446809 | NOK |
| 10% type I error level | 13 | 0.276595744680851 | NOK |