| Multiple Linear Regression - Estimated Regression Equation |
| Mortality[t] = -10.8466082959961 + 0.418536397035318Marriages[t] + e[t] |
| Multiple Linear Regression - Ordinary Least Squares | |||||
| Variable | Parameter | S.D. | T-STAT H0: parameter = 0 | 2-tail p-value | 1-tail p-value |
| (Intercept) | -10.8466082959961 | 1.424473 | -7.6145 | 0 | 0 |
| Marriages | 0.418536397035318 | 0.020391 | 20.5251 | 0 | 0 |
| Multiple Linear Regression - Regression Statistics | |
| Multiple R | 0.951542739573772 |
| R-squared | 0.905433585235559 |
| Adjusted R-squared | 0.903284348536367 |
| F-TEST (value) | 421.281464985229 |
| F-TEST (DF numerator) | 1 |
| F-TEST (DF denominator) | 44 |
| p-value | 0 |
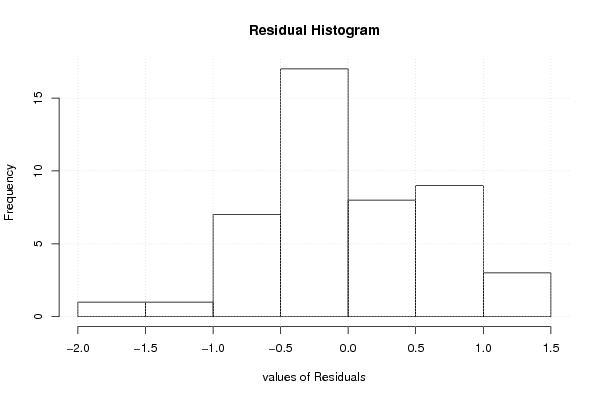
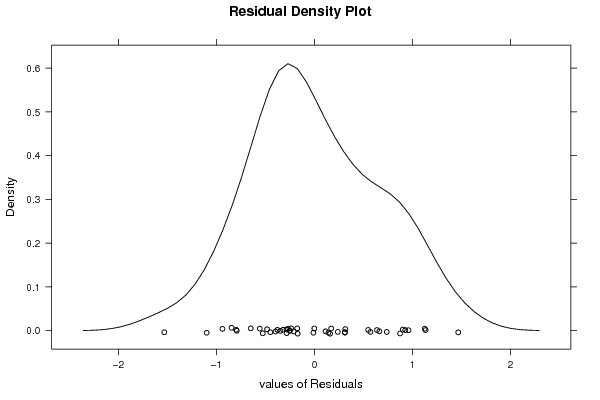
| Multiple Linear Regression - Residual Statistics | |
| Residual Standard Deviation | 0.664157814332693 |
| Sum Squared Residuals | 19.4086465029239 |
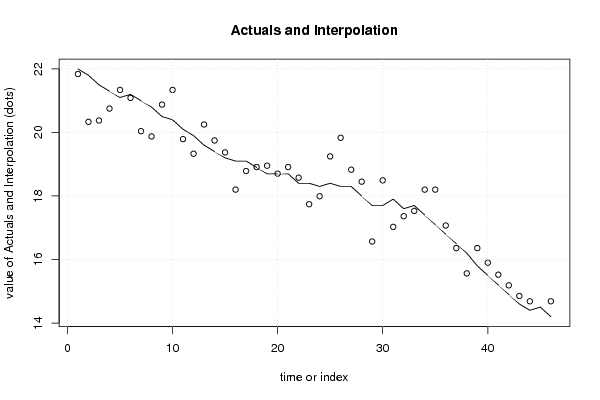
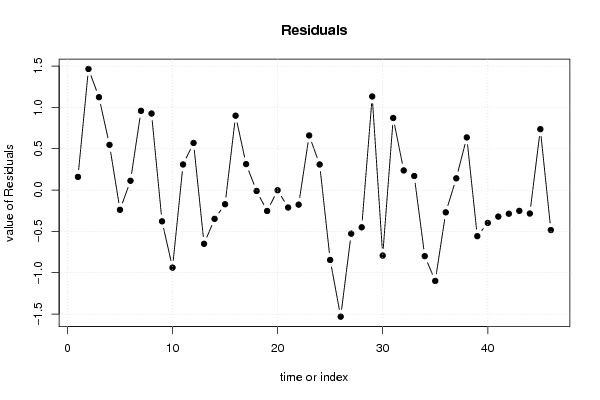
| Multiple Linear Regression - Actuals, Interpolation, and Residuals | |||
| Time or Index | Actuals | Interpolation Forecast | Residuals Prediction Error |
| 1 | 22 | 21.8410843124622 | 0.158915687537823 |
| 2 | 21.8 | 20.334353283135 | 1.46564671686495 |
| 3 | 21.5 | 20.3762069228386 | 1.12379307716142 |
| 4 | 21.3 | 20.7528896801704 | 0.547110319829634 |
| 5 | 21.1 | 21.3388406360198 | -0.238840636019812 |
| 6 | 21.2 | 21.0877187977986 | 0.11228120220138 |
| 7 | 21 | 20.0413778052103 | 0.958622194789674 |
| 8 | 20.8 | 19.8739632463962 | 0.926036753603799 |
| 9 | 20.5 | 20.878450599281 | -0.378450599280961 |
| 10 | 20.4 | 21.3388406360198 | -0.938840636019816 |
| 11 | 20.1 | 19.7902559669891 | 0.309744033010864 |
| 12 | 19.9 | 19.3298659302503 | 0.570134069749714 |
| 13 | 19.6 | 20.250646003728 | -0.650646003727983 |
| 14 | 19.4 | 19.7484023272856 | -0.348402327285604 |
| 15 | 19.2 | 19.3717195699538 | -0.171719569953821 |
| 16 | 19.1 | 18.1998176582549 | 0.900182341745069 |
| 17 | 19.1 | 18.7857686141044 | 0.314231385895628 |
| 18 | 18.9 | 18.911329533215 | -0.0113295332149686 |
| 19 | 18.7 | 18.9531831729185 | -0.253183172918503 |
| 20 | 18.7 | 18.7020613346973 | -0.00206133469730908 |
| 21 | 18.7 | 18.911329533215 | -0.211329533214968 |
| 22 | 18.4 | 18.5765004155867 | -0.176500415586716 |
| 23 | 18.4 | 17.7394276215161 | 0.66057237848392 |
| 24 | 18.3 | 17.9905494597373 | 0.309450540262728 |
| 25 | 18.4 | 19.2461586508432 | -0.846158650843228 |
| 26 | 18.3 | 19.8321096066927 | -1.53210960669267 |
| 27 | 18.3 | 18.8276222538079 | -0.527622253807908 |
| 28 | 18 | 18.4509394964761 | -0.45093949647612 |
| 29 | 17.7 | 16.5675257098172 | 1.13247429018281 |
| 30 | 17.7 | 18.4927931361796 | -0.79279313617965 |
| 31 | 17.9 | 17.027915746556 | 0.872084253443961 |
| 32 | 17.6 | 17.3627448641843 | 0.237255135815705 |
| 33 | 17.7 | 17.5301594229984 | 0.169840577001579 |
| 34 | 17.4 | 18.1998176582549 | -0.799817658254934 |
| 35 | 17.1 | 18.1998176582549 | -1.09981765825493 |
| 36 | 16.8 | 17.0697693862596 | -0.269769386259573 |
| 37 | 16.5 | 16.3582575112995 | 0.141742488700468 |
| 38 | 16.2 | 15.5630383569324 | 0.636961643067571 |
| 39 | 15.8 | 16.3582575112995 | -0.558257511299531 |
| 40 | 15.5 | 15.8978674745607 | -0.397867474560682 |
| 41 | 15.2 | 15.5211847172289 | -0.321184717228897 |
| 42 | 14.9 | 15.1863555996006 | -0.286355599600644 |
| 43 | 14.6 | 14.8515264819724 | -0.251526481972389 |
| 44 | 14.4 | 14.6841119231583 | -0.284111923158262 |
| 45 | 14.5 | 13.7633318496806 | 0.736668150319438 |
| 46 | 14.2 | 14.6841119231583 | -0.484111923158263 |
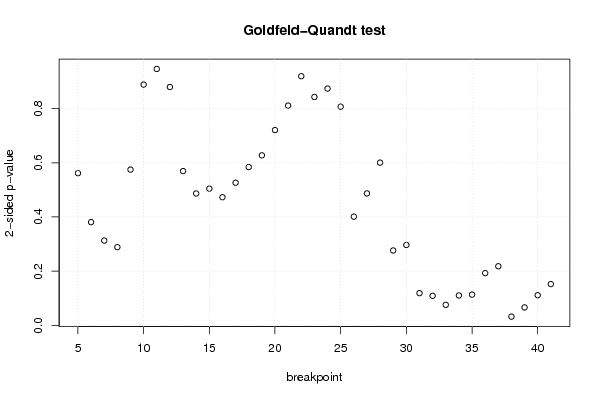
| Goldfeld-Quandt test for Heteroskedasticity | |||
| p-values | Alternative Hypothesis | ||
| breakpoint index | greater | 2-sided | less |
| 5 | 0.28078120692372 | 0.56156241384744 | 0.71921879307628 |
| 6 | 0.190501437961849 | 0.381002875923698 | 0.809498562038151 |
| 7 | 0.156457122087337 | 0.312914244174674 | 0.843542877912663 |
| 8 | 0.14430833554224 | 0.28861667108448 | 0.85569166445776 |
| 9 | 0.28737805236398 | 0.574756104727961 | 0.71262194763602 |
| 10 | 0.44422301101726 | 0.88844602203452 | 0.55577698898274 |
| 11 | 0.526910387979016 | 0.946179224041967 | 0.473089612020984 |
| 12 | 0.560216369690387 | 0.879567260619225 | 0.439783630309613 |
| 13 | 0.715323839115828 | 0.569352321768343 | 0.284676160884172 |
| 14 | 0.756723481349917 | 0.486553037300166 | 0.243276518650083 |
| 15 | 0.747754057218415 | 0.50449188556317 | 0.252245942781585 |
| 16 | 0.763586479881827 | 0.472827040236347 | 0.236413520118173 |
| 17 | 0.736796188053639 | 0.526407623892723 | 0.263203811946361 |
| 18 | 0.707869744854902 | 0.584260510290196 | 0.292130255145098 |
| 19 | 0.686325703474448 | 0.627348593051103 | 0.313674296525552 |
| 20 | 0.639686195733207 | 0.720627608533587 | 0.360313804266793 |
| 21 | 0.594533460673779 | 0.810933078652441 | 0.405466539326221 |
| 22 | 0.540319699413905 | 0.91936060117219 | 0.459680300586095 |
| 23 | 0.578623353336809 | 0.842753293326382 | 0.421376646663191 |
| 24 | 0.5630646888191 | 0.8738706223618 | 0.4369353111809 |
| 25 | 0.596505264799532 | 0.806989470400937 | 0.403494735200468 |
| 26 | 0.799379554180933 | 0.401240891638135 | 0.200620445819067 |
| 27 | 0.756559702359297 | 0.486880595281406 | 0.243440297640703 |
| 28 | 0.69972741885788 | 0.60054516228424 | 0.30027258114212 |
| 29 | 0.861831222046099 | 0.276337555907801 | 0.138168777953901 |
| 30 | 0.851636165880308 | 0.296727668239385 | 0.148363834119692 |
| 31 | 0.940577821171609 | 0.118844357656781 | 0.0594221788283905 |
| 32 | 0.9454979773104 | 0.1090040453792 | 0.0545020226896 |
| 33 | 0.96210128416235 | 0.0757974316752993 | 0.0378987158376496 |
| 34 | 0.94479255988329 | 0.110414880233421 | 0.0552074401167103 |
| 35 | 0.94323798978526 | 0.113524020429481 | 0.0567620102147403 |
| 36 | 0.903582670770372 | 0.192834658459256 | 0.0964173292296278 |
| 37 | 0.890932530211731 | 0.218134939576537 | 0.109067469788269 |
| 38 | 0.983909318560374 | 0.0321813628792523 | 0.0160906814396261 |
| 39 | 0.966871993973816 | 0.0662560120523688 | 0.0331280060261844 |
| 40 | 0.944356857865867 | 0.111286284268266 | 0.0556431421341329 |
| 41 | 0.923801324244532 | 0.152397351510936 | 0.0761986757554678 |
| Meta Analysis of Goldfeld-Quandt test for Heteroskedasticity | |||
| Description | # significant tests | % significant tests | OK/NOK |
| 1% type I error level | 0 | 0 | OK |
| 5% type I error level | 1 | 0.027027027027027 | OK |
| 10% type I error level | 3 | 0.0810810810810811 | OK |