| Multiple Linear Regression - Estimated Regression Equation |
| Totaal_Belgie[t] = + 150600.618694122 + 141445.988369693month[t] -1.50760219050626Basisonderwijs[t] + 1.9140252136709Secundair_onderwijs[t] -19.3525202293873Academische_bachelor[t] -0.484937104063357Professionele_bachelor[t] + 2.78153637504618Master_doctoraat[t] + e[t] |
| Multiple Linear Regression - Ordinary Least Squares | |||||
| Variable | Parameter | S.D. | T-STAT H0: parameter = 0 | 2-tail p-value | 1-tail p-value |
| (Intercept) | 150600.618694122 | 8120.044893 | 18.5468 | 0 | 0 |
| month | 141445.988369693 | 306128.571474 | 0.462 | 0.645938 | 0.322969 |
| Basisonderwijs | -1.50760219050626 | 0.129403 | -11.6505 | 0 | 0 |
| Secundair_onderwijs | 1.9140252136709 | 0.070365 | 27.2013 | 0 | 0 |
| Academische_bachelor | -19.3525202293873 | 0.68298 | -28.3354 | 0 | 0 |
| Professionele_bachelor | -0.484937104063357 | 0.211343 | -2.2945 | 0.025749 | 0.012874 |
| Master_doctoraat | 2.78153637504618 | 0.394401 | 7.0526 | 0 | 0 |
| Multiple Linear Regression - Regression Statistics | |
| Multiple R | 0.997134444680921 |
| R-squared | 0.99427710076913 |
| Adjusted R-squared | 0.993629225384503 |
| F-TEST (value) | 1534.67337139508 |
| F-TEST (DF numerator) | 6 |
| F-TEST (DF denominator) | 53 |
| p-value | 0 |
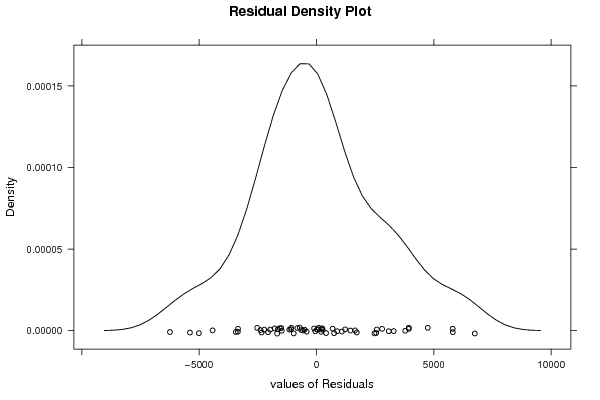
| Multiple Linear Regression - Residual Statistics | |
| Residual Standard Deviation | 2884.42523577183 |
| Sum Squared Residuals | 440955173.860141 |
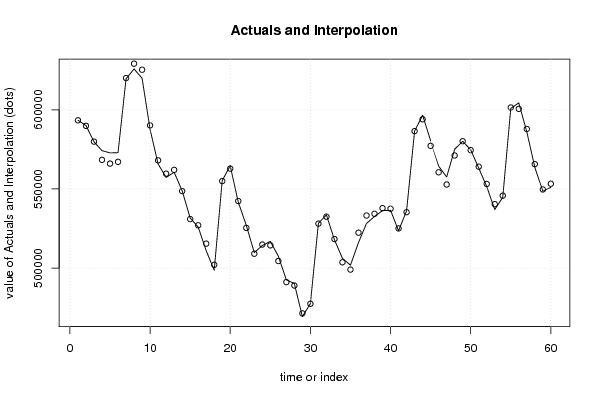
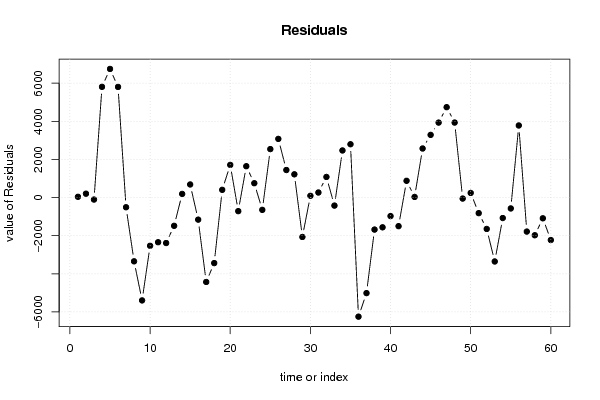
| Multiple Linear Regression - Actuals, Interpolation, and Residuals | |||
| Time or Index | Actuals | Interpolation Forecast | Residuals Prediction Error |
| 1 | 593408 | 593365.460093331 | 42.5399066692654 |
| 2 | 590072 | 589866.640896605 | 205.359103395108 |
| 3 | 579799 | 579900.87236199 | -101.872361989768 |
| 4 | 574205 | 568394.886507188 | 5810.11349281206 |
| 5 | 572775 | 566026.068940048 | 6748.93105995235 |
| 6 | 572942 | 567136.90064169 | 5805.09935830991 |
| 7 | 619567 | 620073.209203625 | -506.20920362467 |
| 8 | 625809 | 629151.955423072 | -3342.9554230716 |
| 9 | 619916 | 625308.776366407 | -5392.77636640665 |
| 10 | 587625 | 590152.192463171 | -2527.19246317135 |
| 11 | 565742 | 568082.804783283 | -2340.804783283 |
| 12 | 557274 | 559657.105765262 | -2383.10576526183 |
| 13 | 560576 | 562055.948628959 | -1479.94862895886 |
| 14 | 548854 | 548660.344333037 | 193.655666963216 |
| 15 | 531673 | 530983.716778947 | 689.283221052598 |
| 16 | 525919 | 527075.020495801 | -1156.02049580066 |
| 17 | 511038 | 515463.911702528 | -4425.91170252812 |
| 18 | 498662 | 502097.857065778 | -3435.85706577761 |
| 19 | 555362 | 554953.803693827 | 408.196306173395 |
| 20 | 564591 | 562874.93799459 | 1716.06200541017 |
| 21 | 541657 | 542368.051881226 | -711.051881226493 |
| 22 | 527070 | 525423.631154315 | 1646.36884568519 |
| 23 | 509846 | 509092.094304303 | 753.905695696632 |
| 24 | 514258 | 514900.410768887 | -642.410768887399 |
| 25 | 516922 | 514377.159215624 | 2544.84078437599 |
| 26 | 507561 | 504480.8331853 | 3080.16681469997 |
| 27 | 492622 | 491174.707623771 | 1447.29237622896 |
| 28 | 490243 | 489021.2054893 | 1221.79451069976 |
| 29 | 469357 | 471421.214525017 | -2064.21452501745 |
| 30 | 477580 | 477484.607414163 | 95.3925858373301 |
| 31 | 528379 | 528111.569901399 | 267.430098600651 |
| 32 | 533590 | 532506.352486875 | 1083.64751312532 |
| 33 | 517945 | 518363.699931224 | -418.699931224091 |
| 34 | 506174 | 503700.687389821 | 2473.31261017873 |
| 35 | 501866 | 499067.327556945 | 2798.6724430546 |
| 36 | 516141 | 522385.869276924 | -6244.86927692431 |
| 37 | 528222 | 533232.753224022 | -5010.7532240217 |
| 38 | 532638 | 534314.715837586 | -1676.71583758548 |
| 39 | 536322 | 537880.85557604 | -1558.85557603977 |
| 40 | 536535 | 537504.806922457 | -969.806922456722 |
| 41 | 523597 | 525095.699951209 | -1498.69995120941 |
| 42 | 536214 | 535332.589186961 | 881.410813039364 |
| 43 | 586570 | 586534.776961961 | 35.2230380387101 |
| 44 | 596594 | 594017.951161838 | 2576.04883816234 |
| 45 | 580523 | 577232.258973029 | 3290.74102697072 |
| 46 | 564478 | 560543.705751242 | 3934.29424875815 |
| 47 | 557560 | 552816.786764149 | 4743.21323585118 |
| 48 | 575093 | 571156.561538061 | 3936.43846193948 |
| 49 | 580112 | 580162.204273367 | -50.2042733670932 |
| 50 | 574761 | 574515.905692037 | 245.094307962594 |
| 51 | 563250 | 564065.21380691 | -815.213806909673 |
| 52 | 551531 | 553175.498856334 | -1644.49885633445 |
| 53 | 537034 | 540384.252499769 | -3350.25249976864 |
| 54 | 544686 | 545757.47420192 | -1071.47420191977 |
| 55 | 600901 | 601469.489879776 | -568.489879775694 |
| 56 | 604378 | 600594.441538857 | 3783.55846114301 |
| 57 | 586111 | 587893.345970535 | -1782.34597053486 |
| 58 | 563698 | 565672.454877379 | -1974.45487737908 |
| 59 | 548604 | 549689.984724472 | -1085.98472447208 |
| 60 | 551074 | 553300.435585858 | -2226.43558585846 |
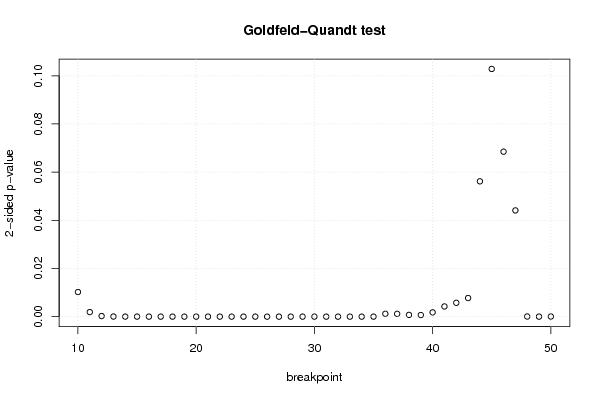
| Goldfeld-Quandt test for Heteroskedasticity | |||
| p-values | Alternative Hypothesis | ||
| breakpoint index | greater | 2-sided | less |
| 10 | 0.00511501413384937 | 0.0102300282676987 | 0.994884985866151 |
| 11 | 0.000948954710444579 | 0.00189790942088916 | 0.999051045289555 |
| 12 | 0.000122085633321525 | 0.000244171266643049 | 0.999877914366678 |
| 13 | 2.05351267683759e-05 | 4.10702535367518e-05 | 0.999979464873232 |
| 14 | 1.0168504485048e-05 | 2.03370089700961e-05 | 0.999989831495515 |
| 15 | 9.89693236445832e-06 | 1.97938647289166e-05 | 0.999990103067636 |
| 16 | 1.68406302244851e-06 | 3.36812604489702e-06 | 0.999998315936978 |
| 17 | 2.77939667252218e-07 | 5.55879334504437e-07 | 0.999999722060333 |
| 18 | 1.23048971892493e-07 | 2.46097943784987e-07 | 0.999999876951028 |
| 19 | 1.42020262529466e-07 | 2.84040525058931e-07 | 0.999999857979737 |
| 20 | 7.40618444084929e-08 | 1.48123688816986e-07 | 0.999999925938156 |
| 21 | 7.36508839328658e-08 | 1.47301767865732e-07 | 0.999999926349116 |
| 22 | 2.63796573243251e-08 | 5.27593146486502e-08 | 0.999999973620343 |
| 23 | 6.78810697837373e-09 | 1.35762139567475e-08 | 0.999999993211893 |
| 24 | 3.41110236731924e-09 | 6.82220473463849e-09 | 0.999999996588898 |
| 25 | 7.40426817330591e-10 | 1.48085363466118e-09 | 0.999999999259573 |
| 26 | 3.32022699083735e-10 | 6.64045398167469e-10 | 0.999999999667977 |
| 27 | 1.0846496786319e-10 | 2.16929935726379e-10 | 0.999999999891535 |
| 28 | 5.97653405243419e-11 | 1.19530681048684e-10 | 0.999999999940235 |
| 29 | 1.17786440951125e-11 | 2.35572881902251e-11 | 0.999999999988221 |
| 30 | 7.39614639385966e-12 | 1.47922927877193e-11 | 0.999999999992604 |
| 31 | 9.76582938533953e-12 | 1.95316587706791e-11 | 0.999999999990234 |
| 32 | 5.67476871012927e-12 | 1.13495374202585e-11 | 0.999999999994325 |
| 33 | 1.36996956554422e-12 | 2.73993913108844e-12 | 0.99999999999863 |
| 34 | 3.88982899873514e-12 | 7.77965799747027e-12 | 0.99999999999611 |
| 35 | 7.03135784211526e-10 | 1.40627156842305e-09 | 0.999999999296864 |
| 36 | 0.000599334170531302 | 0.0011986683410626 | 0.999400665829469 |
| 37 | 0.000583332079715627 | 0.00116666415943125 | 0.999416667920284 |
| 38 | 0.000366135227023599 | 0.000732270454047197 | 0.999633864772976 |
| 39 | 0.000336315383620513 | 0.000672630767241027 | 0.999663684616379 |
| 40 | 0.000890680931598837 | 0.00178136186319767 | 0.999109319068401 |
| 41 | 0.00211573837832292 | 0.00423147675664584 | 0.997884261621677 |
| 42 | 0.0028777319993049 | 0.0057554639986098 | 0.997122268000695 |
| 43 | 0.00386845608189415 | 0.0077369121637883 | 0.996131543918106 |
| 44 | 0.0280981422627844 | 0.0561962845255689 | 0.971901857737216 |
| 45 | 0.0514286639254385 | 0.102857327850877 | 0.948571336074561 |
| 46 | 0.0342518182670725 | 0.068503636534145 | 0.965748181732928 |
| 47 | 0.0220568933677004 | 0.0441137867354008 | 0.9779431066323 |
| 48 | 0.999967518793151 | 6.49624136978587e-05 | 3.24812068489293e-05 |
| 49 | 0.999998854772453 | 2.29045509398348e-06 | 1.14522754699174e-06 |
| 50 | 0.999971271420344 | 5.74571593109944e-05 | 2.87285796554972e-05 |
| Meta Analysis of Goldfeld-Quandt test for Heteroskedasticity | |||
| Description | # significant tests | % significant tests | OK/NOK |
| 1% type I error level | 36 | 0.878048780487805 | NOK |
| 5% type I error level | 38 | 0.926829268292683 | NOK |
| 10% type I error level | 40 | 0.975609756097561 | NOK |