| Multiple Linear Regression - Estimated Regression Equation |
| Totaal_Belgie[t] = + 152769.308595009 -1.51346500983016Basisonderwijs[t] + 1.90442950348616Secundair_onderwijs[t] -19.33501958436Academische_bachelor[t] -0.49648463422959Professionele_bachelor[t] + 2.86855001319678Master_doctoraat[t] + e[t] |
| Multiple Linear Regression - Ordinary Least Squares | |||||
| Variable | Parameter | S.D. | T-STAT H0: parameter = 0 | 2-tail p-value | 1-tail p-value |
| (Intercept) | 152769.308595009 | 6577.63677 | 23.2256 | 0 | 0 |
| Basisonderwijs | -1.51346500983016 | 0.127838 | -11.839 | 0 | 0 |
| Secundair_onderwijs | 1.90442950348616 | 0.066739 | 28.5353 | 0 | 0 |
| Academische_bachelor | -19.33501958436 | 0.676945 | -28.5622 | 0 | 0 |
| Professionele_bachelor | -0.49648463422959 | 0.208326 | -2.3832 | 0.02071 | 0.010355 |
| Master_doctoraat | 2.86855001319678 | 0.344003 | 8.3387 | 0 | 0 |
| Multiple Linear Regression - Regression Statistics | |
| Multiple R | 0.997122885353328 |
| R-squared | 0.994254048495346 |
| Adjusted R-squared | 0.99372201594862 |
| F-TEST (value) | 1868.78425880436 |
| F-TEST (DF numerator) | 5 |
| F-TEST (DF denominator) | 54 |
| p-value | 0 |
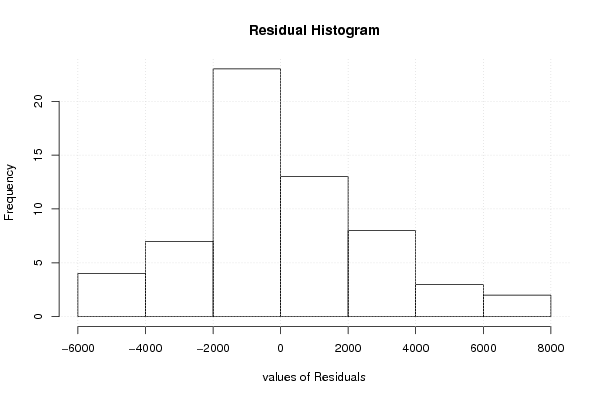
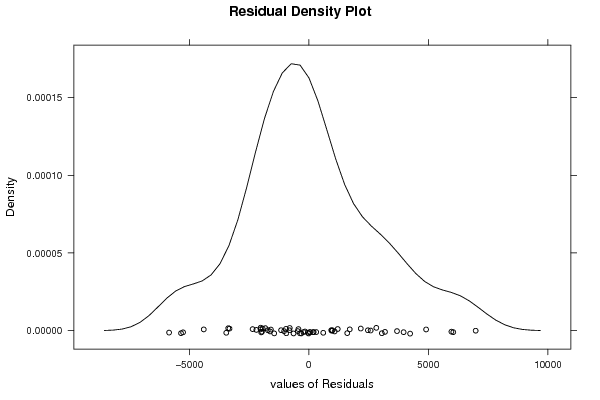
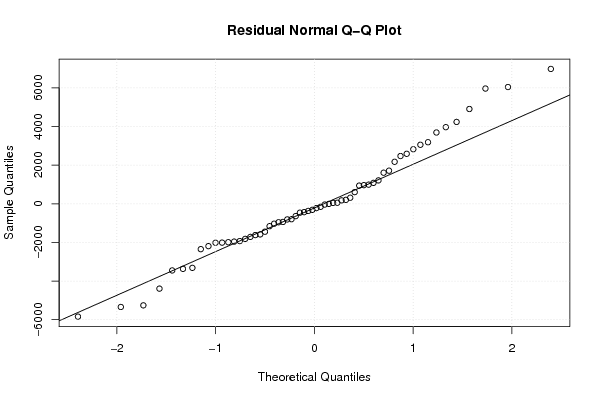
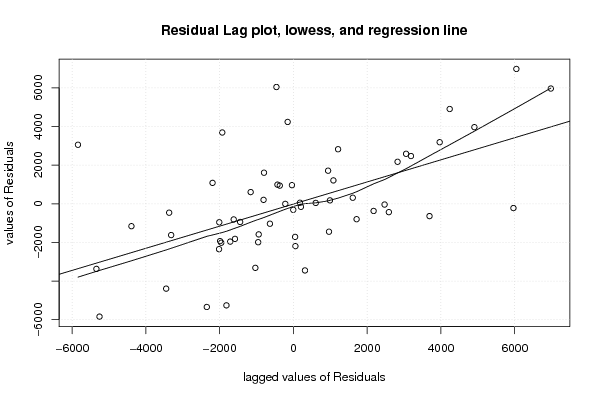
| Multiple Linear Regression - Residual Statistics | |
| Residual Standard Deviation | 2863.34230651205 |
| Sum Squared Residuals | 442731374.870135 |
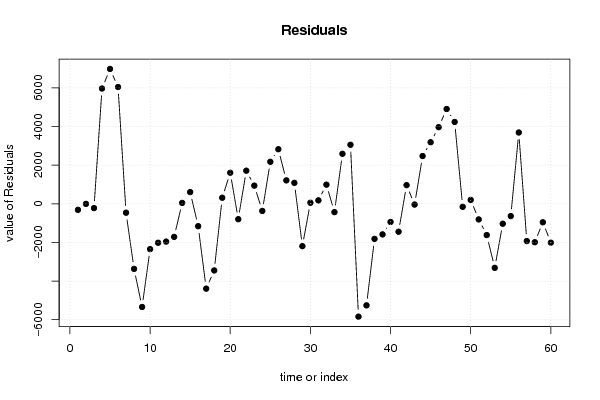
| Multiple Linear Regression - Actuals, Interpolation, and Residuals | |||
| Time or Index | Actuals | Interpolation Forecast | Residuals Prediction Error |
| 1 | 593408 | 593722.085617148 | -314.085617147545 |
| 2 | 590072 | 590077.993522805 | -5.993522805247 |
| 3 | 579799 | 580021.357607031 | -222.357607030943 |
| 4 | 574205 | 568239.563200851 | 5965.43679914858 |
| 5 | 572775 | 565795.298001512 | 6979.70199848762 |
| 6 | 572942 | 566897.792814737 | 6044.20718526333 |
| 7 | 619567 | 620028.930693189 | -461.930693189055 |
| 8 | 625809 | 629179.950777474 | -3370.95077747369 |
| 9 | 619916 | 625260.119734388 | -5344.11973438759 |
| 10 | 587625 | 589975.273047735 | -2350.27304773476 |
| 11 | 565742 | 567760.53679942 | -2018.5367994206 |
| 12 | 557274 | 559233.100062241 | -1959.10006224076 |
| 13 | 560576 | 562291.062198467 | -1715.06219846666 |
| 14 | 548854 | 548809.884895566 | 44.1151044337249 |
| 15 | 531673 | 531068.980854763 | 604.01914523745 |
| 16 | 525919 | 527079.742898277 | -1160.7428982773 |
| 17 | 511038 | 515432.090224353 | -4394.09022435346 |
| 18 | 498662 | 502114.077557284 | -3452.07755728433 |
| 19 | 555362 | 555050.055968138 | 311.944031862049 |
| 20 | 564591 | 562983.072839385 | 1607.92716061548 |
| 21 | 541657 | 542455.948982378 | -798.94898237836 |
| 22 | 527070 | 525358.162947676 | 1711.83705232416 |
| 23 | 509846 | 508907.183574165 | 938.816425835018 |
| 24 | 514258 | 514629.448423072 | -371.448423072419 |
| 25 | 516922 | 514748.972849986 | 2173.02715001362 |
| 26 | 507561 | 504737.813501463 | 2823.18649853689 |
| 27 | 492622 | 491411.95782861 | 1210.04217139043 |
| 28 | 490243 | 489160.553595615 | 1082.44640438479 |
| 29 | 469357 | 471551.529270199 | -2194.52927019871 |
| 30 | 477580 | 477527.694858116 | 52.3051418838427 |
| 31 | 528379 | 528203.219318435 | 175.780681565034 |
| 32 | 533590 | 532601.136611313 | 988.863388687345 |
| 33 | 517945 | 518379.169721692 | -434.169721692189 |
| 34 | 506174 | 503587.088399736 | 2586.91160026374 |
| 35 | 501866 | 498811.763275641 | 3054.23672435947 |
| 36 | 516141 | 521985.32654867 | -5844.32654867047 |
| 37 | 528222 | 533481.862994795 | -5259.86299479482 |
| 38 | 532638 | 534455.865363 | -1817.86536300038 |
| 39 | 536322 | 537908.036181773 | -1586.03618177346 |
| 40 | 536535 | 537477.385423685 | -942.38542368533 |
| 41 | 523597 | 525044.005014815 | -1447.00501481528 |
| 42 | 536214 | 535250.356734222 | 963.64326577752 |
| 43 | 586570 | 586610.590903952 | -40.590903952279 |
| 44 | 596594 | 594122.949664947 | 2471.05033505331 |
| 45 | 580523 | 577336.238028291 | 3186.76197170871 |
| 46 | 564478 | 560512.764979095 | 3965.23502090455 |
| 47 | 557560 | 552653.795006271 | 4906.20499372856 |
| 48 | 575093 | 570856.20950544 | 4236.79049456032 |
| 49 | 580112 | 580269.570411233 | -157.570411233439 |
| 50 | 574761 | 574558.111266877 | 202.888733123352 |
| 51 | 563250 | 564061.421401881 | -811.421401880524 |
| 52 | 551531 | 553151.530986708 | -1620.53098670804 |
| 53 | 537034 | 540351.128160362 | -3317.12816036179 |
| 54 | 544686 | 545719.439294336 | -1033.43929433646 |
| 55 | 600901 | 601539.637538031 | -638.637538030659 |
| 56 | 604378 | 600688.636965999 | 3689.36303400089 |
| 57 | 586111 | 588042.288232735 | -1931.28823273456 |
| 58 | 563698 | 565688.609907447 | -1990.60990744694 |
| 59 | 548604 | 549561.475462872 | -957.475462872055 |
| 60 | 551074 | 553086.1515497 | -2012.15154969971 |
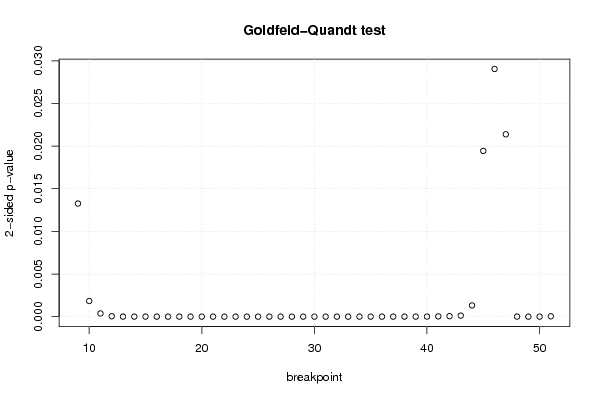
| Goldfeld-Quandt test for Heteroskedasticity | |||
| p-values | Alternative Hypothesis | ||
| breakpoint index | greater | 2-sided | less |
| 9 | 0.00663008306785656 | 0.0132601661357131 | 0.993369916932143 |
| 10 | 0.00091585805567109 | 0.00183171611134218 | 0.999084141944329 |
| 11 | 0.000187348995642813 | 0.000374697991285626 | 0.999812651004357 |
| 12 | 2.35814216482708e-05 | 4.71628432965417e-05 | 0.999976418578352 |
| 13 | 2.8867271565482e-06 | 5.7734543130964e-06 | 0.999997113272843 |
| 14 | 1.79799581294241e-06 | 3.59599162588482e-06 | 0.999998202004187 |
| 15 | 3.40164605795806e-06 | 6.80329211591611e-06 | 0.999996598353942 |
| 16 | 5.68409007228854e-07 | 1.13681801445771e-06 | 0.999999431590993 |
| 17 | 1.08471970253277e-07 | 2.16943940506555e-07 | 0.99999989152803 |
| 18 | 8.32478117584328e-08 | 1.66495623516866e-07 | 0.999999916752188 |
| 19 | 7.41581702627206e-07 | 1.48316340525441e-06 | 0.999999258418297 |
| 20 | 6.76955018087571e-07 | 1.35391003617514e-06 | 0.999999323044982 |
| 21 | 3.73718292023557e-07 | 7.47436584047114e-07 | 0.999999626281708 |
| 22 | 1.0069462328305e-07 | 2.013892465661e-07 | 0.999999899305377 |
| 23 | 2.22799210695804e-08 | 4.45598421391607e-08 | 0.99999997772008 |
| 24 | 6.3122955231411e-09 | 1.26245910462822e-08 | 0.999999993687704 |
| 25 | 2.04329965283201e-09 | 4.08659930566403e-09 | 0.9999999979567 |
| 26 | 8.5671155551938e-10 | 1.71342311103876e-09 | 0.999999999143288 |
| 27 | 2.62128332587269e-10 | 5.24256665174538e-10 | 0.999999999737872 |
| 28 | 1.43396518113867e-10 | 2.86793036227734e-10 | 0.999999999856603 |
| 29 | 3.05527985995962e-11 | 6.11055971991924e-11 | 0.999999999969447 |
| 30 | 1.58358425394381e-11 | 3.16716850788762e-11 | 0.999999999984164 |
| 31 | 2.13649035053301e-11 | 4.27298070106603e-11 | 0.999999999978635 |
| 32 | 1.43516386058354e-11 | 2.87032772116709e-11 | 0.999999999985648 |
| 33 | 3.49034984663204e-12 | 6.98069969326409e-12 | 0.99999999999651 |
| 34 | 3.64332345677015e-12 | 7.2866469135403e-12 | 0.999999999996357 |
| 35 | 3.05351717382539e-10 | 6.10703434765078e-10 | 0.999999999694648 |
| 36 | 1.40252977032151e-08 | 2.80505954064302e-08 | 0.999999985974702 |
| 37 | 4.40928674803785e-07 | 8.8185734960757e-07 | 0.999999559071325 |
| 38 | 5.41179615930648e-07 | 1.0823592318613e-06 | 0.999999458820384 |
| 39 | 9.96562211882116e-07 | 1.99312442376423e-06 | 0.999999003437788 |
| 40 | 3.41746762403235e-06 | 6.8349352480647e-06 | 0.999996582532376 |
| 41 | 1.70193262432873e-05 | 3.40386524865747e-05 | 0.999982980673757 |
| 42 | 2.738164452805e-05 | 5.47632890561e-05 | 0.999972618355472 |
| 43 | 6.02694539351849e-05 | 0.00012053890787037 | 0.999939730546065 |
| 44 | 0.00065826429831748 | 0.00131652859663496 | 0.999341735701682 |
| 45 | 0.0097167442891254 | 0.0194334885782508 | 0.990283255710875 |
| 46 | 0.0145218992797701 | 0.0290437985595403 | 0.98547810072023 |
| 47 | 0.0106912835184755 | 0.021382567036951 | 0.989308716481525 |
| 48 | 0.999996100839934 | 7.79832013139093e-06 | 3.89916006569546e-06 |
| 49 | 0.999999966849748 | 6.63005043842632e-08 | 3.31502521921316e-08 |
| 50 | 0.99999927879761 | 1.44240478054393e-06 | 7.21202390271965e-07 |
| 51 | 0.999980487148702 | 3.90257025967444e-05 | 1.95128512983722e-05 |
| Meta Analysis of Goldfeld-Quandt test for Heteroskedasticity | |||
| Description | # significant tests | % significant tests | OK/NOK |
| 1% type I error level | 39 | 0.906976744186046 | NOK |
| 5% type I error level | 43 | 1 | NOK |
| 10% type I error level | 43 | 1 | NOK |