Free Statistics

of Irreproducible Research!

Author's title

Author*Unverified author*
R Software Modulerwasp_autocorrelation.wasp
Title produced by software(Partial) Autocorrelation Function
Date of computationSun, 20 Nov 2011 08:23:46 -0500
Cite this page as followsStatistical Computations at FreeStatistics.org, Office for Research Development and Education, URL https://freestatistics.org/blog/index.php?v=date/2011/Nov/20/t13217954593jis82ywr1ag2y4.htm/, Retrieved Fri, 26 Apr 2024 02:19:49 +0000
Statistical Computations at FreeStatistics.org, Office for Research Development and Education, URL https://freestatistics.org/blog/index.php?pk=145585, Retrieved Fri, 26 Apr 2024 02:19:49 +0000
QR Codes:

Original text written by user:
IsPrivate?No (this computation is public)
User-defined keywordsKDGP2W12
Estimated Impact131
Family? (F = Feedback message, R = changed R code, M = changed R Module, P = changed Parameters, D = changed Data)
-       [(Partial) Autocorrelation Function] [] [2011-11-20 13:23:46] [e09593412f775de82555261d5bbd0b3f] [Current]
Feedback Forum

Post a new message
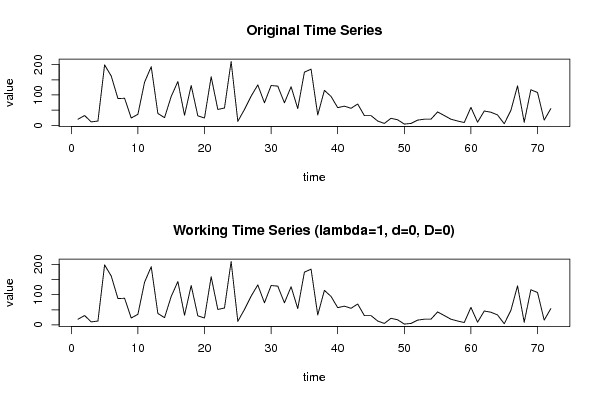
Dataseries X:
20
32
11
14
199
162
88
89
24
36
142
193
39
25
95
144
33
131
31
24
160
52
57
210
13
52
96
133
74
131
129
74
127
55
175
185
34
115
95
58
63
56
70
32
32
14
6
23
18
4
6
17
20
20
44
32
20
14
9
59
10
47
43
34
5
49
130
10
117
108
17
55


Summary of computational transaction
Raw Inputview raw input (R code)
Raw Outputview raw output of R engine
Computing time1 seconds
R Server'Gwilym Jenkins' @ jenkins.wessa.net

\begin{tabular}{lllllllll}
\hline
Summary of computational transaction \tabularnewline
Raw Input & view raw input (R code)  \tabularnewline
Raw Output & view raw output of R engine  \tabularnewline
Computing time & 1 seconds \tabularnewline
R Server & 'Gwilym Jenkins' @ jenkins.wessa.net \tabularnewline
\hline
\end{tabular}
%Source: https://freestatistics.org/blog/index.php?pk=145585&T=0

[TABLE]
[ROW][C]Summary of computational transaction[/C][/ROW]
[ROW][C]Raw Input[/C][C]view raw input (R code) [/C][/ROW]
[ROW][C]Raw Output[/C][C]view raw output of R engine [/C][/ROW]
[ROW][C]Computing time[/C][C]1 seconds[/C][/ROW]
[ROW][C]R Server[/C][C]'Gwilym Jenkins' @ jenkins.wessa.net[/C][/ROW]
[/TABLE]
Source: https://freestatistics.org/blog/index.php?pk=145585&T=0

Globally Unique Identifier (entire table): ba.freestatistics.org/blog/index.php?pk=145585&T=0

As an alternative you can also use a QR Code:  

The GUIDs for individual cells are displayed in the table below:

Summary of computational transaction
Raw Inputview raw input (R code)
Raw Outputview raw output of R engine
Computing time1 seconds
R Server'Gwilym Jenkins' @ jenkins.wessa.net


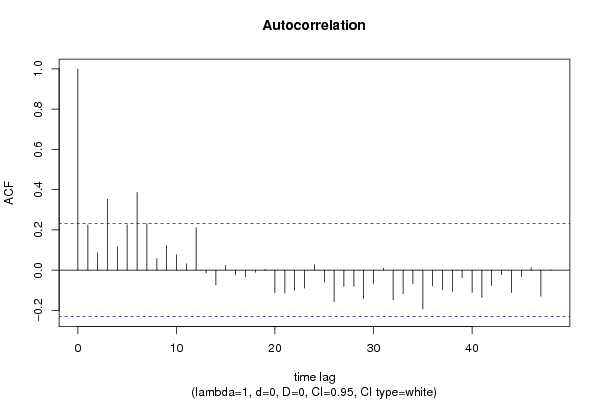
Autocorrelation Function
Time lag kACF(k)T-STATP-value
10.2245151.90510.030382
20.0871140.73920.231098
30.3528012.99360.001888
40.1150020.97580.166209
50.2254841.91330.029843
60.3857333.27310.000818
70.230561.95640.027151
80.0575830.48860.313301
90.1211161.02770.153764
100.0769840.65320.257845
110.0314680.2670.395109
120.2104731.78590.039162
13-0.013314-0.1130.455183
14-0.072788-0.61760.269385
150.0234420.19890.421446
16-0.022606-0.19180.424212
17-0.03346-0.28390.388645
18-0.00971-0.08240.467281
190.0048080.04080.483784
20-0.111863-0.94920.172851
21-0.113541-0.96340.169279
22-0.099346-0.8430.201017
23-0.088624-0.7520.227253
240.0274680.23310.408182
25-0.058025-0.49240.311983
26-0.156963-1.33190.093551
27-0.08076-0.68530.247688
28-0.079359-0.67340.25143
29-0.141612-1.20160.116724
30-0.065545-0.55620.28991
310.0091910.0780.469026
32-0.147824-1.25430.106889
33-0.116712-0.99030.162664
34-0.065963-0.55970.288706
35-0.192322-1.63190.053533
36-0.078062-0.66240.254923
37-0.096365-0.81770.208117
38-0.104759-0.88890.188505
39-0.038019-0.32260.373965
40-0.110482-0.93750.175825
41-0.13447-1.1410.128822
42-0.075756-0.64280.261193
43-0.022118-0.18770.42583
44-0.110798-0.94020.175141
45-0.033141-0.28120.389677
460.0113620.09640.461731
47-0.129385-1.09790.137961
48-0.000885-0.00750.497015

\begin{tabular}{lllllllll}
\hline
Autocorrelation Function \tabularnewline
Time lag k & ACF(k) & T-STAT & P-value \tabularnewline
1 & 0.224515 & 1.9051 & 0.030382 \tabularnewline
2 & 0.087114 & 0.7392 & 0.231098 \tabularnewline
3 & 0.352801 & 2.9936 & 0.001888 \tabularnewline
4 & 0.115002 & 0.9758 & 0.166209 \tabularnewline
5 & 0.225484 & 1.9133 & 0.029843 \tabularnewline
6 & 0.385733 & 3.2731 & 0.000818 \tabularnewline
7 & 0.23056 & 1.9564 & 0.027151 \tabularnewline
8 & 0.057583 & 0.4886 & 0.313301 \tabularnewline
9 & 0.121116 & 1.0277 & 0.153764 \tabularnewline
10 & 0.076984 & 0.6532 & 0.257845 \tabularnewline
11 & 0.031468 & 0.267 & 0.395109 \tabularnewline
12 & 0.210473 & 1.7859 & 0.039162 \tabularnewline
13 & -0.013314 & -0.113 & 0.455183 \tabularnewline
14 & -0.072788 & -0.6176 & 0.269385 \tabularnewline
15 & 0.023442 & 0.1989 & 0.421446 \tabularnewline
16 & -0.022606 & -0.1918 & 0.424212 \tabularnewline
17 & -0.03346 & -0.2839 & 0.388645 \tabularnewline
18 & -0.00971 & -0.0824 & 0.467281 \tabularnewline
19 & 0.004808 & 0.0408 & 0.483784 \tabularnewline
20 & -0.111863 & -0.9492 & 0.172851 \tabularnewline
21 & -0.113541 & -0.9634 & 0.169279 \tabularnewline
22 & -0.099346 & -0.843 & 0.201017 \tabularnewline
23 & -0.088624 & -0.752 & 0.227253 \tabularnewline
24 & 0.027468 & 0.2331 & 0.408182 \tabularnewline
25 & -0.058025 & -0.4924 & 0.311983 \tabularnewline
26 & -0.156963 & -1.3319 & 0.093551 \tabularnewline
27 & -0.08076 & -0.6853 & 0.247688 \tabularnewline
28 & -0.079359 & -0.6734 & 0.25143 \tabularnewline
29 & -0.141612 & -1.2016 & 0.116724 \tabularnewline
30 & -0.065545 & -0.5562 & 0.28991 \tabularnewline
31 & 0.009191 & 0.078 & 0.469026 \tabularnewline
32 & -0.147824 & -1.2543 & 0.106889 \tabularnewline
33 & -0.116712 & -0.9903 & 0.162664 \tabularnewline
34 & -0.065963 & -0.5597 & 0.288706 \tabularnewline
35 & -0.192322 & -1.6319 & 0.053533 \tabularnewline
36 & -0.078062 & -0.6624 & 0.254923 \tabularnewline
37 & -0.096365 & -0.8177 & 0.208117 \tabularnewline
38 & -0.104759 & -0.8889 & 0.188505 \tabularnewline
39 & -0.038019 & -0.3226 & 0.373965 \tabularnewline
40 & -0.110482 & -0.9375 & 0.175825 \tabularnewline
41 & -0.13447 & -1.141 & 0.128822 \tabularnewline
42 & -0.075756 & -0.6428 & 0.261193 \tabularnewline
43 & -0.022118 & -0.1877 & 0.42583 \tabularnewline
44 & -0.110798 & -0.9402 & 0.175141 \tabularnewline
45 & -0.033141 & -0.2812 & 0.389677 \tabularnewline
46 & 0.011362 & 0.0964 & 0.461731 \tabularnewline
47 & -0.129385 & -1.0979 & 0.137961 \tabularnewline
48 & -0.000885 & -0.0075 & 0.497015 \tabularnewline
\hline
\end{tabular}
%Source: https://freestatistics.org/blog/index.php?pk=145585&T=1

[TABLE]
[ROW][C]Autocorrelation Function[/C][/ROW]
[ROW][C]Time lag k[/C][C]ACF(k)[/C][C]T-STAT[/C][C]P-value[/C][/ROW]
[ROW][C]1[/C][C]0.224515[/C][C]1.9051[/C][C]0.030382[/C][/ROW]
[ROW][C]2[/C][C]0.087114[/C][C]0.7392[/C][C]0.231098[/C][/ROW]
[ROW][C]3[/C][C]0.352801[/C][C]2.9936[/C][C]0.001888[/C][/ROW]
[ROW][C]4[/C][C]0.115002[/C][C]0.9758[/C][C]0.166209[/C][/ROW]
[ROW][C]5[/C][C]0.225484[/C][C]1.9133[/C][C]0.029843[/C][/ROW]
[ROW][C]6[/C][C]0.385733[/C][C]3.2731[/C][C]0.000818[/C][/ROW]
[ROW][C]7[/C][C]0.23056[/C][C]1.9564[/C][C]0.027151[/C][/ROW]
[ROW][C]8[/C][C]0.057583[/C][C]0.4886[/C][C]0.313301[/C][/ROW]
[ROW][C]9[/C][C]0.121116[/C][C]1.0277[/C][C]0.153764[/C][/ROW]
[ROW][C]10[/C][C]0.076984[/C][C]0.6532[/C][C]0.257845[/C][/ROW]
[ROW][C]11[/C][C]0.031468[/C][C]0.267[/C][C]0.395109[/C][/ROW]
[ROW][C]12[/C][C]0.210473[/C][C]1.7859[/C][C]0.039162[/C][/ROW]
[ROW][C]13[/C][C]-0.013314[/C][C]-0.113[/C][C]0.455183[/C][/ROW]
[ROW][C]14[/C][C]-0.072788[/C][C]-0.6176[/C][C]0.269385[/C][/ROW]
[ROW][C]15[/C][C]0.023442[/C][C]0.1989[/C][C]0.421446[/C][/ROW]
[ROW][C]16[/C][C]-0.022606[/C][C]-0.1918[/C][C]0.424212[/C][/ROW]
[ROW][C]17[/C][C]-0.03346[/C][C]-0.2839[/C][C]0.388645[/C][/ROW]
[ROW][C]18[/C][C]-0.00971[/C][C]-0.0824[/C][C]0.467281[/C][/ROW]
[ROW][C]19[/C][C]0.004808[/C][C]0.0408[/C][C]0.483784[/C][/ROW]
[ROW][C]20[/C][C]-0.111863[/C][C]-0.9492[/C][C]0.172851[/C][/ROW]
[ROW][C]21[/C][C]-0.113541[/C][C]-0.9634[/C][C]0.169279[/C][/ROW]
[ROW][C]22[/C][C]-0.099346[/C][C]-0.843[/C][C]0.201017[/C][/ROW]
[ROW][C]23[/C][C]-0.088624[/C][C]-0.752[/C][C]0.227253[/C][/ROW]
[ROW][C]24[/C][C]0.027468[/C][C]0.2331[/C][C]0.408182[/C][/ROW]
[ROW][C]25[/C][C]-0.058025[/C][C]-0.4924[/C][C]0.311983[/C][/ROW]
[ROW][C]26[/C][C]-0.156963[/C][C]-1.3319[/C][C]0.093551[/C][/ROW]
[ROW][C]27[/C][C]-0.08076[/C][C]-0.6853[/C][C]0.247688[/C][/ROW]
[ROW][C]28[/C][C]-0.079359[/C][C]-0.6734[/C][C]0.25143[/C][/ROW]
[ROW][C]29[/C][C]-0.141612[/C][C]-1.2016[/C][C]0.116724[/C][/ROW]
[ROW][C]30[/C][C]-0.065545[/C][C]-0.5562[/C][C]0.28991[/C][/ROW]
[ROW][C]31[/C][C]0.009191[/C][C]0.078[/C][C]0.469026[/C][/ROW]
[ROW][C]32[/C][C]-0.147824[/C][C]-1.2543[/C][C]0.106889[/C][/ROW]
[ROW][C]33[/C][C]-0.116712[/C][C]-0.9903[/C][C]0.162664[/C][/ROW]
[ROW][C]34[/C][C]-0.065963[/C][C]-0.5597[/C][C]0.288706[/C][/ROW]
[ROW][C]35[/C][C]-0.192322[/C][C]-1.6319[/C][C]0.053533[/C][/ROW]
[ROW][C]36[/C][C]-0.078062[/C][C]-0.6624[/C][C]0.254923[/C][/ROW]
[ROW][C]37[/C][C]-0.096365[/C][C]-0.8177[/C][C]0.208117[/C][/ROW]
[ROW][C]38[/C][C]-0.104759[/C][C]-0.8889[/C][C]0.188505[/C][/ROW]
[ROW][C]39[/C][C]-0.038019[/C][C]-0.3226[/C][C]0.373965[/C][/ROW]
[ROW][C]40[/C][C]-0.110482[/C][C]-0.9375[/C][C]0.175825[/C][/ROW]
[ROW][C]41[/C][C]-0.13447[/C][C]-1.141[/C][C]0.128822[/C][/ROW]
[ROW][C]42[/C][C]-0.075756[/C][C]-0.6428[/C][C]0.261193[/C][/ROW]
[ROW][C]43[/C][C]-0.022118[/C][C]-0.1877[/C][C]0.42583[/C][/ROW]
[ROW][C]44[/C][C]-0.110798[/C][C]-0.9402[/C][C]0.175141[/C][/ROW]
[ROW][C]45[/C][C]-0.033141[/C][C]-0.2812[/C][C]0.389677[/C][/ROW]
[ROW][C]46[/C][C]0.011362[/C][C]0.0964[/C][C]0.461731[/C][/ROW]
[ROW][C]47[/C][C]-0.129385[/C][C]-1.0979[/C][C]0.137961[/C][/ROW]
[ROW][C]48[/C][C]-0.000885[/C][C]-0.0075[/C][C]0.497015[/C][/ROW]
[/TABLE]
Source: https://freestatistics.org/blog/index.php?pk=145585&T=1

Globally Unique Identifier (entire table): ba.freestatistics.org/blog/index.php?pk=145585&T=1

As an alternative you can also use a QR Code:  

The GUIDs for individual cells are displayed in the table below:

Autocorrelation Function
Time lag kACF(k)T-STATP-value
10.2245151.90510.030382
20.0871140.73920.231098
30.3528012.99360.001888
40.1150020.97580.166209
50.2254841.91330.029843
60.3857333.27310.000818
70.230561.95640.027151
80.0575830.48860.313301
90.1211161.02770.153764
100.0769840.65320.257845
110.0314680.2670.395109
120.2104731.78590.039162
13-0.013314-0.1130.455183
14-0.072788-0.61760.269385
150.0234420.19890.421446
16-0.022606-0.19180.424212
17-0.03346-0.28390.388645
18-0.00971-0.08240.467281
190.0048080.04080.483784
20-0.111863-0.94920.172851
21-0.113541-0.96340.169279
22-0.099346-0.8430.201017
23-0.088624-0.7520.227253
240.0274680.23310.408182
25-0.058025-0.49240.311983
26-0.156963-1.33190.093551
27-0.08076-0.68530.247688
28-0.079359-0.67340.25143
29-0.141612-1.20160.116724
30-0.065545-0.55620.28991
310.0091910.0780.469026
32-0.147824-1.25430.106889
33-0.116712-0.99030.162664
34-0.065963-0.55970.288706
35-0.192322-1.63190.053533
36-0.078062-0.66240.254923
37-0.096365-0.81770.208117
38-0.104759-0.88890.188505
39-0.038019-0.32260.373965
40-0.110482-0.93750.175825
41-0.13447-1.1410.128822
42-0.075756-0.64280.261193
43-0.022118-0.18770.42583
44-0.110798-0.94020.175141
45-0.033141-0.28120.389677
460.0113620.09640.461731
47-0.129385-1.09790.137961
48-0.000885-0.00750.497015


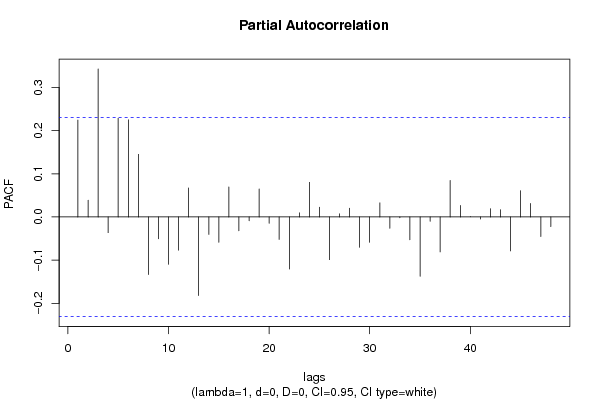
Partial Autocorrelation Function
Time lag kPACF(k)T-STATP-value
10.2245151.90510.030382
20.0386550.3280.371931
30.3431012.91130.002394
4-0.036356-0.30850.379299
50.2290111.94320.027949
60.2251631.91060.030021
70.1452071.23210.110955
8-0.133327-1.13130.130837
9-0.050412-0.42780.335051
10-0.10956-0.92960.177831
11-0.076803-0.65170.258337
120.0673720.57170.284662
13-0.181917-1.54360.063532
14-0.040288-0.34190.366727
15-0.058446-0.49590.310727
160.0693590.58850.27901
17-0.031723-0.26920.39428
18-0.008602-0.0730.47101
190.0649210.55090.291714
20-0.014343-0.12170.451735
21-0.051852-0.440.330634
22-0.120714-1.02430.154563
230.0096070.08150.467629
240.0802740.68110.248983
250.0226090.19180.424204
26-0.098801-0.83840.202304
270.0072260.06130.475639
280.0203270.17250.431772
29-0.070127-0.5950.276838
30-0.058602-0.49730.310262
310.0327930.27830.390804
32-0.026053-0.22110.412832
33-0.001984-0.01680.493307
34-0.052713-0.44730.328007
35-0.137364-1.16560.123818
36-0.009955-0.08450.46646
37-0.080814-0.68570.247544
380.0847030.71870.237317
390.026650.22610.410868
400.000230.0020.499223
41-0.004726-0.04010.484062
420.0189710.1610.436284
430.0168040.14260.443508
44-0.078523-0.66630.253679
450.06090.51680.303457
460.031320.26580.395594
47-0.045277-0.38420.350986
48-0.022269-0.1890.425329

\begin{tabular}{lllllllll}
\hline
Partial Autocorrelation Function \tabularnewline
Time lag k & PACF(k) & T-STAT & P-value \tabularnewline
1 & 0.224515 & 1.9051 & 0.030382 \tabularnewline
2 & 0.038655 & 0.328 & 0.371931 \tabularnewline
3 & 0.343101 & 2.9113 & 0.002394 \tabularnewline
4 & -0.036356 & -0.3085 & 0.379299 \tabularnewline
5 & 0.229011 & 1.9432 & 0.027949 \tabularnewline
6 & 0.225163 & 1.9106 & 0.030021 \tabularnewline
7 & 0.145207 & 1.2321 & 0.110955 \tabularnewline
8 & -0.133327 & -1.1313 & 0.130837 \tabularnewline
9 & -0.050412 & -0.4278 & 0.335051 \tabularnewline
10 & -0.10956 & -0.9296 & 0.177831 \tabularnewline
11 & -0.076803 & -0.6517 & 0.258337 \tabularnewline
12 & 0.067372 & 0.5717 & 0.284662 \tabularnewline
13 & -0.181917 & -1.5436 & 0.063532 \tabularnewline
14 & -0.040288 & -0.3419 & 0.366727 \tabularnewline
15 & -0.058446 & -0.4959 & 0.310727 \tabularnewline
16 & 0.069359 & 0.5885 & 0.27901 \tabularnewline
17 & -0.031723 & -0.2692 & 0.39428 \tabularnewline
18 & -0.008602 & -0.073 & 0.47101 \tabularnewline
19 & 0.064921 & 0.5509 & 0.291714 \tabularnewline
20 & -0.014343 & -0.1217 & 0.451735 \tabularnewline
21 & -0.051852 & -0.44 & 0.330634 \tabularnewline
22 & -0.120714 & -1.0243 & 0.154563 \tabularnewline
23 & 0.009607 & 0.0815 & 0.467629 \tabularnewline
24 & 0.080274 & 0.6811 & 0.248983 \tabularnewline
25 & 0.022609 & 0.1918 & 0.424204 \tabularnewline
26 & -0.098801 & -0.8384 & 0.202304 \tabularnewline
27 & 0.007226 & 0.0613 & 0.475639 \tabularnewline
28 & 0.020327 & 0.1725 & 0.431772 \tabularnewline
29 & -0.070127 & -0.595 & 0.276838 \tabularnewline
30 & -0.058602 & -0.4973 & 0.310262 \tabularnewline
31 & 0.032793 & 0.2783 & 0.390804 \tabularnewline
32 & -0.026053 & -0.2211 & 0.412832 \tabularnewline
33 & -0.001984 & -0.0168 & 0.493307 \tabularnewline
34 & -0.052713 & -0.4473 & 0.328007 \tabularnewline
35 & -0.137364 & -1.1656 & 0.123818 \tabularnewline
36 & -0.009955 & -0.0845 & 0.46646 \tabularnewline
37 & -0.080814 & -0.6857 & 0.247544 \tabularnewline
38 & 0.084703 & 0.7187 & 0.237317 \tabularnewline
39 & 0.02665 & 0.2261 & 0.410868 \tabularnewline
40 & 0.00023 & 0.002 & 0.499223 \tabularnewline
41 & -0.004726 & -0.0401 & 0.484062 \tabularnewline
42 & 0.018971 & 0.161 & 0.436284 \tabularnewline
43 & 0.016804 & 0.1426 & 0.443508 \tabularnewline
44 & -0.078523 & -0.6663 & 0.253679 \tabularnewline
45 & 0.0609 & 0.5168 & 0.303457 \tabularnewline
46 & 0.03132 & 0.2658 & 0.395594 \tabularnewline
47 & -0.045277 & -0.3842 & 0.350986 \tabularnewline
48 & -0.022269 & -0.189 & 0.425329 \tabularnewline
\hline
\end{tabular}
%Source: https://freestatistics.org/blog/index.php?pk=145585&T=2

[TABLE]
[ROW][C]Partial Autocorrelation Function[/C][/ROW]
[ROW][C]Time lag k[/C][C]PACF(k)[/C][C]T-STAT[/C][C]P-value[/C][/ROW]
[ROW][C]1[/C][C]0.224515[/C][C]1.9051[/C][C]0.030382[/C][/ROW]
[ROW][C]2[/C][C]0.038655[/C][C]0.328[/C][C]0.371931[/C][/ROW]
[ROW][C]3[/C][C]0.343101[/C][C]2.9113[/C][C]0.002394[/C][/ROW]
[ROW][C]4[/C][C]-0.036356[/C][C]-0.3085[/C][C]0.379299[/C][/ROW]
[ROW][C]5[/C][C]0.229011[/C][C]1.9432[/C][C]0.027949[/C][/ROW]
[ROW][C]6[/C][C]0.225163[/C][C]1.9106[/C][C]0.030021[/C][/ROW]
[ROW][C]7[/C][C]0.145207[/C][C]1.2321[/C][C]0.110955[/C][/ROW]
[ROW][C]8[/C][C]-0.133327[/C][C]-1.1313[/C][C]0.130837[/C][/ROW]
[ROW][C]9[/C][C]-0.050412[/C][C]-0.4278[/C][C]0.335051[/C][/ROW]
[ROW][C]10[/C][C]-0.10956[/C][C]-0.9296[/C][C]0.177831[/C][/ROW]
[ROW][C]11[/C][C]-0.076803[/C][C]-0.6517[/C][C]0.258337[/C][/ROW]
[ROW][C]12[/C][C]0.067372[/C][C]0.5717[/C][C]0.284662[/C][/ROW]
[ROW][C]13[/C][C]-0.181917[/C][C]-1.5436[/C][C]0.063532[/C][/ROW]
[ROW][C]14[/C][C]-0.040288[/C][C]-0.3419[/C][C]0.366727[/C][/ROW]
[ROW][C]15[/C][C]-0.058446[/C][C]-0.4959[/C][C]0.310727[/C][/ROW]
[ROW][C]16[/C][C]0.069359[/C][C]0.5885[/C][C]0.27901[/C][/ROW]
[ROW][C]17[/C][C]-0.031723[/C][C]-0.2692[/C][C]0.39428[/C][/ROW]
[ROW][C]18[/C][C]-0.008602[/C][C]-0.073[/C][C]0.47101[/C][/ROW]
[ROW][C]19[/C][C]0.064921[/C][C]0.5509[/C][C]0.291714[/C][/ROW]
[ROW][C]20[/C][C]-0.014343[/C][C]-0.1217[/C][C]0.451735[/C][/ROW]
[ROW][C]21[/C][C]-0.051852[/C][C]-0.44[/C][C]0.330634[/C][/ROW]
[ROW][C]22[/C][C]-0.120714[/C][C]-1.0243[/C][C]0.154563[/C][/ROW]
[ROW][C]23[/C][C]0.009607[/C][C]0.0815[/C][C]0.467629[/C][/ROW]
[ROW][C]24[/C][C]0.080274[/C][C]0.6811[/C][C]0.248983[/C][/ROW]
[ROW][C]25[/C][C]0.022609[/C][C]0.1918[/C][C]0.424204[/C][/ROW]
[ROW][C]26[/C][C]-0.098801[/C][C]-0.8384[/C][C]0.202304[/C][/ROW]
[ROW][C]27[/C][C]0.007226[/C][C]0.0613[/C][C]0.475639[/C][/ROW]
[ROW][C]28[/C][C]0.020327[/C][C]0.1725[/C][C]0.431772[/C][/ROW]
[ROW][C]29[/C][C]-0.070127[/C][C]-0.595[/C][C]0.276838[/C][/ROW]
[ROW][C]30[/C][C]-0.058602[/C][C]-0.4973[/C][C]0.310262[/C][/ROW]
[ROW][C]31[/C][C]0.032793[/C][C]0.2783[/C][C]0.390804[/C][/ROW]
[ROW][C]32[/C][C]-0.026053[/C][C]-0.2211[/C][C]0.412832[/C][/ROW]
[ROW][C]33[/C][C]-0.001984[/C][C]-0.0168[/C][C]0.493307[/C][/ROW]
[ROW][C]34[/C][C]-0.052713[/C][C]-0.4473[/C][C]0.328007[/C][/ROW]
[ROW][C]35[/C][C]-0.137364[/C][C]-1.1656[/C][C]0.123818[/C][/ROW]
[ROW][C]36[/C][C]-0.009955[/C][C]-0.0845[/C][C]0.46646[/C][/ROW]
[ROW][C]37[/C][C]-0.080814[/C][C]-0.6857[/C][C]0.247544[/C][/ROW]
[ROW][C]38[/C][C]0.084703[/C][C]0.7187[/C][C]0.237317[/C][/ROW]
[ROW][C]39[/C][C]0.02665[/C][C]0.2261[/C][C]0.410868[/C][/ROW]
[ROW][C]40[/C][C]0.00023[/C][C]0.002[/C][C]0.499223[/C][/ROW]
[ROW][C]41[/C][C]-0.004726[/C][C]-0.0401[/C][C]0.484062[/C][/ROW]
[ROW][C]42[/C][C]0.018971[/C][C]0.161[/C][C]0.436284[/C][/ROW]
[ROW][C]43[/C][C]0.016804[/C][C]0.1426[/C][C]0.443508[/C][/ROW]
[ROW][C]44[/C][C]-0.078523[/C][C]-0.6663[/C][C]0.253679[/C][/ROW]
[ROW][C]45[/C][C]0.0609[/C][C]0.5168[/C][C]0.303457[/C][/ROW]
[ROW][C]46[/C][C]0.03132[/C][C]0.2658[/C][C]0.395594[/C][/ROW]
[ROW][C]47[/C][C]-0.045277[/C][C]-0.3842[/C][C]0.350986[/C][/ROW]
[ROW][C]48[/C][C]-0.022269[/C][C]-0.189[/C][C]0.425329[/C][/ROW]
[/TABLE]
Source: https://freestatistics.org/blog/index.php?pk=145585&T=2

Globally Unique Identifier (entire table): ba.freestatistics.org/blog/index.php?pk=145585&T=2

As an alternative you can also use a QR Code:  

The GUIDs for individual cells are displayed in the table below:

Partial Autocorrelation Function
Time lag kPACF(k)T-STATP-value
10.2245151.90510.030382
20.0386550.3280.371931
30.3431012.91130.002394
4-0.036356-0.30850.379299
50.2290111.94320.027949
60.2251631.91060.030021
70.1452071.23210.110955
8-0.133327-1.13130.130837
9-0.050412-0.42780.335051
10-0.10956-0.92960.177831
11-0.076803-0.65170.258337
120.0673720.57170.284662
13-0.181917-1.54360.063532
14-0.040288-0.34190.366727
15-0.058446-0.49590.310727
160.0693590.58850.27901
17-0.031723-0.26920.39428
18-0.008602-0.0730.47101
190.0649210.55090.291714
20-0.014343-0.12170.451735
21-0.051852-0.440.330634
22-0.120714-1.02430.154563
230.0096070.08150.467629
240.0802740.68110.248983
250.0226090.19180.424204
26-0.098801-0.83840.202304
270.0072260.06130.475639
280.0203270.17250.431772
29-0.070127-0.5950.276838
30-0.058602-0.49730.310262
310.0327930.27830.390804
32-0.026053-0.22110.412832
33-0.001984-0.01680.493307
34-0.052713-0.44730.328007
35-0.137364-1.16560.123818
36-0.009955-0.08450.46646
37-0.080814-0.68570.247544
380.0847030.71870.237317
390.026650.22610.410868
400.000230.0020.499223
41-0.004726-0.04010.484062
420.0189710.1610.436284
430.0168040.14260.443508
44-0.078523-0.66630.253679
450.06090.51680.303457
460.031320.26580.395594
47-0.045277-0.38420.350986
48-0.022269-0.1890.425329


Parameters (Session):
par1 = 48 ; par2 = 1 ; par3 = 0 ; par4 = 0 ; par5 = 12 ; par6 = White Noise ; par7 = 0.95 ;
Parameters (R input):
par1 = 48 ; par2 = 1 ; par3 = 0 ; par4 = 0 ; par5 = 12 ; par6 = White Noise ; par7 = 0.95 ; par8 = ;
R code (references can be found in the software module):
if (par1 == 'Default') {
par1 = 10*log10(length(x))
} else {
par1 <- as.numeric(par1)
}
par2 <- as.numeric(par2)
par3 <- as.numeric(par3)
par4 <- as.numeric(par4)
par5 <- as.numeric(par5)
if (par6 == 'White Noise') par6 <- 'white' else par6 <- 'ma'
par7 <- as.numeric(par7)
if (par8 != '') par8 <- as.numeric(par8)
ox <- x
if (par8 == '') {
if (par2 == 0) {
x <- log(x)
} else {
x <- (x ^ par2 - 1) / par2
}
} else {
x <- log(x,base=par8)
}
if (par3 > 0) x <- diff(x,lag=1,difference=par3)
if (par4 > 0) x <- diff(x,lag=par5,difference=par4)
bitmap(file='picts.png')
op <- par(mfrow=c(2,1))
plot(ox,type='l',main='Original Time Series',xlab='time',ylab='value')
if (par8=='') {
mytitle <- paste('Working Time Series (lambda=',par2,', d=',par3,', D=',par4,')',sep='')
mysub <- paste('(lambda=',par2,', d=',par3,', D=',par4,', CI=', par7, ', CI type=',par6,')',sep='')
} else {
mytitle <- paste('Working Time Series (base=',par8,', d=',par3,', D=',par4,')',sep='')
mysub <- paste('(base=',par8,', d=',par3,', D=',par4,', CI=', par7, ', CI type=',par6,')',sep='')
}
plot(x,type='l', main=mytitle,xlab='time',ylab='value')
par(op)
dev.off()
bitmap(file='pic1.png')
racf <- acf(x, par1, main='Autocorrelation', xlab='time lag', ylab='ACF', ci.type=par6, ci=par7, sub=mysub)
dev.off()
bitmap(file='pic2.png')
rpacf <- pacf(x,par1,main='Partial Autocorrelation',xlab='lags',ylab='PACF',sub=mysub)
dev.off()
(myacf <- c(racf$acf))
(mypacf <- c(rpacf$acf))
lengthx <- length(x)
sqrtn <- sqrt(lengthx)
load(file='createtable')
a<-table.start()
a<-table.row.start(a)
a<-table.element(a,'Autocorrelation Function',4,TRUE)
a<-table.row.end(a)
a<-table.row.start(a)
a<-table.element(a,'Time lag k',header=TRUE)
a<-table.element(a,hyperlink('basics.htm','ACF(k)','click here for more information about the Autocorrelation Function'),header=TRUE)
a<-table.element(a,'T-STAT',header=TRUE)
a<-table.element(a,'P-value',header=TRUE)
a<-table.row.end(a)
for (i in 2:(par1+1)) {
a<-table.row.start(a)
a<-table.element(a,i-1,header=TRUE)
a<-table.element(a,round(myacf[i],6))
mytstat <- myacf[i]*sqrtn
a<-table.element(a,round(mytstat,4))
a<-table.element(a,round(1-pt(abs(mytstat),lengthx),6))
a<-table.row.end(a)
}
a<-table.end(a)
table.save(a,file='mytable.tab')
a<-table.start()
a<-table.row.start(a)
a<-table.element(a,'Partial Autocorrelation Function',4,TRUE)
a<-table.row.end(a)
a<-table.row.start(a)
a<-table.element(a,'Time lag k',header=TRUE)
a<-table.element(a,hyperlink('basics.htm','PACF(k)','click here for more information about the Partial Autocorrelation Function'),header=TRUE)
a<-table.element(a,'T-STAT',header=TRUE)
a<-table.element(a,'P-value',header=TRUE)
a<-table.row.end(a)
for (i in 1:par1) {
a<-table.row.start(a)
a<-table.element(a,i,header=TRUE)
a<-table.element(a,round(mypacf[i],6))
mytstat <- mypacf[i]*sqrtn
a<-table.element(a,round(mytstat,4))
a<-table.element(a,round(1-pt(abs(mytstat),lengthx),6))
a<-table.row.end(a)
}
a<-table.end(a)
table.save(a,file='mytable1.tab')