Free Statistics

of Irreproducible Research!

Author's title

Author*The author of this computation has been verified*
R Software Modulerwasp_edauni.wasp
Title produced by softwareUnivariate Explorative Data Analysis
Date of computationSun, 20 Nov 2011 08:07:42 -0500
Cite this page as followsStatistical Computations at FreeStatistics.org, Office for Research Development and Education, URL https://freestatistics.org/blog/index.php?v=date/2011/Nov/20/t1321794487f9nzaj3lxmiswep.htm/, Retrieved Tue, 23 Apr 2024 17:48:18 +0000
Statistical Computations at FreeStatistics.org, Office for Research Development and Education, URL https://freestatistics.org/blog/index.php?pk=145582, Retrieved Tue, 23 Apr 2024 17:48:18 +0000
QR Codes:

Original text written by user:
IsPrivate?No (this computation is public)
User-defined keywords
Estimated Impact139
Family? (F = Feedback message, R = changed R code, M = changed R Module, P = changed Parameters, D = changed Data)
-       [Univariate Explorative Data Analysis] [Run Sequence Plot] [2011-11-20 13:07:42] [2a6d487209befbc7c5ce02a41ecac161] [Current]
- R  D    [Univariate Explorative Data Analysis] [WS7 Run Sequence ...] [2011-11-21 17:42:38] [9d4f280afcb4ecc352d7c6f913a0a151]
Feedback Forum

Post a new message
Dataseries X:
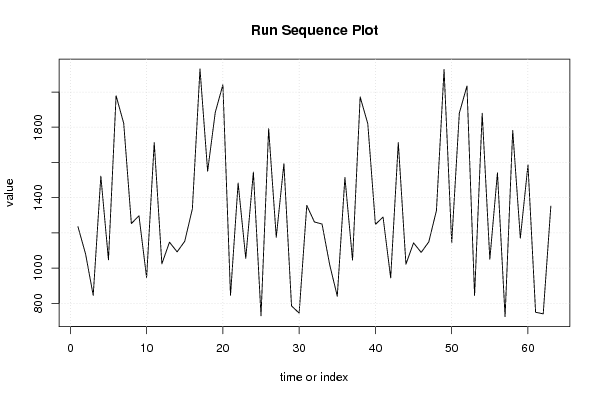
1235
1080
845
1522
1047
1979
1822
1253
1297
946
1713
1024
1147
1092
1152
1336
2131
1550
1884
2041
845
1483
1055
1545
729
1792
1175
1593
785
744
1356
1262
1250
1020
840
1515
1045
1972
1820
1248
1290
944
1713
1022
1143
1089
1149
1327
2128
1143
1880
2034
844
1879
1050
1541
724
1782
1170
1586
749
740
1352


Summary of computational transaction
Raw Inputview raw input (R code)
Raw Outputview raw output of R engine
Computing time2 seconds
R Server'Gwilym Jenkins' @ jenkins.wessa.net

\begin{tabular}{lllllllll}
\hline
Summary of computational transaction \tabularnewline
Raw Input & view raw input (R code)  \tabularnewline
Raw Output & view raw output of R engine  \tabularnewline
Computing time & 2 seconds \tabularnewline
R Server & 'Gwilym Jenkins' @ jenkins.wessa.net \tabularnewline
\hline
\end{tabular}
%Source: https://freestatistics.org/blog/index.php?pk=145582&T=0

[TABLE]
[ROW][C]Summary of computational transaction[/C][/ROW]
[ROW][C]Raw Input[/C][C]view raw input (R code) [/C][/ROW]
[ROW][C]Raw Output[/C][C]view raw output of R engine [/C][/ROW]
[ROW][C]Computing time[/C][C]2 seconds[/C][/ROW]
[ROW][C]R Server[/C][C]'Gwilym Jenkins' @ jenkins.wessa.net[/C][/ROW]
[/TABLE]
Source: https://freestatistics.org/blog/index.php?pk=145582&T=0

Globally Unique Identifier (entire table): ba.freestatistics.org/blog/index.php?pk=145582&T=0

As an alternative you can also use a QR Code:  

The GUIDs for individual cells are displayed in the table below:

Summary of computational transaction
Raw Inputview raw input (R code)
Raw Outputview raw output of R engine
Computing time2 seconds
R Server'Gwilym Jenkins' @ jenkins.wessa.net


Descriptive Statistics
# observations63
minimum724
Q11046
median1250
mean1324.5873015873
Q31589.5
maximum2131

\begin{tabular}{lllllllll}
\hline
Descriptive Statistics \tabularnewline
# observations & 63 \tabularnewline
minimum & 724 \tabularnewline
Q1 & 1046 \tabularnewline
median & 1250 \tabularnewline
mean & 1324.5873015873 \tabularnewline
Q3 & 1589.5 \tabularnewline
maximum & 2131 \tabularnewline
\hline
\end{tabular}
%Source: https://freestatistics.org/blog/index.php?pk=145582&T=1

[TABLE]
[ROW][C]Descriptive Statistics[/C][/ROW]
[ROW][C]# observations[/C][C]63[/C][/ROW]
[ROW][C]minimum[/C][C]724[/C][/ROW]
[ROW][C]Q1[/C][C]1046[/C][/ROW]
[ROW][C]median[/C][C]1250[/C][/ROW]
[ROW][C]mean[/C][C]1324.5873015873[/C][/ROW]
[ROW][C]Q3[/C][C]1589.5[/C][/ROW]
[ROW][C]maximum[/C][C]2131[/C][/ROW]
[/TABLE]
Source: https://freestatistics.org/blog/index.php?pk=145582&T=1

Globally Unique Identifier (entire table): ba.freestatistics.org/blog/index.php?pk=145582&T=1

As an alternative you can also use a QR Code:  

The GUIDs for individual cells are displayed in the table below:

Descriptive Statistics
# observations63
minimum724
Q11046
median1250
mean1324.5873015873
Q31589.5
maximum2131


Parameters (Session):
par1 = 0 ; par2 = 0 ;
Parameters (R input):
par1 = 0 ; par2 = 0 ;
R code (references can be found in the software module):
par1 <- as.numeric(par1)
par2 <- as.numeric(par2)
x <- as.ts(x)
library(lattice)
bitmap(file='pic1.png')
plot(x,type='l',main='Run Sequence Plot',xlab='time or index',ylab='value')
grid()
dev.off()
bitmap(file='pic2.png')
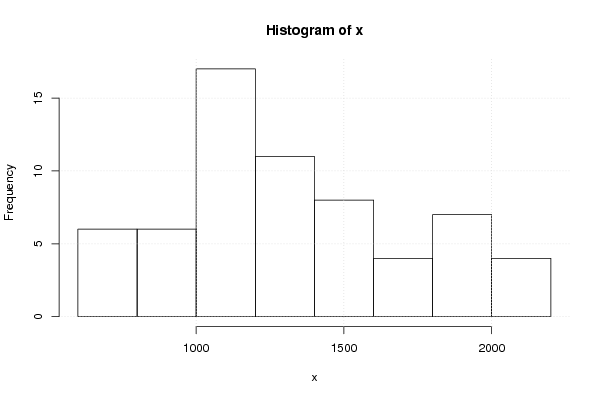
hist(x)
grid()
dev.off()
bitmap(file='pic3.png')
if (par1 > 0)
{
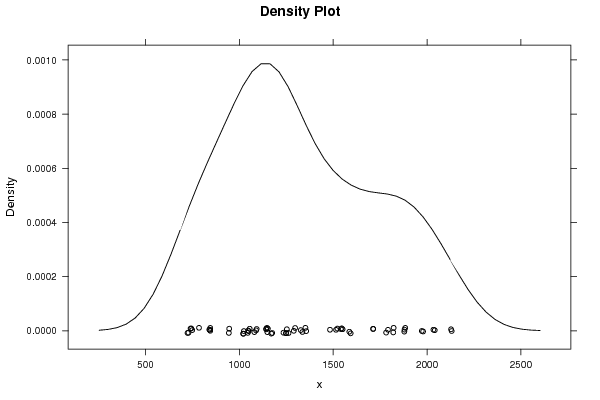
densityplot(~x,col='black',main=paste('Density Plot bw = ',par1),bw=par1)
} else {
densityplot(~x,col='black',main='Density Plot')
}
dev.off()
bitmap(file='pic4.png')
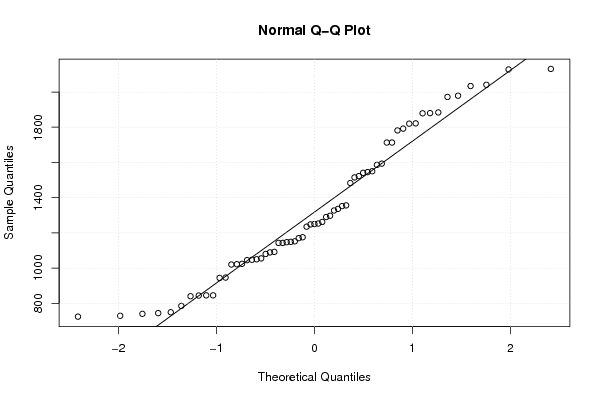
qqnorm(x)
qqline(x)
grid()
dev.off()
if (par2 > 0)
{
bitmap(file='lagplot1.png')
dum <- cbind(lag(x,k=1),x)
dum
dum1 <- dum[2:length(x),]
dum1
z <- as.data.frame(dum1)
z
plot(z,main='Lag plot (k=1), lowess, and regression line')
lines(lowess(z))
abline(lm(z))
dev.off()
if (par2 > 1) {
bitmap(file='lagplotpar2.png')
dum <- cbind(lag(x,k=par2),x)
dum
dum1 <- dum[(par2+1):length(x),]
dum1
z <- as.data.frame(dum1)
z
mylagtitle <- 'Lag plot (k='
mylagtitle <- paste(mylagtitle,par2,sep='')
mylagtitle <- paste(mylagtitle,'), and lowess',sep='')
plot(z,main=mylagtitle)
lines(lowess(z))
dev.off()
}
bitmap(file='pic5.png')
acf(x,lag.max=par2,main='Autocorrelation Function')
grid()
dev.off()
}
summary(x)
load(file='createtable')
a<-table.start()
a<-table.row.start(a)
a<-table.element(a,'Descriptive Statistics',2,TRUE)
a<-table.row.end(a)
a<-table.row.start(a)
a<-table.element(a,'# observations',header=TRUE)
a<-table.element(a,length(x))
a<-table.row.end(a)
a<-table.row.start(a)
a<-table.element(a,'minimum',header=TRUE)
a<-table.element(a,min(x))
a<-table.row.end(a)
a<-table.row.start(a)
a<-table.element(a,'Q1',header=TRUE)
a<-table.element(a,quantile(x,0.25))
a<-table.row.end(a)
a<-table.row.start(a)
a<-table.element(a,'median',header=TRUE)
a<-table.element(a,median(x))
a<-table.row.end(a)
a<-table.row.start(a)
a<-table.element(a,'mean',header=TRUE)
a<-table.element(a,mean(x))
a<-table.row.end(a)
a<-table.row.start(a)
a<-table.element(a,'Q3',header=TRUE)
a<-table.element(a,quantile(x,0.75))
a<-table.row.end(a)
a<-table.row.start(a)
a<-table.element(a,'maximum',header=TRUE)
a<-table.element(a,max(x))
a<-table.row.end(a)
a<-table.end(a)
table.save(a,file='mytable.tab')