| Multiple Linear Regression - Estimated Regression Equation |
| CPI[t] = + 120.715729044527 -0.0183168010413199werkloosheid[t] + 1.73678652759287OLO[t] -1.46771793225502e-05voertuigen[t] + 0.000556194353034178bouw[t] -0.242424622406475t + e[t] |
| Multiple Linear Regression - Ordinary Least Squares | |||||
| Variable | Parameter | S.D. | T-STAT H0: parameter = 0 | 2-tail p-value | 1-tail p-value |
| (Intercept) | 120.715729044527 | 3.695428 | 32.6662 | 0 | 0 |
| werkloosheid | -0.0183168010413199 | 0.004469 | -4.0986 | 0.000141 | 7e-05 |
| OLO | 1.73678652759287 | 0.347348 | 5.0001 | 6e-06 | 3e-06 |
| voertuigen | -1.46771793225502e-05 | 1.8e-05 | -0.8218 | 0.414793 | 0.207396 |
| bouw | 0.000556194353034178 | 0.00019 | 2.9319 | 0.004933 | 0.002466 |
| t | -0.242424622406475 | 0.007129 | -34.0042 | 0 | 0 |
| Multiple Linear Regression - Regression Statistics | |
| Multiple R | 0.982997641801115 |
| R-squared | 0.966284363786554 |
| Adjusted R-squared | 0.963162545618642 |
| F-TEST (value) | 309.526151689017 |
| F-TEST (DF numerator) | 5 |
| F-TEST (DF denominator) | 54 |
| p-value | 0 |
| Multiple Linear Regression - Residual Statistics | |
| Residual Standard Deviation | 0.720937718220644 |
| Sum Squared Residuals | 28.0665644518722 |
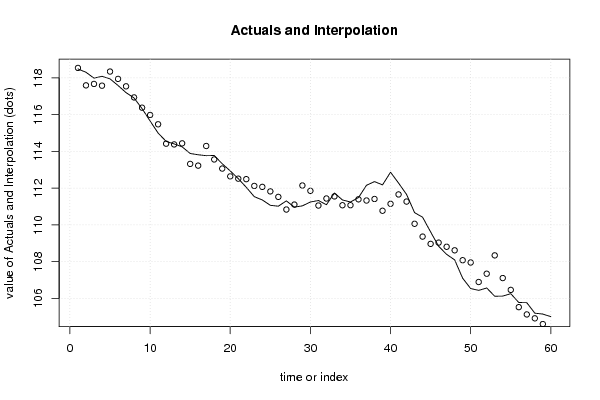
| Multiple Linear Regression - Actuals, Interpolation, and Residuals | |||
| Time or Index | Actuals | Interpolation Forecast | Residuals Prediction Error |
| 1 | 118.49 | 118.544997118334 | -0.0549971183338475 |
| 2 | 118.31 | 117.59780351603 | 0.712196483969612 |
| 3 | 117.99 | 117.673175655351 | 0.316824344648547 |
| 4 | 118.09 | 117.578949984092 | 0.511050015907531 |
| 5 | 117.95 | 118.349111848951 | -0.399111848950879 |
| 6 | 117.59 | 117.947388838386 | -0.357388838385842 |
| 7 | 117.2 | 117.545424493103 | -0.345424493103347 |
| 8 | 116.91 | 116.941134541574 | -0.0311345415739557 |
| 9 | 116.33 | 116.381355747236 | -0.0513557472358141 |
| 10 | 115.66 | 115.98491085629 | -0.324910856289723 |
| 11 | 115 | 115.479391280356 | -0.479391280356074 |
| 12 | 114.55 | 114.422349739615 | 0.127650260385402 |
| 13 | 114.41 | 114.383158857245 | 0.0268411427549747 |
| 14 | 114.25 | 114.441651619581 | -0.191651619581289 |
| 15 | 113.89 | 113.321514257711 | 0.568485742289237 |
| 16 | 113.82 | 113.228594161978 | 0.591405838022136 |
| 17 | 113.77 | 114.296667275522 | -0.526667275522104 |
| 18 | 113.78 | 113.56488703981 | 0.215112960189719 |
| 19 | 113.33 | 113.068527385161 | 0.261472614838541 |
| 20 | 112.94 | 112.644819157694 | 0.295180842306112 |
| 21 | 112.52 | 112.518226927855 | 0.00177307214466899 |
| 22 | 112.05 | 112.492830580702 | -0.442830580702024 |
| 23 | 111.54 | 112.123678644399 | -0.58367864439949 |
| 24 | 111.36 | 112.071977629196 | -0.711977629196281 |
| 25 | 111.07 | 111.827451504599 | -0.757451504599174 |
| 26 | 111.02 | 111.527561030015 | -0.507561030015024 |
| 27 | 111.31 | 110.840233351903 | 0.469766648096747 |
| 28 | 110.97 | 111.108637772963 | -0.138637772963407 |
| 29 | 111.04 | 112.147473799728 | -1.10747379972773 |
| 30 | 111.25 | 111.856850383765 | -0.606850383765333 |
| 31 | 111.33 | 111.057539420503 | 0.272460579497142 |
| 32 | 111.1 | 111.439838229083 | -0.339838229082843 |
| 33 | 111.74 | 111.553422832528 | 0.18657716747227 |
| 34 | 111.36 | 111.072593173403 | 0.287406826597381 |
| 35 | 111.25 | 111.074399035996 | 0.17560096400378 |
| 36 | 111.49 | 111.395766545349 | 0.0942334546511449 |
| 37 | 112.16 | 111.329933891546 | 0.830066108454487 |
| 38 | 112.36 | 111.413883229511 | 0.946116770488974 |
| 39 | 112.18 | 110.772445732989 | 1.40755426701094 |
| 40 | 112.87 | 111.150705229109 | 1.71929477089095 |
| 41 | 112.28 | 111.659941797164 | 0.620058202835904 |
| 42 | 111.66 | 111.27321317412 | 0.386786825880379 |
| 43 | 110.67 | 110.064162334521 | 0.605837665479025 |
| 44 | 110.42 | 109.365975079617 | 1.05402492038319 |
| 45 | 109.62 | 108.971479481819 | 0.648520518180521 |
| 46 | 108.84 | 109.037556814638 | -0.197556814637937 |
| 47 | 108.4 | 108.81307577478 | -0.413075774779924 |
| 48 | 108.1 | 108.620743475587 | -0.520743475587133 |
| 49 | 107.1 | 108.081520766693 | -0.981520766693157 |
| 50 | 106.54 | 107.957108749079 | -1.41710874907924 |
| 51 | 106.44 | 106.895686390674 | -0.455686390673662 |
| 52 | 106.57 | 107.34558138028 | -0.775581380279731 |
| 53 | 106.12 | 108.344706428437 | -2.22470642843711 |
| 54 | 106.13 | 107.110540211265 | -0.980540211264604 |
| 55 | 106.26 | 106.465581279072 | -0.205581279072 |
| 56 | 105.78 | 105.526912772284 | 0.253087227715851 |
| 57 | 105.77 | 105.130758993791 | 0.639241006208697 |
| 58 | 105.2 | 104.919484180476 | 0.280515819523799 |
| 59 | 105.15 | 104.607777643538 | 0.542222356462331 |
| 60 | 105.01 | 103.926930953001 | 1.08306904699868 |
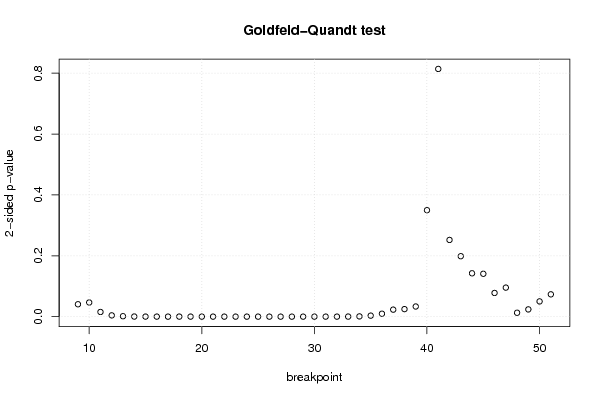
| Goldfeld-Quandt test for Heteroskedasticity | |||
| p-values | Alternative Hypothesis | ||
| breakpoint index | greater | 2-sided | less |
| 9 | 0.020377811817205 | 0.04075562363441 | 0.979622188182795 |
| 10 | 0.0232600497694009 | 0.0465200995388019 | 0.976739950230599 |
| 11 | 0.00767610978712109 | 0.0153522195742422 | 0.992323890212879 |
| 12 | 0.00210121835787056 | 0.00420243671574111 | 0.997898781642129 |
| 13 | 0.000704349748350631 | 0.00140869949670126 | 0.999295650251649 |
| 14 | 0.0001826491349568 | 0.0003652982699136 | 0.999817350865043 |
| 15 | 7.44895307990798e-05 | 0.00014897906159816 | 0.999925510469201 |
| 16 | 5.39745664486264e-05 | 0.000107949132897253 | 0.999946025433551 |
| 17 | 1.31239220730536e-05 | 2.62478441461071e-05 | 0.999986876077927 |
| 18 | 9.12419908935925e-05 | 0.000182483981787185 | 0.999908758009106 |
| 19 | 4.18618006211015e-05 | 8.37236012422029e-05 | 0.999958138199379 |
| 20 | 1.28583614604563e-05 | 2.57167229209127e-05 | 0.99998714163854 |
| 21 | 3.72266087168575e-06 | 7.4453217433715e-06 | 0.999996277339128 |
| 22 | 1.63921835932119e-06 | 3.27843671864238e-06 | 0.999998360781641 |
| 23 | 4.71271763769779e-07 | 9.42543527539558e-07 | 0.999999528728236 |
| 24 | 1.42140167013623e-07 | 2.84280334027247e-07 | 0.999999857859833 |
| 25 | 4.85124241308663e-08 | 9.70248482617326e-08 | 0.999999951487576 |
| 26 | 1.68112131400347e-08 | 3.36224262800695e-08 | 0.999999983188787 |
| 27 | 4.06000855584675e-07 | 8.12001711169351e-07 | 0.999999593999144 |
| 28 | 2.23225928934933e-07 | 4.46451857869866e-07 | 0.999999776774071 |
| 29 | 2.07188094521039e-07 | 4.14376189042078e-07 | 0.999999792811905 |
| 30 | 1.24528226356765e-06 | 2.49056452713531e-06 | 0.999998754717736 |
| 31 | 1.6115767091749e-05 | 3.22315341834981e-05 | 0.999983884232908 |
| 32 | 2.22602361036178e-05 | 4.45204722072357e-05 | 0.999977739763896 |
| 33 | 0.00011098179693004 | 0.000221963593860081 | 0.99988901820307 |
| 34 | 0.000423157561080023 | 0.000846315122160046 | 0.99957684243892 |
| 35 | 0.00164966403538636 | 0.00329932807077273 | 0.998350335964614 |
| 36 | 0.00478806178091741 | 0.00957612356183483 | 0.995211938219083 |
| 37 | 0.0115054018509828 | 0.0230108037019656 | 0.988494598149017 |
| 38 | 0.0123823736668033 | 0.0247647473336066 | 0.987617626333197 |
| 39 | 0.0166666180954223 | 0.0333332361908445 | 0.983333381904578 |
| 40 | 0.174929883913588 | 0.349859767827177 | 0.825070116086412 |
| 41 | 0.593044847472982 | 0.813910305054035 | 0.406955152527018 |
| 42 | 0.873973568266505 | 0.252052863466991 | 0.126026431733495 |
| 43 | 0.900721355450555 | 0.19855728909889 | 0.0992786445494452 |
| 44 | 0.928746390148303 | 0.142507219703393 | 0.0712536098516966 |
| 45 | 0.929544170049432 | 0.140911659901135 | 0.0704558299505676 |
| 46 | 0.961093164016533 | 0.0778136719669348 | 0.0389068359834674 |
| 47 | 0.952294454490434 | 0.0954110910191312 | 0.0477055455095656 |
| 48 | 0.993600279645214 | 0.0127994407095715 | 0.00639972035478575 |
| 49 | 0.988082414998902 | 0.023835170002195 | 0.0119175850010975 |
| 50 | 0.974940431075061 | 0.0501191378498789 | 0.0250595689249395 |
| 51 | 0.963330560182791 | 0.0733388796344191 | 0.0366694398172095 |
| Meta Analysis of Goldfeld-Quandt test for Heteroskedasticity | |||
| Description | # significant tests | % significant tests | OK/NOK |
| 1% type I error level | 25 | 0.581395348837209 | NOK |
| 5% type I error level | 33 | 0.767441860465116 | NOK |
| 10% type I error level | 37 | 0.86046511627907 | NOK |