| Multiple Linear Regression - Estimated Regression Equation |
| IQ[t] = + 110.68161354328 -0.159876234037035CCMIDSA[t] + 0.26620284542461HC[t] -0.00799345650041682TOTSA[t] -0.00514432165962346TOTVOL[t] + 1.03139108721264SEX[t] + 0.0322829490152807t + e[t] |
| Multiple Linear Regression - Ordinary Least Squares | |||||
| Variable | Parameter | S.D. | T-STAT H0: parameter = 0 | 2-tail p-value | 1-tail p-value |
| (Intercept) | 110.68161354328 | 77.822491 | 1.4222 | 0.160818 | 0.080409 |
| CCMIDSA | -0.159876234037035 | 2.632704 | -0.0607 | 0.951805 | 0.475903 |
| HC | 0.26620284542461 | 1.293318 | 0.2058 | 0.837713 | 0.418856 |
| TOTSA | -0.00799345650041682 | 0.014089 | -0.5674 | 0.572868 | 0.286434 |
| TOTVOL | -0.00514432165962346 | 0.01915 | -0.2686 | 0.789257 | 0.394629 |
| SEX | 1.03139108721264 | 5.018969 | 0.2055 | 0.83797 | 0.418985 |
| t | 0.0322829490152807 | 0.152684 | 0.2114 | 0.833358 | 0.416679 |
| Multiple Linear Regression - Regression Statistics | |
| Multiple R | 0.111378765389133 |
| R-squared | 0.0124052293796076 |
| Adjusted R-squared | -0.0993979522000594 |
| F-TEST (value) | 0.110955960325405 |
| F-TEST (DF numerator) | 6 |
| F-TEST (DF denominator) | 53 |
| p-value | 0.994783508671974 |
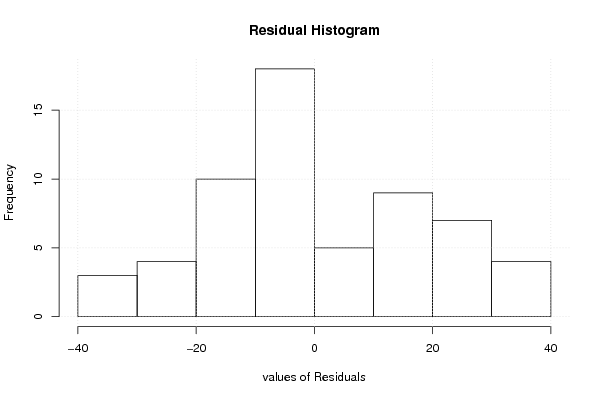
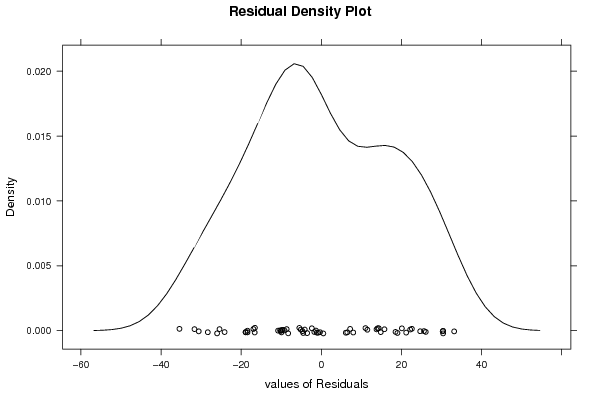
| Multiple Linear Regression - Residual Statistics | |
| Residual Standard Deviation | 18.9356545863579 |
| Sum Squared Residuals | 19003.6277745345 |
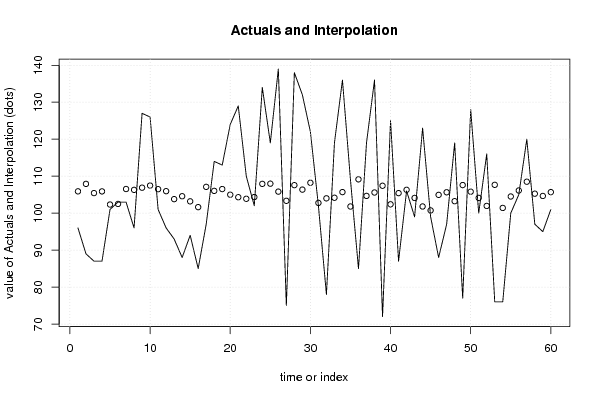
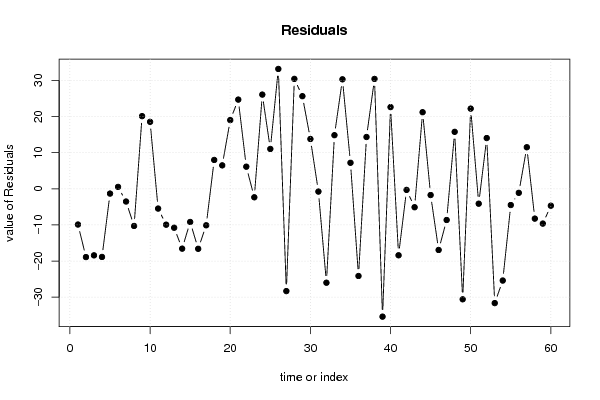
| Multiple Linear Regression - Actuals, Interpolation, and Residuals | |||
| Time or Index | Actuals | Interpolation Forecast | Residuals Prediction Error |
| 1 | 96 | 105.896407798782 | -9.89640779878223 |
| 2 | 89 | 107.906102511798 | -18.9061025117985 |
| 3 | 87 | 105.427638015042 | -18.4276380150423 |
| 4 | 87 | 105.877328444105 | -18.8773284441052 |
| 5 | 101 | 102.327862255447 | -1.32786225544718 |
| 6 | 103 | 102.481800669901 | 0.518199330098991 |
| 7 | 103 | 106.525506336568 | -3.52550633656788 |
| 8 | 96 | 106.291505624491 | -10.2915056244906 |
| 9 | 127 | 106.882492078053 | 20.1175079219473 |
| 10 | 126 | 107.461895617259 | 18.5381043827406 |
| 11 | 101 | 106.48227138205 | -5.48227138205047 |
| 12 | 96 | 105.939781456313 | -9.93978145631307 |
| 13 | 93 | 103.786053631157 | -10.7860536311566 |
| 14 | 88 | 104.571224545815 | -16.571224545815 |
| 15 | 94 | 103.191771506402 | -9.19177150640164 |
| 16 | 85 | 101.617493499567 | -16.6174934995669 |
| 17 | 97 | 107.106619206808 | -10.106619206808 |
| 18 | 114 | 106.018175245107 | 7.98182475489295 |
| 19 | 113 | 106.517158177536 | 6.482841822464 |
| 20 | 124 | 104.982763465589 | 19.0172365344106 |
| 21 | 129 | 104.303128579573 | 24.6968714204271 |
| 22 | 110 | 103.881346457971 | 6.11865354202893 |
| 23 | 102 | 104.35179418553 | -2.35179418553026 |
| 24 | 134 | 107.917456888368 | 26.0825431116324 |
| 25 | 119 | 107.967162864282 | 11.0328371357178 |
| 26 | 139 | 105.818111349942 | 33.1818886500576 |
| 27 | 75 | 103.329260668178 | -28.3292606681778 |
| 28 | 138 | 107.570094810847 | 30.429905189153 |
| 29 | 132 | 106.362341475121 | 25.637658524879 |
| 30 | 122 | 108.212344678822 | 13.7876553211776 |
| 31 | 102 | 102.768280614692 | -0.768280614692435 |
| 32 | 78 | 104.007573218221 | -26.0075732182209 |
| 33 | 119 | 104.159108575467 | 14.8408914245333 |
| 34 | 136 | 105.690681952476 | 30.3093180475244 |
| 35 | 109 | 101.798094179316 | 7.20190582068445 |
| 36 | 85 | 109.142894131076 | -24.1428941310761 |
| 37 | 119 | 104.66472638471 | 14.3352736152896 |
| 38 | 136 | 105.580730610339 | 30.4192693896607 |
| 39 | 72 | 107.404081382124 | -35.4040813821243 |
| 40 | 125 | 102.385853550389 | 22.6141464496105 |
| 41 | 87 | 105.412072387272 | -18.4120723872722 |
| 42 | 106 | 106.307471252848 | -0.307471252848094 |
| 43 | 99 | 104.108672663392 | -5.10867266339229 |
| 44 | 123 | 101.797218642133 | 21.2027813578671 |
| 45 | 99 | 100.730078712531 | -1.73007871253088 |
| 46 | 88 | 104.943574985675 | -16.9435749856755 |
| 47 | 97 | 105.643238130832 | -8.64323813083161 |
| 48 | 119 | 103.230848737527 | 15.7691512624734 |
| 49 | 77 | 107.591615614654 | -30.5916156146542 |
| 50 | 128 | 105.804033583981 | 22.1959664160186 |
| 51 | 100 | 104.124916581197 | -4.12491658119705 |
| 52 | 116 | 101.948124563394 | 14.0518754366064 |
| 53 | 76 | 107.654477942721 | -31.6544779427211 |
| 54 | 76 | 101.403795320784 | -25.4037953207835 |
| 55 | 100 | 104.497934466526 | -4.4979344665259 |
| 56 | 105 | 106.12077583079 | -1.12077583078963 |
| 57 | 120 | 108.495578033923 | 11.5044219660767 |
| 58 | 97 | 105.258013346665 | -8.25801334666532 |
| 59 | 95 | 104.638874747636 | -9.63887474763631 |
| 60 | 101 | 105.681766430282 | -4.68176643028194 |
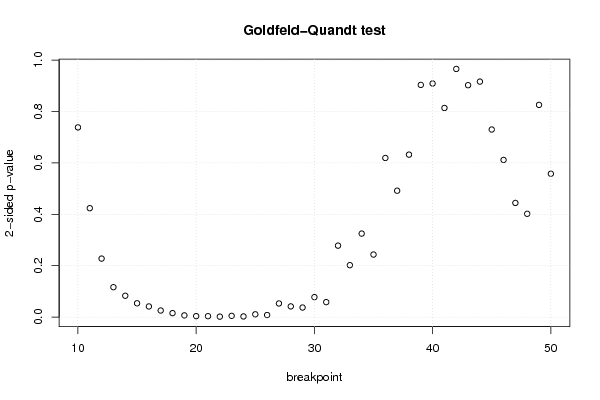
| Goldfeld-Quandt test for Heteroskedasticity | |||
| p-values | Alternative Hypothesis | ||
| breakpoint index | greater | 2-sided | less |
| 10 | 0.369044181301057 | 0.738088362602113 | 0.630955818698943 |
| 11 | 0.211918811838117 | 0.423837623676235 | 0.788081188161883 |
| 12 | 0.113867784947378 | 0.227735569894756 | 0.886132215052622 |
| 13 | 0.0582647096005505 | 0.116529419201101 | 0.941735290399449 |
| 14 | 0.0416240206042244 | 0.0832480412084487 | 0.958375979395776 |
| 15 | 0.0269604157706055 | 0.0539208315412109 | 0.973039584229395 |
| 16 | 0.0208158472629873 | 0.0416316945259746 | 0.979184152737013 |
| 17 | 0.0129413364559234 | 0.0258826729118469 | 0.987058663544077 |
| 18 | 0.00780054073215199 | 0.015601081464304 | 0.992199459267848 |
| 19 | 0.00346926961827264 | 0.00693853923654527 | 0.996530730381727 |
| 20 | 0.00197830189974977 | 0.00395660379949953 | 0.99802169810025 |
| 21 | 0.0018852188396586 | 0.00377043767931719 | 0.998114781160341 |
| 22 | 0.000976250342435736 | 0.00195250068487147 | 0.999023749657564 |
| 23 | 0.00253756226511636 | 0.00507512453023272 | 0.997462437734884 |
| 24 | 0.00139285014033724 | 0.00278570028067448 | 0.998607149859663 |
| 25 | 0.00553670669997827 | 0.0110734133999565 | 0.994463293300022 |
| 26 | 0.00412166494537754 | 0.00824332989075509 | 0.995878335054622 |
| 27 | 0.026640700007842 | 0.053281400015684 | 0.973359299992158 |
| 28 | 0.0209059644305516 | 0.0418119288611032 | 0.979094035569448 |
| 29 | 0.0187166681337973 | 0.0374333362675947 | 0.981283331866203 |
| 30 | 0.0389397786508904 | 0.0778795573017808 | 0.96106022134911 |
| 31 | 0.0292315616675025 | 0.0584631233350051 | 0.970768438332497 |
| 32 | 0.139056126119499 | 0.278112252238997 | 0.860943873880501 |
| 33 | 0.101119601877422 | 0.202239203754843 | 0.898880398122578 |
| 34 | 0.16253687710809 | 0.325073754216181 | 0.83746312289191 |
| 35 | 0.121763568083677 | 0.243527136167354 | 0.878236431916323 |
| 36 | 0.30955893694364 | 0.619117873887281 | 0.69044106305636 |
| 37 | 0.245877020982639 | 0.491754041965278 | 0.754122979017361 |
| 38 | 0.316068176243357 | 0.632136352486714 | 0.683931823756643 |
| 39 | 0.54835101991242 | 0.903297960175161 | 0.45164898008758 |
| 40 | 0.545612536679094 | 0.908774926641811 | 0.454387463320906 |
| 41 | 0.593187024733485 | 0.81362595053303 | 0.406812975266515 |
| 42 | 0.517284601820956 | 0.965430796358087 | 0.482715398179044 |
| 43 | 0.451133527719473 | 0.902267055438946 | 0.548866472280527 |
| 44 | 0.458111338803145 | 0.91622267760629 | 0.541888661196855 |
| 45 | 0.364908847271335 | 0.72981769454267 | 0.635091152728665 |
| 46 | 0.305724551017396 | 0.611449102034791 | 0.694275448982604 |
| 47 | 0.222161349241316 | 0.444322698482631 | 0.777838650758684 |
| 48 | 0.201041706724954 | 0.402083413449907 | 0.798958293275046 |
| 49 | 0.412800464378703 | 0.825600928757406 | 0.587199535621297 |
| 50 | 0.278942298001586 | 0.557884596003171 | 0.721057701998414 |
| Meta Analysis of Goldfeld-Quandt test for Heteroskedasticity | |||
| Description | # significant tests | % significant tests | OK/NOK |
| 1% type I error level | 7 | 0.170731707317073 | NOK |
| 5% type I error level | 13 | 0.317073170731707 | NOK |
| 10% type I error level | 18 | 0.439024390243902 | NOK |