| Multiple Linear Regression - Estimated Regression Equation |
| Werkloosheidsuitkering[t] = + 469.319331978511 + 0.279108723904313Loon[t] -2.89442767181673Duur[t] + 43.242002998637Gezinslast[t] -1.1733323699496t + e[t] |
| Multiple Linear Regression - Ordinary Least Squares | |||||
| Variable | Parameter | S.D. | T-STAT H0: parameter = 0 | 2-tail p-value | 1-tail p-value |
| (Intercept) | 469.319331978511 | 106.946568 | 4.3884 | 5.2e-05 | 2.6e-05 |
| Loon | 0.279108723904313 | 0.049543 | 5.6337 | 1e-06 | 0 |
| Duur | -2.89442767181673 | 1.103174 | -2.6237 | 0.011234 | 0.005617 |
| Gezinslast | 43.242002998637 | 23.677191 | 1.8263 | 0.073232 | 0.036616 |
| t | -1.1733323699496 | 1.08499 | -1.0814 | 0.284228 | 0.142114 |
| Multiple Linear Regression - Regression Statistics | |
| Multiple R | 0.664111388814153 |
| R-squared | 0.441043936752663 |
| Adjusted R-squared | 0.400392586698312 |
| F-TEST (value) | 10.8494290143618 |
| F-TEST (DF numerator) | 4 |
| F-TEST (DF denominator) | 55 |
| p-value | 1.48288667967122e-06 |
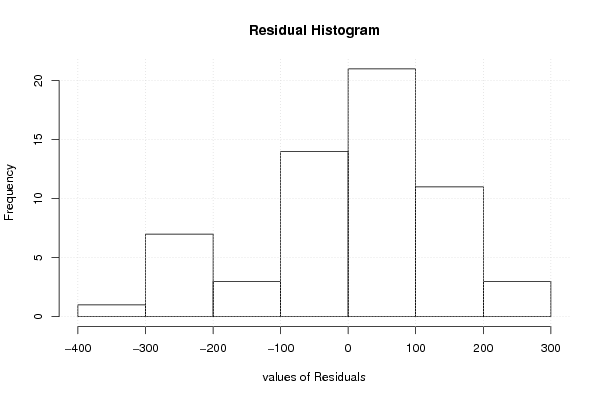
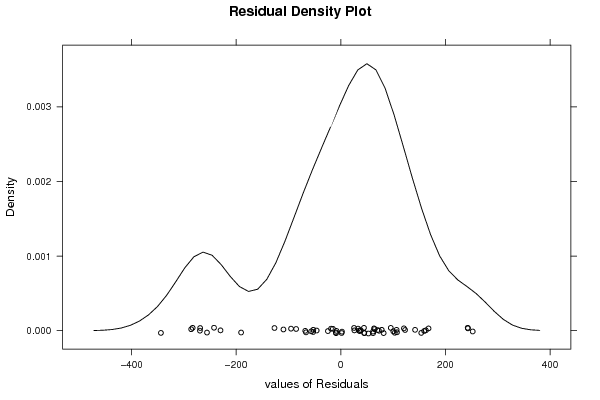
| Multiple Linear Regression - Residual Statistics | |
| Residual Standard Deviation | 144.368254627371 |
| Sum Squared Residuals | 1146320.61192843 |
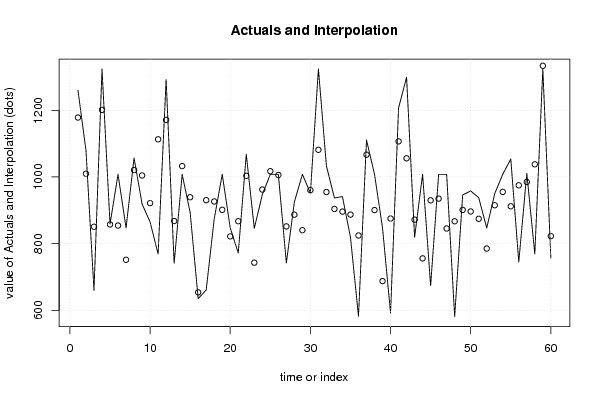
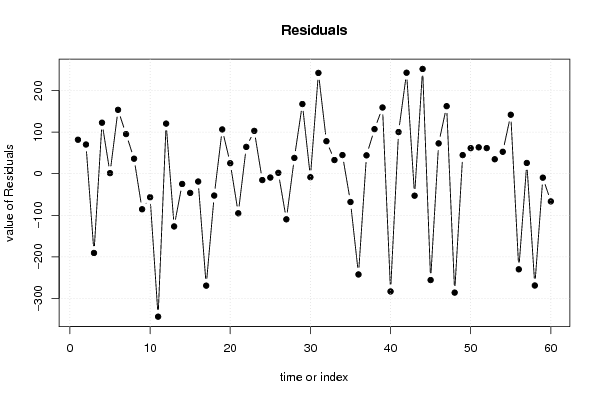
| Multiple Linear Regression - Actuals, Interpolation, and Residuals | |||
| Time or Index | Actuals | Interpolation Forecast | Residuals Prediction Error |
| 1 | 1260 | 1178.21147345989 | 81.7885265401065 |
| 2 | 1080 | 1009.71594559319 | 70.2840544068058 |
| 3 | 660 | 850.724785686315 | -190.724785686315 |
| 4 | 1324 | 1201.22665432749 | 122.773345672513 |
| 5 | 859 | 857.545837338801 | 1.45416266119947 |
| 6 | 1008 | 854.26510234616 | 153.73489765384 |
| 7 | 847 | 751.534997333948 | 95.4650026660522 |
| 8 | 1057 | 1020.83968450469 | 36.1603154953137 |
| 9 | 919 | 1004.50220397902 | -85.5022039790152 |
| 10 | 865 | 921.600316627689 | -56.6003166276891 |
| 11 | 769 | 1112.97184468029 | -343.971844680291 |
| 12 | 1292 | 1171.41429674193 | 120.585703258072 |
| 13 | 741 | 867.882725157365 | -126.882725157365 |
| 14 | 1008 | 1032.68680644559 | -24.6868064455934 |
| 15 | 893 | 939.20970016032 | -46.2097001603199 |
| 16 | 635 | 653.771685615262 | -18.7716856152624 |
| 17 | 661 | 930.372463124781 | -269.372463124781 |
| 18 | 874 | 926.593518962287 | -52.5935189622874 |
| 19 | 1008 | 901.469414988392 | 106.530585011608 |
| 20 | 847 | 821.730461323263 | 25.2695386767366 |
| 21 | 772 | 867.22086449716 | -95.2208644971596 |
| 22 | 1068 | 1003.47372093342 | 64.5262790665779 |
| 23 | 846 | 742.894415151502 | 103.105584848498 |
| 24 | 947 | 962.288072074366 | -15.2880720743661 |
| 25 | 1008 | 1017.19574400265 | -9.19574400265189 |
| 26 | 1008 | 1005.87115713937 | 2.12884286062656 |
| 27 | 742 | 851.735180701976 | -109.735180701975 |
| 28 | 925 | 886.938259504475 | 38.0617404955248 |
| 29 | 1008 | 840.324140002465 | 167.675859997535 |
| 30 | 952 | 960.37537531772 | -8.3753753177198 |
| 31 | 1324 | 1081.44060064997 | 242.559399350026 |
| 32 | 1033 | 954.81498934811 | 78.1850106518903 |
| 33 | 937 | 904.020338163714 | 32.9796618362862 |
| 34 | 941 | 896.117483845644 | 44.8825161543558 |
| 35 | 819 | 887.036830141485 | -68.0368301414853 |
| 36 | 582 | 824.429561492326 | -242.429561492326 |
| 37 | 1111 | 1066.75254461344 | 44.24745538656 |
| 38 | 1008 | 900.708986983923 | 107.291013016077 |
| 39 | 847 | 687.670901988986 | 159.329098011014 |
| 40 | 592 | 875.361003083211 | -283.361003083211 |
| 41 | 1207 | 1106.71661095833 | 100.283389041668 |
| 42 | 1299 | 1055.97405200483 | 243.025947995165 |
| 43 | 819 | 871.861315838255 | -52.861315838255 |
| 44 | 1008 | 755.863502122164 | 252.136497877836 |
| 45 | 674 | 929.885166029569 | -255.885166029569 |
| 46 | 1008 | 935.008144670113 | 72.9918553298869 |
| 47 | 1008 | 845.46068725527 | 162.53931274473 |
| 48 | 581 | 867.121691593648 | -286.121691593648 |
| 49 | 946 | 901.177422926114 | 44.8225770738857 |
| 50 | 958 | 896.457812159134 | 61.5421878408659 |
| 51 | 938 | 874.496181213075 | 63.5038187869247 |
| 52 | 847 | 785.300260380494 | 61.6997396195065 |
| 53 | 950 | 915.184838606266 | 34.8151613937342 |
| 54 | 1008 | 955.196407734849 | 52.8035922651506 |
| 55 | 1054 | 912.093124759542 | 141.906875240458 |
| 56 | 745 | 975.064037106637 | -230.064037106637 |
| 57 | 1011 | 985.097029635161 | 25.902970364839 |
| 58 | 769 | 1038.00850389545 | -269.008503895454 |
| 59 | 1324 | 1333.48487353933 | -9.48487353933159 |
| 60 | 756 | 822.608249539159 | -66.6082495391591 |
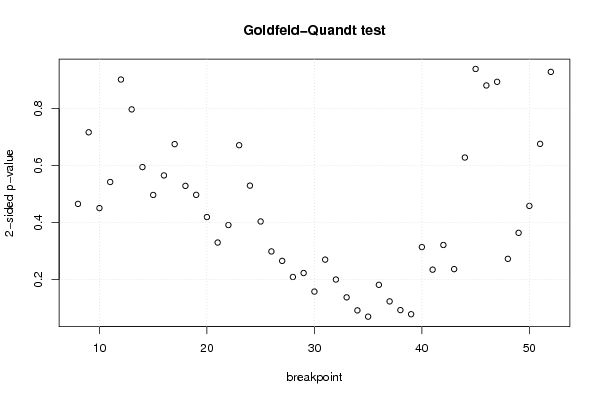
| Goldfeld-Quandt test for Heteroskedasticity | |||
| p-values | Alternative Hypothesis | ||
| breakpoint index | greater | 2-sided | less |
| 8 | 0.232887700243269 | 0.465775400486537 | 0.767112299756731 |
| 9 | 0.358433979709643 | 0.716867959419285 | 0.641566020290357 |
| 10 | 0.225526959737942 | 0.451053919475885 | 0.774473040262058 |
| 11 | 0.271294667403489 | 0.542589334806977 | 0.728705332596511 |
| 12 | 0.450943043585702 | 0.901886087171403 | 0.549056956414298 |
| 13 | 0.398576182650682 | 0.797152365301363 | 0.601423817349318 |
| 14 | 0.297434196139613 | 0.594868392279226 | 0.702565803860387 |
| 15 | 0.248568736770081 | 0.497137473540163 | 0.751431263229919 |
| 16 | 0.282801827124847 | 0.565603654249694 | 0.717198172875153 |
| 17 | 0.337641813340841 | 0.675283626681682 | 0.662358186659159 |
| 18 | 0.264504626797444 | 0.529009253594887 | 0.735495373202556 |
| 19 | 0.248791300254348 | 0.497582600508696 | 0.751208699745652 |
| 20 | 0.209861390928322 | 0.419722781856645 | 0.790138609071678 |
| 21 | 0.165158244431523 | 0.330316488863045 | 0.834841755568477 |
| 22 | 0.195891719072667 | 0.391783438145334 | 0.804108280927333 |
| 23 | 0.335781416603939 | 0.671562833207878 | 0.664218583396061 |
| 24 | 0.264913308546901 | 0.529826617093801 | 0.735086691453099 |
| 25 | 0.202115759247992 | 0.404231518495983 | 0.797884240752008 |
| 26 | 0.149573721563741 | 0.299147443127483 | 0.850426278436259 |
| 27 | 0.133026709825326 | 0.266053419650652 | 0.866973290174674 |
| 28 | 0.104782262238179 | 0.209564524476357 | 0.895217737761821 |
| 29 | 0.111757323657633 | 0.223514647315267 | 0.888242676342367 |
| 30 | 0.0791890645737139 | 0.158378129147428 | 0.920810935426286 |
| 31 | 0.135226394697044 | 0.270452789394089 | 0.864773605302956 |
| 32 | 0.100320965151369 | 0.200641930302737 | 0.899679034848632 |
| 33 | 0.0691419473106168 | 0.138283894621234 | 0.930858052689383 |
| 34 | 0.0462696315964873 | 0.0925392631929747 | 0.953730368403513 |
| 35 | 0.0352555109650293 | 0.0705110219300586 | 0.964744489034971 |
| 36 | 0.0910719206905307 | 0.182143841381061 | 0.908928079309469 |
| 37 | 0.0620185597605553 | 0.124037119521111 | 0.937981440239445 |
| 38 | 0.0467146647993006 | 0.0934293295986012 | 0.953285335200699 |
| 39 | 0.0395040034651609 | 0.0790080069303219 | 0.960495996534839 |
| 40 | 0.157262199767221 | 0.314524399534443 | 0.842737800232778 |
| 41 | 0.117597224070618 | 0.235194448141237 | 0.882402775929382 |
| 42 | 0.160856289864222 | 0.321712579728443 | 0.839143710135778 |
| 43 | 0.118556132828991 | 0.237112265657982 | 0.881443867171009 |
| 44 | 0.314203137604405 | 0.62840627520881 | 0.685796862395595 |
| 45 | 0.530533204061779 | 0.938933591876442 | 0.469466795938221 |
| 46 | 0.440541770887042 | 0.881083541774084 | 0.559458229112958 |
| 47 | 0.553074830292954 | 0.893850339414093 | 0.446925169707046 |
| 48 | 0.863432598296126 | 0.273134803407747 | 0.136567401703874 |
| 49 | 0.817823492428204 | 0.364353015143593 | 0.182176507571796 |
| 50 | 0.770626629821905 | 0.45874674035619 | 0.229373370178095 |
| 51 | 0.661900056244261 | 0.676199887511478 | 0.338099943755739 |
| 52 | 0.535675491181845 | 0.928649017636311 | 0.464324508818156 |
| Meta Analysis of Goldfeld-Quandt test for Heteroskedasticity | |||
| Description | # significant tests | % significant tests | OK/NOK |
| 1% type I error level | 0 | 0 | OK |
| 5% type I error level | 0 | 0 | OK |
| 10% type I error level | 4 | 0.0888888888888889 | OK |