| Multiple Linear Regression - Estimated Regression Equation |
| Omzet_product[t] = -480.616464653968 + 0.533659564985191tijd[t] -0.000135648760935616Uitgaven_voor_promotie[t] -0.647651480072136Prijs_product[t] + 0.450211575231433Gem_budget[t] + 0.019622941502175Index_cons_vertrouwen[t] -0.00826729887996955uitgave_lok_prom[t] + e[t] |
| Multiple Linear Regression - Ordinary Least Squares | |||||
| Variable | Parameter | S.D. | T-STAT H0: parameter = 0 | 2-tail p-value | 1-tail p-value |
| (Intercept) | -480.616464653968 | 1248.06171 | -0.3851 | 0.703709 | 0.351854 |
| tijd | 0.533659564985191 | 0.631924 | 0.8445 | 0.407089 | 0.203544 |
| Uitgaven_voor_promotie | -0.000135648760935616 | 0.000192 | -0.7065 | 0.486992 | 0.243496 |
| Prijs_product | -0.647651480072136 | 0.191151 | -3.3882 | 0.00253 | 0.001265 |
| Gem_budget | 0.450211575231433 | 0.000395 | 1139.7472 | 0 | 0 |
| Index_cons_vertrouwen | 0.019622941502175 | 0.084496 | 0.2322 | 0.818409 | 0.409205 |
| uitgave_lok_prom | -0.00826729887996955 | 0.008993 | -0.9193 | 0.367474 | 0.183737 |
| Multiple Linear Regression - Regression Statistics | |
| Multiple R | 0.999992562355233 |
| R-squared | 0.999985124765785 |
| Adjusted R-squared | 0.999981244269903 |
| F-TEST (value) | 257695.19029221 |
| F-TEST (DF numerator) | 6 |
| F-TEST (DF denominator) | 23 |
| p-value | 0 |
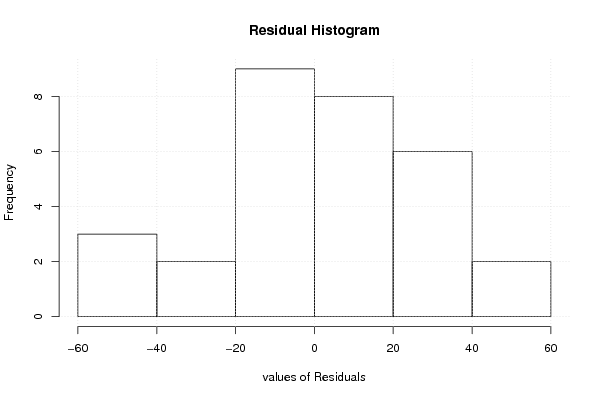
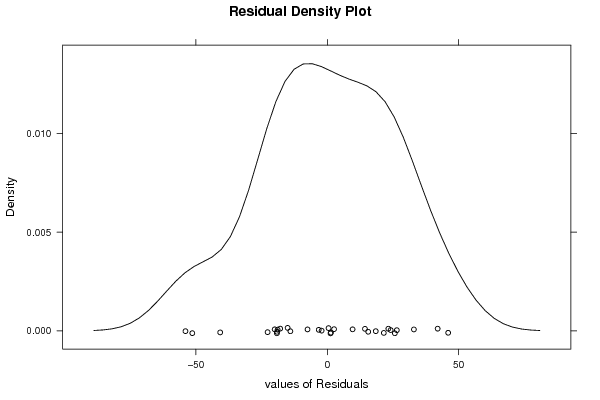
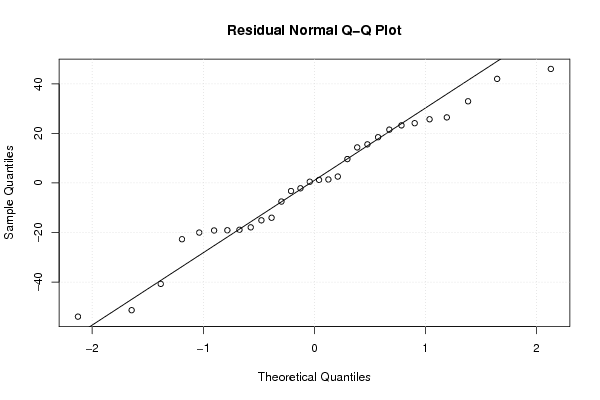
| Multiple Linear Regression - Residual Statistics | |
| Residual Standard Deviation | 28.6248261545835 |
| Sum Squared Residuals | 18845.755464743 |
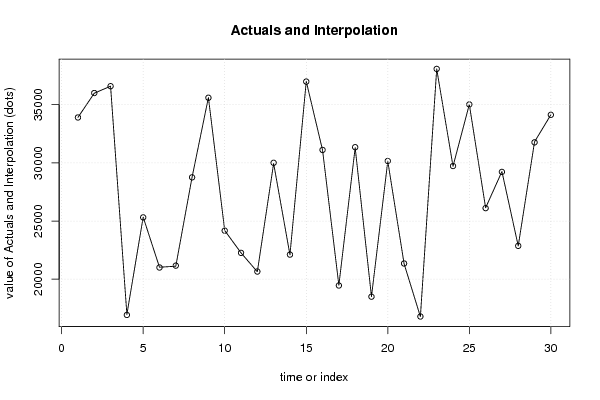
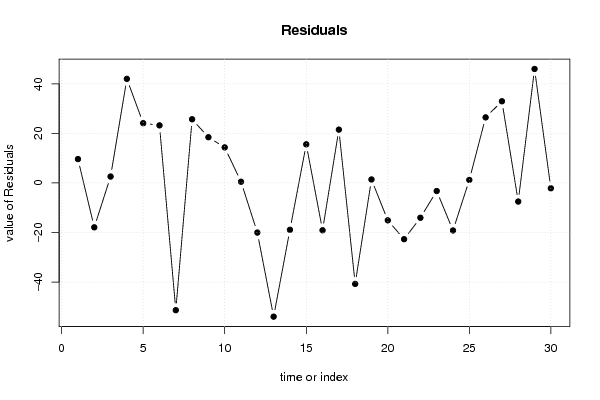
| Multiple Linear Regression - Actuals, Interpolation, and Residuals | |||
| Time or Index | Actuals | Interpolation Forecast | Residuals Prediction Error |
| 1 | 33907 | 33897.3596777405 | 9.64032225952197 |
| 2 | 35981 | 35998.911699792 | -17.9116997919551 |
| 3 | 36588 | 36585.4119880103 | 2.58801198973783 |
| 4 | 16967 | 16924.9793748368 | 42.0206251632284 |
| 5 | 25333 | 25308.8724395952 | 24.1275604047584 |
| 6 | 21027 | 21003.7463817704 | 23.2536182296448 |
| 7 | 21114 | 21165.3582248238 | -51.3582248237759 |
| 8 | 28777 | 28751.2886074678 | 25.7113925322468 |
| 9 | 35612 | 35593.5369323211 | 18.4630676788975 |
| 10 | 24183 | 24168.6493000037 | 14.3506999962521 |
| 11 | 22262 | 22261.5008351182 | 0.499164881835331 |
| 12 | 20637 | 20657.0192591705 | -20.0192591705462 |
| 13 | 29948 | 30001.9668628494 | -53.9668628493767 |
| 14 | 22093 | 22111.8940516498 | -18.8940516497631 |
| 15 | 36997 | 36981.4089614716 | 15.5910385284067 |
| 16 | 31089 | 31108.0939613519 | -19.0939613519112 |
| 17 | 19477 | 19455.4694736393 | 21.5305263606555 |
| 18 | 31301 | 31341.7415776267 | -40.7415776266614 |
| 19 | 18497 | 18495.5966069799 | 1.40339302008012 |
| 20 | 30142 | 30157.0786648927 | -15.0786648926767 |
| 21 | 21326 | 21348.7069476537 | -22.7069476537023 |
| 22 | 16779 | 16793.0404714474 | -14.0404714473812 |
| 23 | 38068 | 38071.2495266592 | -3.24952665924091 |
| 24 | 29707 | 29726.1715794707 | -19.1715794707365 |
| 25 | 35016 | 35014.7732271573 | 1.22677284270569 |
| 26 | 26131 | 26104.5260078524 | 26.4739921475894 |
| 27 | 29251 | 29218.0197758763 | 32.9802241236639 |
| 28 | 22855 | 22862.5044290525 | -7.50442905250083 |
| 29 | 31806 | 31759.9739233731 | 46.0260766269473 |
| 30 | 34124 | 34126.1492303459 | -2.14923034594396 |
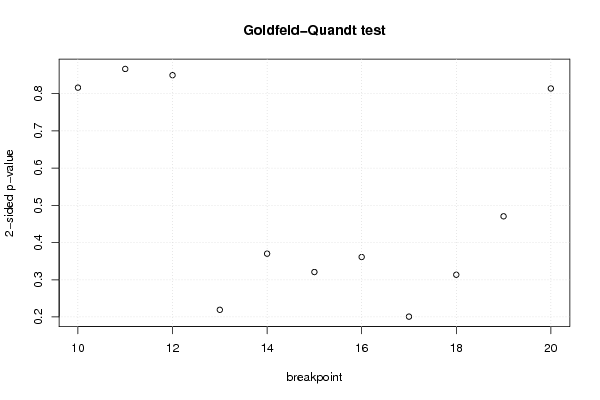
| Goldfeld-Quandt test for Heteroskedasticity | |||
| p-values | Alternative Hypothesis | ||
| breakpoint index | greater | 2-sided | less |
| 10 | 0.591799221867264 | 0.816401556265472 | 0.408200778132736 |
| 11 | 0.56668310676213 | 0.86663378647574 | 0.43331689323787 |
| 12 | 0.424909005950818 | 0.849818011901635 | 0.575090994049182 |
| 13 | 0.890365589268808 | 0.219268821462384 | 0.109634410731192 |
| 14 | 0.814930966778429 | 0.370138066443143 | 0.185069033221571 |
| 15 | 0.839596585327425 | 0.320806829345151 | 0.160403414672575 |
| 16 | 0.819414223314394 | 0.361171553371212 | 0.180585776685606 |
| 17 | 0.899558068355143 | 0.200883863289715 | 0.100441931644857 |
| 18 | 0.843244828374168 | 0.313510343251663 | 0.156755171625832 |
| 19 | 0.764698962629226 | 0.470602074741548 | 0.235301037370774 |
| 20 | 0.592937233595381 | 0.814125532809239 | 0.407062766404619 |
| Meta Analysis of Goldfeld-Quandt test for Heteroskedasticity | |||
| Description | # significant tests | % significant tests | OK/NOK |
| 1% type I error level | 0 | 0 | OK |
| 5% type I error level | 0 | 0 | OK |
| 10% type I error level | 0 | 0 | OK |